PROPOSED 2010-2011 PROGRAM-BUDGET
MAIN DOCUMENT
San Jose, Costa Rica
IICA/CE/Doc.541 (09) Original: Spanish 14-16 July 2009
FOREWORD
The present document contains IICA’s proposed Program Budget for the 2010-2011 biennium.
Considering that the Medium-Term Plan currently in force covers the period 2006 to 2010 and that in January 2010, a new administration will take office, the proposal is to approve the sources of funding for the Regular Fund for 2010 and 2011, and the detailed Program Budget for 2010 only.
The document also provides information on the external resources that are expected to be executed and the preliminary allocation of INR resources for financing the complementary structures of IICA Offices in Member States and units at Headquarters that have responsibility for executing external resources, as well as corporate activities to support execution of those resources.
It is estimated that for 2010, external resources will amount to US$145,012,700 and INR resources will amount to US$8,559,700. The allocation of INR resources, plus the indicated amount of external resources, would be US$9,559,700. Of this amount, US$8,559,700 would be generated in 2010 and US$1,000,000 would come from the INR Fund, which is estimated at US$2,000,000 as of December 31, 2009. The final allocation of INR resources is subject to the signing of agreements that give rise to programs and projects financed with external resources and to the projected estimate of INR resources to be generated as a result of these agreements.
The proposed Program Budget financed with the Regular Fund is based on the following considerations:
The allocation of human and financial resources in accordance with the strategic guidelines and priorities in the 2006-2010 Medium-Term Plan;
The concentration of technical cooperation services on the priorities defined in the 2006-2010 MTP: approximately 25.1% for promoting trade and the competitiveness of agribusiness, 21.6% for promoting technology and innovation, 21.6% for promoting agricultural health and food safety, 15.7% for promoting the development of rural communities based on a territorial approach, 7.2% for promoting the sustainable management of natural resources and the environment, and 8.8% for the priority of repositioning agriculture and rural life and renewing their institutional framework;
The amount to be financed with Member State quotas, which has been frozen since 1995, remains the same as in the 2008-2009 biennium.
The percentage distribution of Member State quotas is based on Resolution AG/RES. 1 (XXXVI-E/08) rev. 1 of the Thirty-sixth Special Session of the OAS General Assembly in accordance with the provisions of Article 23 of the Convention on IICA, which states “The Member States shall contribute to the maintenance of the Institute through annual quotas established by the Board, in accordance with the system for calculating quotas of the Organization of American States” and with the applicable rules of procedure. The programming of miscellaneous income is based on the
estimation of income for each year of the biennium, and the request to use up to two million two hundred thousand dollars (US$1,100,000 per year) from the Miscellaneous Fund, which, as of December 31, 2008, showed a balance of US$10.7 million. This will make it possible to restore part of the purchasing power lost since 1995, without having a major
impact on reserves established to meet financial needs in the eventuality of delays in the payment of Member State quotas. In the 2008-2009 Program Budget, the IABA authorized the use of up to US$500,000 per year from the Miscellaneous Fund. In 2008, resources were not used from that Fund
because receipts exceeded expenditures during the year (US$6,993,987 received and US$4,092,589 spent).
The additional amount of miscellaneous resources programmed is earmarked mostly to finance hemispheric programs created in response to mandates from the Governing Bodies.
Contents
I. INTRODUCTION ... 1
II. STRATEGIC GUIDELINES FOR 2010 ... 1
M MIISSSSIIOON ... 1 N V VIISSIIOONN ... 1 V VAALLUUEES ... 1 S P PRRIIOORRIITTIIEESSFFOORRSSTTRRAATTEEGGIICCAACCTTIIOON ... 2 N III. THE OVERALL BUDGET FOR 2010 ... 5
IV. RESOURCES OF THE REGULAR FUND ... 5
V. ALLOCATION OF REGULAR FUND RESOURCES BY CHAPTER ... 6
VI. ALLOCATION OF REGULAR FUND RESOURCES BY SCOPE OF ACTION ... 8
VII. PRIORITY ACTIONS FOR 2010 ... 9
VIII. ALLOCATION, BY STRATEGIC PRIORITY, OF REGULAR FUND RESOURCES FOR DIRECT TECHNICAL COOPERATION SERVICES ... 9
IX. ALLOCATION OF REGULAR FUND RESOURCES BY MAJOR OBJECT OF EXPENDITURE ... 10
X. USE OF QUOTA CONTRIBUTIONS ... 12
I.
Introduction
The present document contains IICA’s proposed IICA Program Budget for the 2010-2011 biennium.
Considering that the Medium-Term Plan currently in force covers the period 2006 to 2010 and that in January 2010, a new administration will take office, the proposal is to approve the sources of funding for the Regular Fund for 2010 and 2011, and the detailed Program Budget for 2010 only.
The purposes of the 2010 Program Budget are: i) to define the cooperation actions on which the Institute will concentrate its efforts, financed by the Regular Fund, to implement the strategic guidelines and priorities set forth in the 2006-2010 MTP; ii) to specify the Institute’s priority actions, the role of IICA in each priority action, the expected results and the performance indicators for activities financed by the Regular Fund; iii) to show the external resources that are expected to be executed and the financing of the Complementary Structure financed with INR resources needed to support the execution of those external resources; iv) to approve the financing for the biennium, based on both the quota contributions of the Member States and miscellaneous income; and, v) to allocate Regular Fund resources (quota contributions of the Member States and miscellaneous income), taking into account the actions defined by the units of the Institute’s General Directorate.
II. Strategic Guidelines for 2010
The 2010 Program Budget will make it possible to conclude implementation of the 2006-2010 Medium-Term Plan, based on the elements described below.
M
Mi
is
ss
si
io
on
n
IICA is the specialized agency for agriculture and the rural milieu of the Inter-American System, whose purpose is to provide innovative technical cooperation to the Member States, with a view to achieving their sustainable development in aid of the peoples of the Americas.
V
Vi
is
si
io
on
n
To be the leading agricultural institution in the Americas and the partner of choice by virtue of the quality of the technical cooperation it provides in response to the needs of Member States, and its contributions to sustainable agricultural development, food security and rural prosperity.
V
Va
al
lu
ue
es
s
IICA’s future actions in the hemisphere will continue to be based on its fundamental principles and values, as will be reflected in its internal policies and relations with the Member States and strategic partners. These are:
i. Social and environmental responsibility ii. Respect for diversity
iii. Partnerships to enhance impact iv. Leadership through excellence v. Adherence to rules and regulations
vi. Efficiency, transparency and financial prudence vii. Interdisciplinary approaches
viii. Teamwork
ix. Excellence in performance
x. Education and knowledge as underpinnings of technical cooperation
P
Pr
ri
io
or
ri
it
ti
ie
es
s
f
fo
or
r
S
St
tr
ra
at
te
eg
gi
ic
c
A
Ac
ct
ti
io
on
n
The 2006-2010 Medium-Term Plan is designed to consolidate the new technical cooperation model, which is based on four interrelated and complementary components. The first is designed to facilitate consensus and monitor strategies, and includes the AGRO 2003-2015 Plan of Action and national and regional development strategies. The second component concerns the commitment to promote the permanent monitoring of agriculture and rural life in order to update the biennial hemispheric agendas of the AGRO 2003-2015 Plan, and define national and regional strategies. The third calls for actions aimed at promoting greater coordination among international organizations, to enable them to provide more effective responses to the needs of the countries and articulate their respective activities. The fourth component comprises the direct technical cooperation services that IICA provides under its national, regional and hemispheric technical cooperation agendas.
In pursuing its vision and mission, IICA takes into account the challenges and opportunities of the global context, defining its strategic priorities for technical cooperation on which it focuses its efforts and resources. Institutional actions are established for each of the priorities and define the Institute’s sphere of action.
Depending on the nature and specific characteristics of the different processes and technical cooperation activities, and on the institutions, stakeholders and strategic partners involved in the process and the geographic level on which they operate, IICA uses ad hoc cooperation methods and instruments and performs different functions to achieve its results, the most important of which are as follows:
i. Organize and implement forums for reflection, dialogue and consensus building at the hemispheric, regional and national levels on critical issues related to agriculture and rural life in the Americas;
ii. Devise and propose to the Member States strategies, policies, plans, programs and projects for the development of agriculture and rural life;
iii. Devise and propose to the Member States institutional models for the development of agriculture and rural life; iv. Devise and propose to the Member States conceptual
frameworks, methodologies, mechanisms, procedures and instruments for the design, planning, management, monitoring and evaluation of agricultural and rural development actions;
v. Reach agreement on, program and coordinate actions involving horizontal cooperation among countries, and support their articulation at the international level to enable them to share know-how and experiences and link up with institutions in other parts of the world with a view to enhancing their capabilities for the sustainable development of agriculture and the rural milieu;
vi. Gather, compile and analyze information about the state and performance of agriculture in general, and the thematic areas on which the Institute focuses, to support decision-making processes;
vii. Establish knowledge networks with the participation of partner international organizations and the Member States, to document and disseminate experiences with regard to good practices, and to design and implement training programs with a view to developing capabilities in the Member States for addressing critical issues related to agriculture and rural life;
viii. Set up and operate information and knowledge management systems, based on the new information and communication technologies, to disseminate information
and knowledge and keep the Institute’s personnel and clients abreast of the chief developments related to the topics of concern to the Member States;
ix. To provide special cooperation to research and educational organizations, with a view to fulfilling the commitments assumed by the IABA with the Tropical Agriculture Research and Higher Education Center (CATIE) and the Caribbean Agricultural Research and Development Institute (CARDI).
Accordingly, IICA will focus its efforts and resources on the strategic priorities described below.
1.
Contribute to the repositioning of agriculture and rural
life and to a new institutional framework
To implement this strategic priority, two types of actions are being carried out. The first group of actions is designed to help reposition agriculture and rural life on the development agendas of the countries. The second supports the construction of a new institutional framework to help achieve the objectives contained in the Vision: sustainable agricultural development, rural prosperity and food security.
General objective: To contribute to the repositioning of agriculture and rural life and to a new institutional framework
Areas of concentration:
The generation and dissemination of information for decision making by public and private actors in agriculture and rural life; and
The promotion of the construction of a new institutional framework.
2.
Direct technical cooperation
Direct technical cooperation is being provided by focusing actions on five strategic priorities whose objectives and areas of concentration are described below:
2.1 Promoting trade and the competitiveness of agribusinesses
General objective: To support the efforts of the countries to take advantage of the benefits of trade opening and the establishment of free trade areas, through the development of competitive agribusinesses and the promotion of trade.
Areas of concentration:
Trade integration and trade agreements. Development of competitive agribusinesses.
2.2 Promoting the development of rural communities based on a territorial approach
General objective: To assist the countries in formulating development strategies that focus on rural territories and promote prosperity in rural communities by generating employment and income, and reducing the gaps between rural and urban areas.
Areas of concentration:
Management of rural territories. Consolidation of family agriculture.
Promotion of opportunities for rural women and youths to participate in development.
2.3 Promoting agricultural health and food safety (AHFS)
General objective: To promote and support capacity building and the modernization of agricultural health and food safety services, in an effort to improve the sanitary and phytosanitary status of member countries and thus enable them to compete more successfully in agrifood trade.
Areas of concentration:
Modernization of public agricultural health and food safety services.
Capacity building to promote the implementation and administration of sanitary and phytosanitary measures. Emerging issues and emergencies.
Food safety.
2.4 Promoting the sustainable management of natural resources and the environment
General objective: To support the efforts of the member countries to transform their institutions, with a view to managing the environment and natural resources in such a way as to ensure the sustainable development of agriculture and the rural milieu.
Areas of concentration:
Articulation of agriculture, trade and the environment. Integrated natural resources management for agricultural and
rural development.
Impact of global environmental changes on agrifood systems. Promotion of good environmental management practices in
agricultural and rural production.
2.5 Promoting the introduction of technology and innovation for the modernization of agriculture and rural development
General objective:To support the efforts of the member countries to modernize agriculture and enhance its contribution to economic, social and environmental development by promoting technological and institutional innovation policies and processes that will promote and facilitate the incorporation of new knowledge and technologies into agricultural production chains.
Areas of concentration:
A prospective vision of technology and innovation as they apply to agriculture.
Support for institutional modernization and the design of technology policies for the development and incorporation of technological innovations.
Strengthening of the hemispheric system for cooperation among countries in technological innovation for agriculture, and of its links with the international research system.
Promotion of information management to support technological innovation processes.
Biotechnology and biosafety.
Promotion of horizontal cooperation in agro-energy and bio-fuels.
Appendix 1 provides details of the general objectives and the areas
of concentration of each strategic priority. The specific objectives and lines of action for each area of concentration are also described.
Appendix 2 provides details of the priority actions, expected results
and performance indicators for direct technical cooperation, the repositioning of agriculture and rural life and the renewal of their institutional framework, and the management of cooperation, by unit.
III. The Overall Budget for 2010
The Institute finances its technical cooperation activities emanating from mandates of the Governing Bodies with resources from the Regular Fund. That Fund is made up of Member State quotas and miscellaneous income coming, basically, from financial yields, tax recovery, and the sale of assets and services. In addition, the Institute carries out additional technical cooperation through programs and projects financed with external resources, which are based on legal instruments signed with partners or counterparts. For the Institute, managing external resources means increased technical and administrative personnel requirements and increased operating costs. These additional costs are covered by the Institutional Net Rate that the counterparts undertake to pay IICA.
It is estimated that for 2010, external resources will amount to US$145,012,700 and INR resources will amount to US$8,559,700. The allocation of INR resources, plus the indicated amount of external resources, would be US$9,559,700. Of this amount, US$8,559,700 would be generated in 2010 and US$1,000,000 would come from the INR Fund, which is estimated at US$2,000,000, as of December 31, 2009. The final allocation of INR resources is subject to the signing of agreements that give rise to programs and projects financed with external resources and to the projected estimate of INR resources to be generated as a result of these agreements. The allocation policy indicates that 50 per cent of INR resources is allocated to the Offices in Member States, and the other 50 per cent is used to finance complementary structures of units and corporate activities that provide direct support in the execution of external resources.
The proposed Regular Fund budget for 2010 is US$33,398,200. Of this amount, US$27,298,200 corresponds to Member State quotas and US$6,100,000 corresponds to miscellaneous income.
The approval of Regular Fund resources, quotas and miscellaneous income indicates a mandate of maximum amounts for execution in
2010. Data on external and INR resources are purely indicative and their approval is subject to the signing of agreements and to the generation of the respective INR resources.
In sum, the overall budget for 2010 is as follows:
Overall Budget US$ x000
Source 2010
Quotas 27,298,200 Miscellaneous 6,100,000
Total Regular Fund 33,398,200 External 145,012,700 INR 9,559,700 Total 187,970,600
Table No. 1 shows the overall budget by source. Table No. 2 breaks
down the overall budget by programming center and source of financing and Table No. 3 shows the preliminary allocation of INR resources by programming center and major object of expenditure.
IV. Resources of the Regular Fund
The proposed 2010 Program Budget, in specific relation to the Regular Fund, calls for:
Regular Fund resources to be concentrated on the priorities and guidelines defined in the 2006-2010 Medium Term Plan and the national, regional and hemispheric Technical Cooperation Agendas.
Total of Member State quotas to remain unchanged, as they have since 1995.
The adjustment of miscellaneous income to match the amount expected to be generated during the biennium.
Requesting the use of US$1,100,000 for the year from the Miscellaneous Fund, which, as of December 31, 2008, showed a balance of US$10,773,080.
Applying the additional resources generated by the increase in the Regular Fund to hemispheric actions that are in response to mandates from the Governing Bodies, some of which have been financed with the Special Budgets approved by the IABA. Those hemispheric actions are:
o The Initiative for the Americas in Sanitary and Phytosanitary Measures
o Support for Horizontal Cooperation Initiatives among Member States
o Center for Leadership in Agriculture
o Systematization and Dissemination of Experiences in the Field of Agricultural Insurance
o Hemispheric Agrotourism Program o Promotion of Organic Agriculture o Strengthening of Technical Expertise o Technical Cooperation in Food Security
Table 4 shows the evolution of the budget of the Regular Fund in
recent years and the overall amounts proposed for the 2010-2011 biennium.
Table 5 shows the proposed quota scale for the Member States, and
the estimated total amount of miscellaneous income and the use of the Miscellaneous Fund for the 2010-2011 biennium. This proposed quota scale is based on:
The recommendation of the Special Advisory Committee on Management Issues, calling for the total amount of Member State quotas to remain unchanged.
An estimation of US$5,000,000 per year in miscellaneous income.
The use of up to US$1,100,000 per year from the Miscellaneous Fund.
A distribution, by percentage, of the Member State quotas, based on Resolution AG/RES. 1 (XXXVI-E/O) rev. 1 of the Thirty-sixth Special Session of the OAS General Assembly in accordance with the provisions of Article 23 of the Convention on IICA, which states “The Member States shall contribute to the maintenance of the Institute through annual quotas established by the Board, in accordance with the system for calculating quotas of the Organization of American States” and with the applicable rules of procedure.
V. Allocation of Regular Fund Resources by
Chapter
The Institute’s budget is divided into four chapters:
Chapter I: Direct Technical Cooperation Services Chapter II: Management Costs
Chapter III: General Costs and Provisions
Chapter IV: Renewal of Infrastructure and Equipment
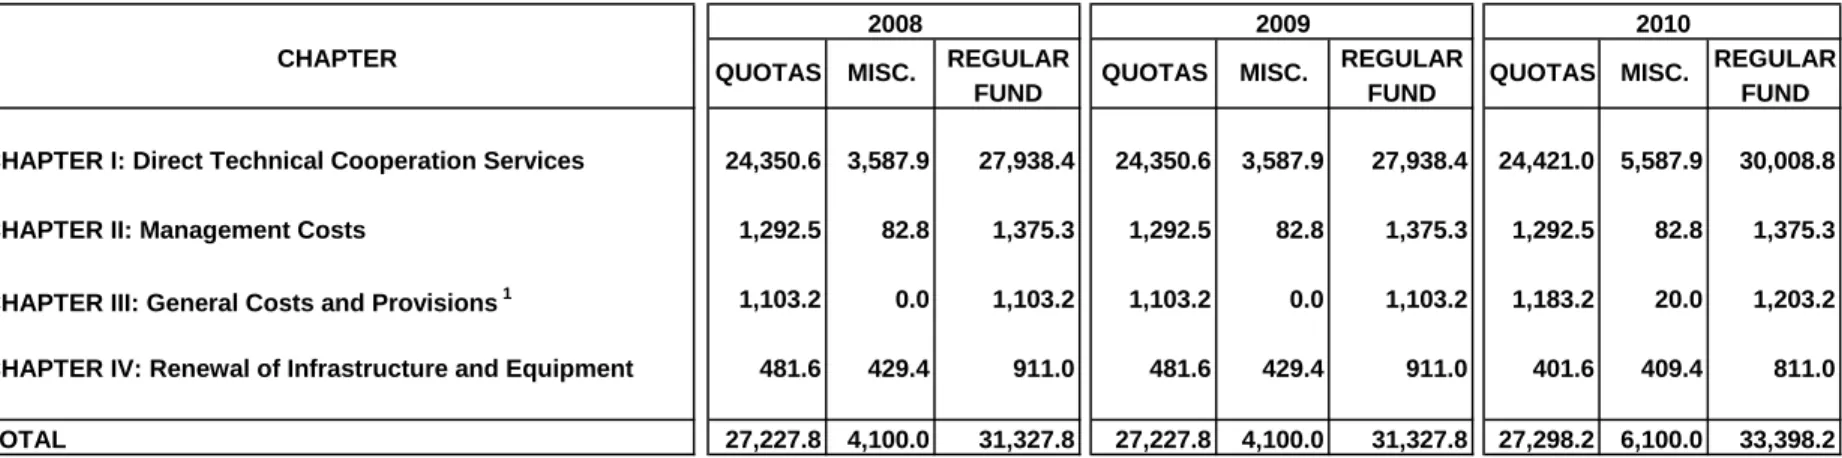
Table 6 shows the proposed allocation of resources from the Regular
Fund for the 2010, by Chapter. The 2008-2009 Program Budget is shown for purposes of comparison.
Chapter I: Direct Technical Cooperation Services
This Chapter contains the costs of the Institute’s technical cooperation actions at the national, regional and hemispheric levels required to achieve the objectives set in the Medium Term Plan. It includes IICA’s contribution to the Tropical Agriculture Research and Higher Education Center (CATIE). The resources allocated for this Chapter are as follows:
Chapter I: Direct Technical Cooperation Services (US$ x 000)
Source 2008 2009 2010
Quotas 24,350.6 24,350.6 24,421.0
Miscellaneous 3,587.9 3,587.9 5,587.9
Total 27,938.5 27,938.5 30,008.8
The increase in resources is focused on the Hemispheric Technical Cooperation Programs created in response to mandates from the Governing Bodies and is financed with the additional miscellaneous resources requested (US$2,000,000) and a slight increase in quotas due to a reduction in the percentage to be contributed by Cuba. Tables No. 22 and 23 show the distribution of this Chapter by Strategic Priority.
Chapter II: Management Costs
Chapter II: Management Costs include the resources of the units responsible for managing the Institute and providing support services. These units, which are located at Headquarters, are the Office of the Director General and the Directorate of Administration and Finance. The resources that these units use to
renew their infrastructure and equipment (Chapter IV) are not included. The resources allocated for this Chapter are:
Chapter II: Management Costs (US$ x 000)
Source 2008 2009 2010
Quotas 1,292.5 1,292.5 1,292.5
Miscellaneous 82.8 82.8 82.8
Total 1,375.3 1,375.3 1,375.3
The amounts allocated to this Chapter as the same as those for the 2008-2009 biennium.
Table 7 shows the allocation of the Regular Fund for 2010, by Unit,
for this Chapter.
Chapter III: General Costs and Provisions
General Costs and Provisions are general commitments not directly related to the preceding chapters or to a specific Unit. They include support for the Governing Bodies, insurance, the OAS Administrative Tribunal, the external audit, the pensions of former Directors General and other former staff members and the Emergency Assistance Fund for IICA Personnel. The resources for this Chapter are:
Chapter III: General Costs and Provisions (US$ x 000)
Source 2008 2009 2010
Quotas 1,103.2 1,103.2 1,183.2
Miscellaneous - - 20.0
The increase in the allocation for 2010 over the 2008-2009 biennium can be attributed to increases in the cost of insurance (US$60,000) and the pensions of former Directors General and other former staff members (US$25,000) and a reduction (US$5,000) for meetings of the Governing Bodies. Also included is the Emergency Assistance Fund for IICA Personnel (US$20,000). The amount allocated for meetings of the Governing Bodies was reduced by US$5,000.
Table 8 gives a breakdown of the content of this Chapter for 2010. Chapter IV: Renewal of Infrastructure and Equipment
The budget items included in this Chapter are improvements to IICA-owned properties and buildings; the purchase of vehicles; the purchase of office equipment, communications, the reproduction of documents, security, printing and the purchase of computer equipment and licenses.
The resources allocated are:
Chapter IV: Renewal of Infrastructure and Equipment (US$ x 000)
Source 2008 2009 2010
Quotas 481.6 481.6 401.6
Miscellaneous 429.4 429.4 409.4
Total 911.0 911.0 811.0
The allocation to this Chapter has been reduced by US$100,000 because in previous years a major investment has been made in this area, and in order to offset the increase in Chapter III: General Costs and Provisions.
Personnel and Operating Costs, by Chapter, for 2010, financed by the Regular Fund
Tables 9, 10, 11 and 12 show, for each Chapter: i) allocations by
groups of objects of expenditure (International Professional Personnel, Local Professional Personnel, General Services Personnel and Operating Costs); ii) the number of personnel positions, by category and class; and, iii) the sources of funding for each chapter.
Table 13 summarizes the data for the four Chapters, showing the
overall allocation of the Regular Fund by object of expenditure and the number of personnel by category and class.
VI.
Allocation of Regular Fund Resources by
Scope of Action
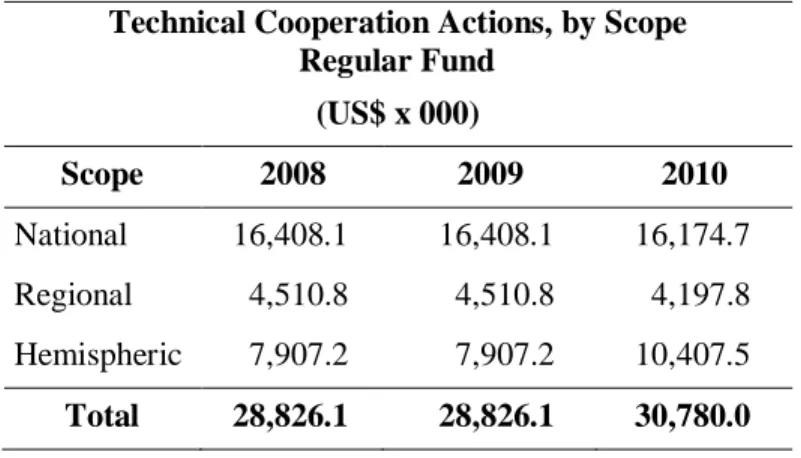
The allocation of resources of the Regular Fund for the units, programs and projects responsible for technical cooperation at the national, regional and hemispheric levels, which includes Chapters I: Direct Technical Cooperation and IV: Renewal of Infrastructure and Equipment of those units, programs and projects, are distributed as follows:
Technical Cooperation Actions, by Scope Regular Fund (US$ x 000) Scope 2008 2009 2010 National 16,408.1 16,408.1 16,174.7 Regional 4,510.8 4,510.8 4,197.8 Hemispheric 7,907.2 7,907.2 10,407.5 Total 28,826.1 28,826.1 30,780.0
Table 14 shows the overall variations by scope of action between
2010 and 2009. The corresponding allocation is based on the following:
The amount of quota resources allocated for technical cooperation actions at the national level (see Table 16) increases slightly, and the allocation of miscellaneous resources is reduced to distribute them to hemispheric actions (See Table 15.)
The amount of resources allocated for regional actions in 2010 decreases due fundamentally to the reclassification of the Agrotourism Program and PRODAR as hemispheric and concentration on the strategic priorities of the current MTP (See
Table 15.)
The amount of resources allocated to hemispheric technical cooperation actions increases in order to carry out the mandates issued by the Governing Bodies with regard to topics such as: the Initiative for the Americas in Sanitary and Phytosanitary Measures; Support for Horizontal Cooperation Initiatives among Member States; Center for Leadership in Agriculture; Systematization and Dissemination of Experiences in the Field of Agricultural Insurance; Hemispheric Agrotourism Program; Promotion of Organic Agriculture; Strengthening of Technical Expertise; and Technical Cooperation in Food Security. (See
Tables 15 and 21.)
The country-by-country breakdown of the quota resources allocated can be seen in Table 16, with all countries receiving at least the same allocation of quota resources as in 2009.
Tables 17, 18 and 19 show the allocation of the Regular Fund (quota
contributions and miscellaneous income) at the national, regional and hemispheric levels.
Table 20 shows the resources allocated to each Cooperative Project
and Project in Support of Integration from 2008 to 2010.
Table 21 shows the resources earmarked for special hemispheric
technical cooperation programs created by mandate of the Governing Bodies. This table shows the variations between 2010 and 2008 and 2009, which include the addition of a profession in Food Safety to the Inter-American Program for the Promotion, Agribusiness and Food Safety; the inclusion of the programs previously financed with the Special Budget; and the reinforcement of other programs previously financed with the Regular Fund. They are: PROCITROPICOS, organic agriculture, agrotourism, PRODAR, the Center for Leadership in Agriculture, agricultural insurance, horizontal cooperation, strengthening of technical expertise, food security and the initiative for the Americas in sanitary and phytosanitary measures.
VII.
Priority Actions for 2010
The resources budgeted are based on the priority actions that will be carried out in 2010, both for technical cooperation and for management of cooperation.
Appendix 2 shows the priority actions, the role of IICA in each
priority action, the expected results and the performance indicators for each of the Institute’s operating units, both for technical cooperation actions, by strategic priority, and institutional management for technical cooperation. It also shows the resources allocated for each operating unit and their estimated distribution by strategic priority.
VIII.
Allocation, by Strategic Priority, of Regular
Fund Resources for Direct Technical
Cooperation Services
As explained in section “II. Strategic Guidelines for 2010,” this proposal focuses the cooperation actions on one priority designed to help reposition agriculture and rural life and the renewal of its
institutional framework, and on five strategic priorities for direct technical cooperation. The latter are: Promotion of Trade and the Competitiveness of Agribusinesses; Promotion of the Development of Rural Communities via the Adoption of a Territorial Approach; Promotion of Agricultural Health and Food Safety; Promotion of the Sustainable Management of Natural Resources and the Environment; and Promotion of the Incorporation of Technology and Innovation for the Modernization of Agriculture and Rural Development.
The resources allocated to each of the six Strategic Priorities comprise the amounts earmarked for:
Hemispheric Technical Cooperation Actions. Institutional Funds and Line Items.
Regional Technical Cooperation Actions.
The national actions programmed by each Office, by Strategic Priority, in accordance with the National Technical Cooperation Agenda agreed upon.
Activities to provide Technical Support to Technical Cooperation Actions at the national, regional and hemispheric levels.
A breakdown of this information by Strategic Priority, for quota resources of the Regular Fund, appears in Appendix 3.
The resources of the chapter for direct technical cooperation services are distributed as follows: 25.1% for trade and the competitiveness of agribusinesses; 21.6% for technology and innovation; 21.6% for agricultural health and food safety; 15.7% for the development of rural communities; 7.2% for natural resources and the environment; and 8.8% for the repositioning of agriculture and rural life and the renewal of its institutional framework.
Funds were allocated taking into account the agreements reached with the countries for responding to the National and Regional Agendas, and the mandates received from IICA’s Governing Bodies to address the issues on the Hemispheric Agenda. The proportion of resources earmarked for each Strategic Priority is the same as in the 2008-2009 biennium.
Table 22 shows the allocation of the Regular Fund for each of the
Strategic Priorities. Table 23 shows the evolution by Strategic Priority since 2008.
IX. Allocation of Regular Fund Resources by
Major Object of Expenditure
The distribution of the Regular Fund by Major Object of Expenditure (MOE) for 2010 is as follows:
2010 Major Object of Expenditure US$ x 000 %
1. International Professional Personnel 11,681.3 35.0 2. Local Professional and General Services
Personnel 9,169.0 27.5
Subtotal Personnel 20,850.3 62.4
3. Training and Technical Events 1,142.7 3.4
4. Official Travel 2,004.6 6.0
5. Documents and Supplies and Inputs 1,018.0 3.9 6. Plant, Equipment and Furniture 811.0 2.9
7. General Services 2,990.3 9.2
8. Performance Contracts and Transfers 3,713.0 11.2
9. Other Costs 868.4 2.6
Subtotal Operating Costs 12,547.9 37.6
Considering that the Institute is a technical cooperation organization whose main strength is the knowledge of its personnel, 62.4% of the budget of the Regular Fund is earmarked for personnel costs and 37.6% for operating costs.
Table 24 shows the proposed allocation of the Regular Fund by
Major Object of Expenditure for 2010 and information on the amounts approved for the 2008-2009 Program Budget.
Table 25 gives a breakdown for each major object of expenditure
(the items of which they are composed, in monetary and percentage terms) to make it easier to understand the purposes of each one. The cost of Major Object of Expenditure 1: International Professional Personnel increases by 6.2% in 2010 over 2009 due to the creation of a position in the Food Security area and to effects of the increase in the Post Adjustment per Member State.
The cost of Major Object of Expenditure 2: Local Professional and General Services Personnel shows an increase of 13.0% in 2010 over 2009, due to the hiring of 17 Local Professionals, a reduction of 14 General Services positions, and the increase in US$ of the local salary scales. During the period 2008-2010, local salary scales as a weighted average in relation to the cost of local staff per Member States increased by 17.81%, whereas the revaluation of the US$ was 5.77% as a weighted average in relation to the cost of local staff in the Member States. As a result the increase in local personnel costs in US$ increased by 12.04% as a weighted average.
Table 26 shows the evolution in the number of personnel financed
with resources from the Regular Fund.
With respect to operating costs, the changes in the allocation of resources for 2010, compared to 2009, are as follows:
Major Objects of Expenditure 3: Training and Technical Events increased in relation to 2009, from, 3% to 3.4% due to the increase in additional miscellaneous resources earmarked for the
hemispheric technical cooperation programs emanating from mandates of the Governing Bodies.
Major Objects of Expenditure 4 (Official Travel) and 9 (Other Costs) have the same relative importance in 2010 as in 2009. The amounts are larger as a result of the increase in miscellaneous income earmarked for the hemispheric programs
Major Object of Expenditure 5 (Documents and Supplies and Inputs) decreases from 3.9% of the Regular Fund in 2009 to 3% in 2010. The allocation was reduced to bring it into line with the current structure of expenditures, which reflects lower costs for materials and printed publications.
Major Object of Expenditure 6 (Plant, Equipment and Furniture, equivalent to Chapter IV: Renewal of Infrastructure and Equipment) decreases from 2.9% of the Regular Fund in 2009 to 2.4% in 2010, which is equivalent to a reduction of US$100,000. Given the investments made in 2006 and 2008, it is possible to lower the amount earmarked for this object of expenditure. Major Objects of Expenditure 7 (General Services –
communications, public utilities, repairs and maintenance, fuel, leases and customs costs) and 8 (Performance Contracts and Transfers) decrease slightly in terms of their percentage of the budget. The increase in US$ is justified given the increased number of technical cooperation actions at the hemispheric level and the increase in the corresponding prices in US$.
Appendix 4 shows the allocation of the Regular Fund by Major
X.
Use of Quota Contributions
The Institute’s priority activities at the national, regional and hemispheric levels are designed to produce results that benefit the Member States.
Table 27 provides a breakdown of the Institute’s quota budget at the
national level and the proportion that corresponds to each country for regional and hemispheric activities and for Management Costs, General Costs and Provisions and the Renewal of Infrastructure and Equipment in 2010. The table shows the cost of participating in the Institute for each country. In some cases, there is a positive difference between the cost of participation and the quota payable. This is because some Member States assist others by making relatively larger contributions.
XI. Projection of External Resources and INR
It is estimated that IICA will execute US$145,012,700 in external funds in 2010.
In order to cover the incremental costs incurred in the execution of these external resources, IICA expects to receive US$8,559,700 in INR resources in 2010.
Appendix 5 gives a breakdown of the projection of external
LIST OF TABLES
Table No. 1 Overall Budget, 2010 Program Budget, US$x000
Table No. 2 2010 Overall Budget by Programming Center and Source of Financing, US$x000
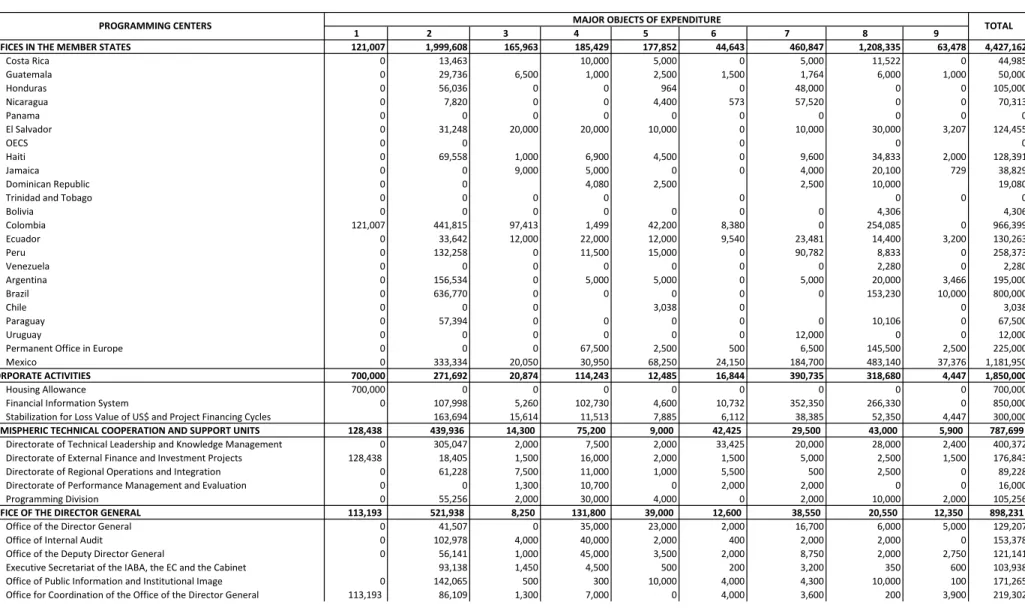
Table No. 3 2010 Preliminary Allocation of INR Resources by Programming Center and Major Object of Expenditure, US$ Table No. 4 Evolution of the Regular Fund in Nominal Values, 1994-2009 and 2010-2011, US$x000
Table No. 5 Quota Scale of the Member States and Miscellaneous Income for 2010 and 2011, US$ Table No. 6 Allocation of the Regular Fund by Chapter, 2008-2009 and 2010 Program Budgets, US$x000 Table No. 7 Chapter II: Management Costs (US$), Regular Fund: Quotas and Miscellaneous Income
Table No. 8 Chapter III: General Costs and Provisions (US$), Regular Fund: Quotas and Miscellaneous Income
Table No. 9 Chapter I: Direct Technical Cooperation Services, Regular Fund: Quotas and Miscellaneous Income, (US$ and Number of Positions) Table No. 10 Chapter II: Management Costs, Regular Fund: Quotas and Miscellaneous Income, (US$ and Number of Positions)
Table No. 11 Chapter III: General Costs and Provisions. Regular Fund: Quotas and Miscellaneous Income, (US$ and Number of Positions)
Table No. 12 Chapter IV: Renewal of Infrastructure and Equipment, Regular Fund: Quotas and Miscellaneous Income, (US$ and Number of Positions) Table No. 13 Overall Allocation, Regular Fund: Quotas and Miscellaneous Income, (US$ and Number of Positions)
Table No. 14 Technical Cooperation Units, Programs and Projects by Scope of Action, 2008-2009 and 2010 Program Budgets, Regular Fund Table No. 15 Comparison of 2008-2009 and 2010 Program Budgets, Regular Fund, US$x000
Table No. 16 Comparison of 2002-2003 to 2008-2009 and 2010 Program Budgets, Units at National Level, Quota Resources, US$x000 Table No. 17 Units of Technical Cooperation at the National Level, (US$), Regular Fund: Quotas and Miscellaneous Income
Table No. 18 Technical Cooperation Plans, Programs and Projects at the Regional Level (US$), Regular Fund: Quotas and Miscellaneous Income Table No. 19 Technical Cooperation Units and Programs at the Hemispheric Level, (US$), Regular Fund: Quotas and Miscellaneous Income Table No. 20 Allocation of the Regular Fund to Cooperative Projects and Projects in Support of Integration, US$x000
Table No. 21 Allocation of the Regular Fund to Hemispheric Technical Cooperation Programs, 2010 Program Budget, US$x000 Table No. 22 Chapter I: Direct Technical Cooperation Services, Allocation of the Regular Fund by Strategic Priority, (US$)
Table No. 23 Strategic Priorities of Direct Technical Cooperation Services, 2008-2009 and 2010 Program Budgets, Regular Fund: Quotas and Miscellaneous Income, US$x000 Table No. 24 Regular Fund Resources by Major Object of Expenditure, 2008-2009 and 2010 Program Budgets, (% and US$x000)
Table No. 25 Structure of the Major Objects of Expenditure, Regular Fund (US$x000 and %) Table No. 26 Staff Positions Financed by the Regular Fund, 1992-2010 Program Budgets
Table No. 1
2010
Program Budget
QUOTAS OF MEMBER STATES 27.298,2
MISCELLANEOUS INCOME 6.100,0
TOTAL REGULAR FUND 33.398,2
EXTERNAL RESOURCES FOR PROGRAMS AND PROJECTS 145.012,7
INSTITUTIONAL NET RATE 9.559,7
187.970,6 RESOURCES BY SOURCE TOTAL AMOUNT
Overall Budget
2010 Program Budget
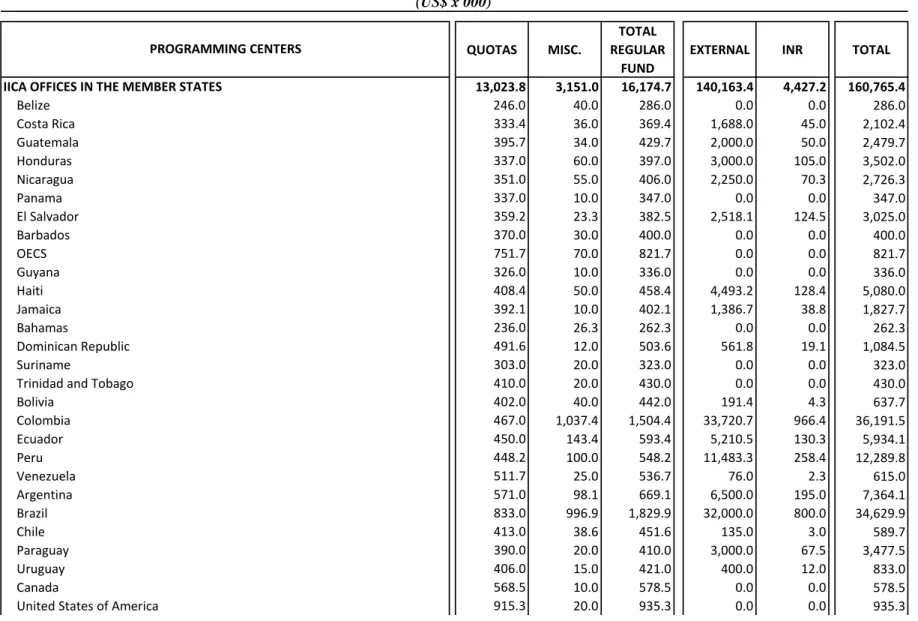
(US$ x 000)Table No. 2
QUOTAS MISC.
TOTAL REGULAR
FUND
EXTERNAL INR TOTAL
IICA OFFICES IN THE MEMBER STATES 13,023.8 3,151.0 16,174.7 140,163.4 4,427.2 160,765.4
Belize 246.0 40.0 286.0 0.0 0.0 286.0 Costa Rica 333.4 36.0 369.4 1,688.0 45.0 2,102.4 Guatemala 395.7 34.0 429.7 2,000.0 50.0 2,479.7 Honduras 337.0 60.0 397.0 3,000.0 105.0 3,502.0 Nicaragua 351.0 55.0 406.0 2,250.0 70.3 2,726.3 Panama 337.0 10.0 347.0 0.0 0.0 347.0 El Salvador 359.2 23.3 382.5 2,518.1 124.5 3,025.0 Barbados 370.0 30.0 400.0 0.0 0.0 400.0 OECS 751.7 70.0 821.7 0.0 0.0 821.7 Guyana 326.0 10.0 336.0 0.0 0.0 336.0 Haiti 408.4 50.0 458.4 4,493.2 128.4 5,080.0 Jamaica 392.1 10.0 402.1 1,386.7 38.8 1,827.7 Bahamas 236.0 26.3 262.3 0.0 0.0 262.3 Dominican Republic 491.6 12.0 503.6 561.8 19.1 1,084.5 Suriname 303.0 20.0 323.0 0.0 0.0 323.0
Trinidad and Tobago 410.0 20.0 430.0 0.0 0.0 430.0
Bolivia 402.0 40.0 442.0 191.4 4.3 637.7 Colombia 467.0 1,037.4 1,504.4 33,720.7 966.4 36,191.5 Ecuador 450.0 143.4 593.4 5,210.5 130.3 5,934.1 Peru 448.2 100.0 548.2 11,483.3 258.4 12,289.8 Venezuela 511.7 25.0 536.7 76.0 2.3 615.0 Argentina 571.0 98.1 669.1 6,500.0 195.0 7,364.1 Brazil 833.0 996.9 1,829.9 32,000.0 800.0 34,629.9 Chile 413.0 38.6 451.6 135.0 3.0 589.7 Paraguay 390.0 20.0 410.0 3,000.0 67.5 3,477.5 Uruguay 406.0 15.0 421.0 400.0 12.0 833.0 Canada 568.5 10.0 578.5 0.0 0.0 578.5
United States of America 915.3 20.0 935.3 0.0 0.0 935.3
PROGRAMMING CENTERS
2010
Overall Budget by Programming Center and Source of Financing
2010
(US$ x 000)
QUOTAS MISC.
TOTAL REGULAR
FUND
EXTERNAL INR TOTAL
PROGRAMMING CENTERS
Permanent Office in Europe 0.0 0.0 0.0 0.0 225.0 225.0
Mexico 600.0 100.0 700.0 29,548.8 1,182.0 31,430.7
REGIONAL TECHNICAL COOPERATION PLANS 2,689.9 112.5 2,802.4 150.0 0.0 2,952.4
CENTRAL REGION 762.0 37.5 799.5 0.0 0.0 799.5
Regional Technical Cooperation Plan in Policies and Trade 132.1 7.5 139.6 0.0 0.0 139.6 Regional Technical Cooperation Plan in Technology and Innovation 136.1 7.5 143.6 0.0 0.0 143.6 Regional Technical Cooperation Plan in Agricultural Health and Food Safety 131.4 7.5 138.9 0.0 0.0 138.9 Regional Technical Cooperation Plan in Rural Communities 123.7 7.5 131.2 0.0 0.0 131.2 Promotion and Formulation of Agricultural Projects 118.8 0.0 118.8 0.0 0.0 118.8 Regional Technical Cooperation Plan for Agribusiness Development 119.9 7.5 127.4 0.0 0.0 127.4
CARIBBEAN REGION 617.0 22.5 639.5 150.0 0.0 789.5
Regional Technical Cooperation Plan in Policies and Trade 128.7 7.5 136.2 150.0 0.0 286.2 Regional Technical Cooperation Plan in Agricultural Health and Food Safety 120.4 7.5 127.9 0.0 0.0 127.9 Promotion and Formulation of Agricultural Projects 111.7 0.0 111.7 0.0 0.0 111.7 Regional Technical Cooperation Plan for Agribusiness Development 122.7 7.5 130.2 0.0 0.0 130.2 Coordination of the Caribbean Regional Agenda 133.5 0.0 133.5 0.0 0.0 133.5
ANDEAN REGION 572.1 22.5 594.6 0.0 0.0 594.6
Regional Technical Cooperation Plan in Policies and Trade 131.3 7.5 138.8 0.0 0.0 138.8 Regional Technical Cooperation Plan in Technology and Innovation 20.0 0.0 20.0 0.0 0.0 20.0 Regional Technical Cooperation Plan in Agricultural Health and Food Safety 136.6 7.5 144.1 0.0 0.0 144.1 Regional Technical Cooperation Plan in Rural Communities 118.2 7.5 125.7 0.0 0.0 125.7 Promotion and Formulation of Agricultural Projects 125.9 0.0 125.9 0.0 0.0 125.9 Regional Technical Cooperation Plan in Biotechnology and Biosafety 40.1 0.0 40.1 0.0 0.0 40.1
SOUTHERN REGION 592.3 30.0 622.3 0.0 0.0 622.3
Regional Technical Cooperation Plan in Technology and Innovation 20.0 0.0 20.0 0.0 0.0 20.0 Regional Technical Cooperation Plan in Agricultural Health and Food Safety 121.5 7.5 129.0 0.0 0.0 129.0 Regional Technical Cooperation Plan in Rural Communities 126.9 7.5 134.4 0.0 0.0 134.4 Promotion and Formulation of Agricultural Projects 145.7 0.0 145.7 0.0 0.0 145.7 Regional Technical Cooperation Plan in Biosafety 160.7 7.5 168.2 0.0 0.0 168.2 Regional Technical Cooperation Plan in Trade 17.5 7.5 25.0 0.0 0.0 25.0
NORTHERN REGION 146.5 0.0 146.5 0.0 0.0 146.5
Regional Technical Cooperation Plan for the Northern Region 146.5 0.0 146.5 0.0 0.0 146.5
COOPERATIVE PROJECTS AND PROJECTS IN SUPPORT OF INTEGRATION 1,370.3 25.0 1,395.3 3,686.3 0.0 5,081.6
QUOTAS MISC.
TOTAL REGULAR
FUND
EXTERNAL INR TOTAL
PROGRAMMING CENTERS
Regional Cooperative Program for the Technological Development and Modernization of Coffee Cultivation in Central America, Panama and Dominican
Republic - PROMECAFE 109.1 0.0 109.1 1,859.2 0.0 1,968.3
Support to the System for the Central America Agricultural Technology
Integration System - SICTA 5.0 0.0 5.0 40.0 0.0 45.0
Support to the Alliance for Sustainable Development in the Caribbean 130.0 0.0 130.0 0.0 0.0 130.0 Support to the Caribbean Agricultural Research and Development Institute -
CARDI 200.0 0.0 200.0 0.0 0.0 200.0
Cooperative Agricultural Research and Technology Transfer Program for the
Andean Subregion - PROCIANDINO 110.3 0.0 110.3 129.0 0.0 239.3 Support to the Agricultural Policy Coordination Network of the South - REDPA
and Support to the Informal Group of the Agricultural Negotiators - GINA SUR 224.9 0.0 224.9 0.0 0.0 224.9 Cooperative Program for the Development of Agricultural Technology in the
Southern Cone - PROCISUR 147.9 0.0 147.9 408.1 0.0 556.0
Support to the Development and Strengthening of National Agricultural Health Systems in the Countries of the Southern Cone to Facilitate International
Agricultural Trade - COSAVE 20.0 0.0 20.0 0.0 0.0
20.0
Support to the Secretariat of the Agricultural Council of the South - CAS 71.0 0.0 71.0 0.0 0.0 71.0 Support to the Permanent Veterinary Committee of the Southern Cone - CVP 60.0 0.0 60.0 0.0 0.0 60.0 Cooperative Program in Research and Technology for the Northern Region -
PROCINORTE 126.6 0.0 126.6 0.0 0.0 126.6
Support to the Tri-National Council of the Northern Region 25.0 25.0 50.0 0.0 0.0 50.0
HEMISPHERIC TECHNICAL COOPERATION PROGRAMS 2,269.0 1,661.3 3,930.4 749.2 0.0 4,679.6
Sanitary and Phytosanitary Measures Initiative for the Americas 150.0 200.0 350.0 0.0 0.0 350.0 Support for Hemispheric Biotechnology and Biosafety Program 314.9 0.0 314.9 110.0 0.0 424.9 Hemispheric Program in Support of the Technical and Strategic Consolidation of
FONTAGRO and its Secretariat 78.9 15.0 93.9 0.0 0.0 93.9
Inter-American Program for the Promotion of Trade, Agribusiness and Food
Safety 749.4 50.0 799.4 119.6 0.0 919.0
Cooperative Program on Research and Technology Transfer for the South
American Tropics - PROCITROPICOS 151.2 0.0 151.2 319.6 0.0 470.8 Promotion of Organic Agriculture 153.3 112.5 265.8 0.0 0.0 265.8 Support to the Inter-American Association of Agricultural Librarians,
Documentalists and Information Specialists - AIBDA 4.0 0.0 4.0 0.0 0.0 4.0 Hemispheric Agro-energy and Bio-fuels Program 162.2 50.0 212.2 0.0 0.0 212.2 Hemispheric Agro-tourism Program 139.8 171.2 311.0 200.0 0.0 511.0 Program of Rural Agro-industrial Development for Latin America and the
Caribbean - PRODAR 129.4 20.0 149.4 0.0 0.0 149.4
Agriculture Leadership Center 107.4 200.0 307.4 0.0 0.0 307.4 Systematization and Dissemination of Experiences in the Field of Agricultural
QUOTAS MISC.
TOTAL REGULAR
FUND
EXTERNAL INR TOTAL
PROGRAMMING CENTERS
Support for Horizontal Cooperation among Member States 128.4 200.0 328.4 0.0 0.0 328.4 Strengthening of Technical Capabilities 0.0 200.0 200.0 0.0 0.0 200.0 Hemispheric Food-safety Program 0.0 221.3 221.3 0.0 0.0 221.3
CONTRIBUTION TO CATIE 1,000.0 0.0 1,000.0 0.0 0.0 1,000.0
Contribution to CATIE 1,000.0 0.0 1,000.0 0.0 0.0 1,000.0
INSTITUTIONAL FUNDS AND LINE ITEMS 244.1 552.6 796.7 0.0 0.0 796.7
Institutional Funds and Line Items 244.1 552.6 796.7 0.0 0.0 796.7
HEMISPHERIC TECHNICAL COOPERATION UNITS 2,561.0 332.6 2,893.6 263.7 400.4 3,557.7
Directorate of Technical Leadership and Knowledge Management 2,367.3 282.1 2,649.4 263.7 400.4 3,313.5 Office for Follow-up to the Summit of the Americas Process 193.8 50.5 244.2 0.0 0.0 244.2
HEMISPHERIC TECHNICAL SUPPORT UNITS 1,624.5 162.3 1,786.8 0.0 387.3 2,174.1
Directorate of Performance Management and Evaluation 350.9 51.5 402.4 0.0 16.0 418.4
Programming Division 335.9 0.0 335.9 0.0 105.3 441.2
Directorate of Regional Operations and Integration 796.3 95.7 892.1 0.0 89.2 981.3 Directorate of External Finance and Investment Projects 141.3 15.0 156.3 0.0 176.8 333.2
MANAGEMENT UNITS 1,327.2 82.8 1,410.0 0.0 2,494.8 3,904.9
Office of the Director General 682.0 25.0 707.0 0.0 898.2 1,605.2 Directorate of Administration and Finance 645.2 57.8 703.0 0.0 1,596.6 2,299.6
CORPORATE ACTIVITIES 1,188.2 20.0 1,208.2 0.0 1,850.0 3,058.2
Housing Allowance for International Personnel 0.0 0.0 0.0 0.0 700.0 700.0
Financial Information System 0.0 0.0 0.0 0.0 850.0 850.0
Stabilization for Loss Value of US$ and Project Financing Cycles 0.0 0.0 0.0 0.0 300.0 300.0
Governing Bodies 400.0 0.0 400.0 0.0 0.0 400.0
Insurance 380.0 0.0 380.0 0.0 0.0 380.0
Pensions 287.7 0.0 287.7 0.0 0.0 287.7
OAS Administrative Tribunal 25.0 0.0 25.0 0.0 0.0 25.0
External Audit 95.5 0.0 95.5 0.0 0.0 95.5
Emergency Assistance Program 0.0 20.0 20.0 0.0 0.0 20.0
27,298.2 6,100.0 33,398.2 145,012.7 9,559.7 187,970.6
Table No. 3 Program Budget 1 2 3 4 5 6 7 8 9 121,007 1,999,608 165,963 185,429 177,852 44,643 460,847 1,208,335 63,478 4,427,162 Costa Rica 0 13,463 10,000 5,000 0 5,000 11,522 0 44,985 Guatemala 0 29,736 6,500 1,000 2,500 1,500 1,764 6,000 1,000 50,000 Honduras 0 56,036 0 0 964 0 48,000 0 0 105,000 Nicaragua 0 7,820 0 0 4,400 573 57,520 0 0 70,313 Panama 0 0 0 0 0 0 0 0 0 0 El Salvador 0 31,248 20,000 20,000 10,000 0 10,000 30,000 3,207 124,455 OECS 0 0 0 0 0 Haiti 0 69,558 1,000 6,900 4,500 0 9,600 34,833 2,000 128,391 Jamaica 0 0 9,000 5,000 0 0 4,000 20,100 729 38,829 Dominican Republic 0 0 4,080 2,500 2,500 10,000 19,080
Trinidad and Tobago 0 0 0 0 0 0 0 0
Bolivia 0 0 0 0 0 0 0 4,306 4,306 Colombia 121,007 441,815 97,413 1,499 42,200 8,380 0 254,085 0 966,399 Ecuador 0 33,642 12,000 22,000 12,000 9,540 23,481 14,400 3,200 130,263 Peru 0 132,258 0 11,500 15,000 0 90,782 8,833 0 258,373 Venezuela 0 0 0 0 0 0 0 2,280 0 2,280 Argentina 0 156,534 0 5,000 5,000 0 5,000 20,000 3,466 195,000 Brazil 0 636,770 0 0 0 0 0 153,230 10,000 800,000 Chile 0 0 0 3,038 0 0 3,038 Paraguay 0 57,394 0 0 0 0 0 10,106 0 67,500 Uruguay 0 0 0 0 0 0 12,000 0 0 12,000
Permanent Office in Europe 0 0 0 67,500 2,500 500 6,500 145,500 2,500 225,000 Mexico 0 333,334 20,050 30,950 68,250 24,150 184,700 483,140 37,376 1,181,950
700,000 271,692 20,874 114,243 12,485 16,844 390,735 318,680 4,447 1,850,000
Housing Allowance 700,000 0 0 0 0 0 0 0 0 700,000
Financial Information System 0 107,998 5,260 102,730 4,600 10,732 352,350 266,330 0 850,000 Stabilization for Loss Value of US$ and Project Financing Cycles 163,694 15,614 11,513 7,885 6,112 38,385 52,350 4,447 300,000
128,438
439,936 14,300 75,200 9,000 42,425 29,500 43,000 5,900 787,699
Directorate of Technical Leadership and Knowledge Management 0 305,047 2,000 7,500 2,000 33,425 20,000 28,000 2,400 400,372 Directorate of External Finance and Investment Projects 128,438 18,405 1,500 16,000 2,000 1,500 5,000 2,500 1,500 176,843 Directorate of Regional Operations and Integration 0 61,228 7,500 11,000 1,000 5,500 500 2,500 0 89,228 Directorate of Performance Management and Evaluation 0 0 1,300 10,700 0 2,000 2,000 0 0 16,000 Programming Division 0 55,256 2,000 30,000 4,000 0 2,000 10,000 2,000 105,256
113,193
521,938 8,250 131,800 39,000 12,600 38,550 20,550 12,350 898,231
Office of the Director General 0 41,507 0 35,000 23,000 2,000 16,700 6,000 5,000 129,207 Office of Internal Audit 0 102,978 4,000 40,000 2,000 400 2,000 2,000 0 153,378 Office of the Deputy Director General 0 56,141 1,000 45,000 3,500 2,000 8,750 2,000 2,750 121,141 Executive Secretariat of the IABA, the EC and the Cabinet 93,138 1,450 4,500 500 200 3,200 350 600 103,938 Office of Public Information and Institutional Image 0 142,065 500 300 10,000 4,000 4,300 10,000 100 171,265 Office for Coordination of the Office of the Director General 113,193 86,109 1,300 7,000 0 4,000 3,600 200 3,900 219,302
2010 Preliminary Allocation 1 of INR Resources by Programming Center and Major Object of Expenditure
2010 US$
MAJOR OBJECTS OF EXPENDITURE
TOTAL PROGRAMMING CENTERS
CORPORATE ACTIVITIES OFFICES IN THE MEMBER STATES
HEMISPHERIC TECHNICAL COOPERATION AND SUPPORT UNITS
1 2 3 4 5 6 7 8 9 MAJOR OBJECTS OF EXPENDITURE
TOTAL PROGRAMMING CENTERS
0 1,089,179 55,000 17,000 19,806 27,474 337,572 26,328 24,250 1,596,609
Division of Human Resources Development 240,323 50,000 11,500 2,736 7,750 1,141 1,778 21,000 336,228 Division of Finance 0 456,462 0 0 6,350 8,324 28,176 0 350 499,662 Division of Services 0 268,176 2,000 0 4,720 1,000 7,150 0 200 283,246
Basic Services 0 0 0 0 0 0 293,105 20,550 0 313,655
Division of Budget and Control 0 66,690 2,500 5,000 3,000 7,000 6,000 1,000 700 91,890 Legal Advisory Services Unit 0 57,528 500 500 3,000 3,400 2,000 3,000 2,000 71,928
1,062,638
4,322,353 264,387 523,672 258,143 143,986 1,257,204 1,616,893 110,425 9,559,701
1/ The financial allocation of INR resources by Programming Center depends on the external resources to be executed in the year and the INR resources to be generated. Fifty percent is allocated to the IICA Office in the Member State in which
the INR resources are generated and fifty percent in the Programming Centers involved in the execution of the External Resources. In addition, up to US$1,000,000 are used from the INR Fund.
MAJOR OBJECTS OF EXPENDITURE: 1. International Professional Personnel; 2. Local Professional and General Services Personnel; 3. Training and Technical Events; 4. Official Travel; 5. Documents and Supplies and Inputs; 6. Plant, Equipment and
Furniture; 7. General Services; 8. Performance Contracts and Transfers; y, 9. Other Costs.
TOTAL DIRECTORATE OF ADMINISTRATION AND FINANCE
Evolution of the Regular Fund in Nominal Values
1994-2009 and 2010-2011 (US$ x 000)
PERIOD QUOTAS MISCELLANEOUS REGULAR
FUND 1994 26,707.5 267.1 26,974.6 1995 27,508.7 275.1 27,783.8 1996 27,508.7 283.4 27,792.1 1997 27,508.7 291.9 27,800.6 1998 27,508.7 2,491.3 30,000.0 1999 27,508.7 2,491.3 30,000.0 2000 27,508.7 2,491.3 30,000.0 2001 27,508.7 2,491.3 30,000.0 2002 27,508.7 2,491.3 30,000.0 2003 27,167.6 2,832.4 30,000.0 2004 27,167.6 2,832.4 30,000.0 2005 27,167.6 2,832.4 30,000.0 2006 27,167.6 2,832.4 30,000.0 2007 27,167.6 2,832.4 30,000.0 2008 27,227.8 4,100.0 31,327.8 2009 27,227.8 4,100.0 31,327.8 2010 27,298.2 6,100.0 33,398.2 2011 27,298.2 6,100.0 33,398.2
Note: The Cuban quota was excluded from the quota resources as of 2003.
Program Budget
Table No. 4
2010-2011
OAS OAS
% % AMOUNT % AMOUNT % % AMOUNT % AMOUNT AMOUNT % Antigua and Barbuda 0.024 0.024 6,602 0.024 6,602 0.022 0.022 6,052 0.022 6,052 -550 -8.33 Argentina 4.282 4.282 1,177,922 4.282 1,177,922 3.211 3.211 883,304 3.211 883,304 -294,618 -25.01 Bahamas 0.084 0.084 23,107 0.084 23,107 0.077 0.077 21,182 0.077 21,182 -1,926 -8.33 Barbados 0.080 0.080 22,007 0.080 22,007 0.060 0.060 16,505 0.060 16,505 -5,502 -25.00 Belize 0.026 0.026 7,152 0.026 7,152 0.022 0.022 6,052 0.022 6,052 -1,100 -15.38 Bolivia 0.060 0.060 16,505 0.060 16,505 0.046 0.046 12,654 0.046 12,654 -3,851 -23.33 Brazil 7.626 7.626 2,097,812 7.626 2,097,812 7.953 7.953 2,187,765 7.953 2,187,765 89,953 4.29 Canada 13.761 13.761 3,785,469 13.761 3,785,469 13.761 13.761 3,785,469 13.761 3,785,469 0 0.00 Chile 1.112 1.112 305,897 1.112 305,897 1.073 1.073 295,168 1.073 295,168 -10,728 -3.51 Colombia 0.807 0.807 221,995 0.807 221,995 0.839 0.839 230,798 0.839 230,798 8,803 3.97 Costa Rica 0.150 0.150 41,263 0.150 41,263 0.187 0.187 51,441 0.187 51,441 10,178 24.67 Dominica 0.017 0.017 4,676 0.017 4,676 0.022 0.022 6,052 0.022 6,052 1,375 29.41 Dominican Republic 0.165 0.165 45,389 0.165 45,389 0.206 0.206 56,668 0.206 56,668 11,279 24.85 Ecuador 0.165 0.165 45,389 0.165 45,389 0.207 0.207 56,943 0.207 56,943 11,554 25.45 El Salvador 0.084 0.084 23,107 0.084 23,107 0.105 0.105 28,884 0.105 28,884 5,777 25.00 Grenada 0.022 0.022 6,052 0.022 6,052 0.022 0.022 6,052 0.022 6,052 0 0.00 Guatemala 0.150 0.150 41,263 0.150 41,263 0.187 0.187 51,441 0.187 51,441 10,178 24.67 Guyana 0.022 0.022 6,052 0.022 6,052 0.022 0.022 6,052 0.022 6,052 0 0.00 Haiti 0.060 0.060 16,505 0.060 16,505 0.045 0.045 12,379 0.045 12,379 -4,126 -25.00 Honduras 0.060 0.060 16,505 0.060 16,505 0.045 0.045 12,379 0.045 12,379 -4,126 -25.00 Jamaica 0.163 0.163 44,839 0.163 44,839 0.123 0.123 33,836 0.123 33,836 -11,003 -24.54 Mexico 6.513 6.513 1,791,640 6.513 1,791,640 8.141 8.141 2,239,482 8.141 2,239,482 447,841 25.00 Nicaragua 0.060 0.060 16,505 0.060 16,505 0.045 0.045 12,379 0.045 12,379 -4,126 -25.00 Panama 0.130 0.130 35,761 0.130 35,761 0.163 0.163 44,839 0.163 44,839 9,078 25.38 Paraguay 0.165 0.165 45,389 0.165 45,389 0.124 0.124 34,111 0.124 34,111 -11,279 -24.85 Peru 0.443 0.443 121,863 0.443 121,863 0.553 0.553 152,123 0.553 152,123 30,260 24.83 Saint Kitts and Nevis 0.022 0.022 6,052 0.022 6,052 0.022 0.022 6,052 0.022 6,052 0 0.00 Saint Lucia 0.024 0.024 6,602 0.024 6,602 0.022 0.022 6,052 0.022 6,052 -550 -8.33 Saint Vincent and the Grenadines 0.022 0.022 6,052 0.022 6,052 0.022 0.022 6,052 0.022 6,052 0 0.00 Suriname 0.060 0.060 16,505 0.060 16,505 0.045 0.045 12,379 0.045 12,379 -4,126 -25.00 Trinidad and Tobago 0.180 0.180 49,516 0.180 49,516 0.152 0.152 41,813 0.152 41,813 -7,702 -15.56 United States of America 59.470 59.470 16,359,412 59.470 16,359,412 59.470 59.470 16,359,412 59.470 16,359,412 0 0.00 Uruguay 0.223 0.223 61,344 0.223 61,344 0.181 0.181 49,791 0.181 49,791 -11,554 -18.83 Venezuela 2.747 2.747 755,663 2.747 755,663 2.060 2.060 566,679 2.060 566,679 -188,985 -25.01 SUB TOTAL 98.979 98.979 27,227,816 98.979 27,227,816 99.235 99.235 27,298,239 99.235 27,298,239 70,422 0.26 Cuba 1.021 1.021 1.021 0.765 0.765 0.765 TOTAL QUOTAS 100.000 100.000 27,227,816 100.000 27,227,816 100.000 100.000 27,298,239 100.000 27,298,239 70,422 0.26 MISCELLANEOUS INCOME 2 4,100,000 4,100,000 6,100,000 6,100,000 2,000,000 48.78 TOTAL REGULAR FUND 31,327,816 31,327,816 33,398,239 33,398,239 2,070,422 6.61
2010-2009 IICA IICA
IICA IICA
Bases on the OAS Quota Scale for 2009.1 (US$)
MEMBER STATES
Program Budget
Table No. 5 2010-2011
Quota Scale of the Member States and Miscellaneous Income for 2010 and 2011