J O U R N A L O F M A T E R I A L S S C I E N C E 3 6 (2 0 0 1 ) 2213 – 2225
Biaxial fragmentation of thin silicon oxide
coatings on poly(ethylene terephthalate)
Y. LETERRIER, D. PELLATON, D. MENDELS, R. GLAUSER
Laboratoire de Technologie des Composites et Polym `eres (LTC), Ecole Polytechnique F ´ed ´erale de Lausanne (EPFL), CH-1015 Lausanne, Switzerland
E-mail: [email protected] J. ANDERSONS
Institute of Polymer Mechanics, 23 Aizkraukles iela, Riga LV-1006, Latvia
J.-A. E. M ˚A NSON∗
Laboratoire de Technologie des Composites et Polym `eres (LTC), Ecole Polytechnique F ´ed ´erale de Lausanne (EPFL), CH-1015 Lausanne, Switzerland
Crack patterns of 53 nm and 103 nm thick silicon oxide coatings on poly(ethylene
terephthalate) films are analyzed under equibiaxial stress loading, by means of a bulging cell mounted under an optical microscope with stepwise pressurization of film specimens. The biaxial stress and strain are modeled from classical elastic membrane equations, and an excellent agreement is obtained with a finite element method. In the large pressure range, the derivation of the biaxial strain from force equilibrium considerations are found to reproduce accurately the measured data up to 25% strain. The examination of the fragmentation process of the coating under increasing pressure levels reveals that the crack onset strain of the oxide coating is similar to that measured under uniaxial tension. The fragmentation of the coating under biaxial tension is also characterized by complex dynamic phenomena which image the peculiarities of the stress field, resulting in considerable broadening of the fragment size distribution. The evolution of the average fragment area as a function of biaxial stress in the early stages of the fragmentation process is analyzed using Weibull statistics to describe the coating strength.
C
° 2001 Kluwer Academic Publishers
1. Introduction
Metallization of polymers is a proven technology devel-oped over several decades for a variety of applications as diverse as packaging, optical lenses or microelec-tronics. More recently, the deposition of transparent silicon oxide thin coatings on polymer films has found considerable interest for oxygen-barrier purposes in food and pharmaceutical packaging [1–3]. The versa-tility of such deposition processes, combined with the excellent performance of the oxide coating opens large potential for new applications including coating of bot-tles. The reliability of the barrier function is controlled to a large extent by the mechanical behavior of both coating and interface with the polymer substrate. Of central importance are the cohesive strength and crack onset strain of the oxide, as well as its adhesion to the polymer.
To investigate the mechanical strength and adhesion of thin coatings, a considerable amount of techniques have been used and developed [4]. Among the most popular, the indentation and related scratch tests have proven to be powerful tools in case of hard and rigid
∗Author to whom all correspondence should be addressed.
substrates. However, the complex triaxial stress field resulting from the ploughing effort of the indenter lim-its the applicability of the scratch test when applied to soft polymer substrates [5, 6]. Alternatively, the frag-mentation test [7], in which the progressive failure of the brittle coating is analyzed in uniaxial tension as a function of substrate strain or, preferably, stress [8] has found to be appropriate in a variety of material com-binations. Besides its main advantage to avoid the in-troduction of a third body to characterize the interface, the fragmentation test permits a direct and reliable de-termination of the internal stress state in the coating and at the interface [9]. However, this test does not re-produce accurately the relevant multiaxial stress condi-tions achieved during the conversion processes present during manufacture of the package. According to Mittal [4], such a situation where the testing geometry does not reflect the actual stress state should be avoided. Indeed, in the fabrication process, the materials are subjected to several heating and cooling cycles, as for instance dur-ing lamination and welddur-ing with other polymer films. These operations introduce almost always biaxial stress
states. The corresponding stress transfer at the inter-face is likely to differ from that induced in the uniaxial fragmentation procedure, and the resulting failure pro-cesses might well also be different. As a consequence, the conclusions drawn from the analyses of conven-tional fragmentation tests may not systematically be rel-evant to the manufacture purposes. Rather, they provide a good fundamental insight into the micromechanics of adhesion, and as such provide a solid base to develop more realistic approaches to understand the behavior of the material in typical manufacturing conditions.
The literature is rich in works dealing with fragmen-tation of matter subjected to biaxial loading, spanning from theoretical analyses of scaling laws [10], to sim-ulations of fragmentation pattern formation [10], and observations of cracking phenomena [11]. As reviewed by Meakin [12], complex crack patterns are observed in all kinds of materials and at broad ranges of length scales, as a result of a variety of physical or chemi-cal phenomena. Mud-cracking and cracking of oil on canvas results from desiccation, whereas failure of thin coatings is primarily due to thermal stresses or biaxial loading. While cracking initiation strain in coatings is reliably predicted by fracture mechanics [13], further multiple cracking of a coating under tension due to its randomness warrants statistical approach. For uniaxial loading resulting in straight and parallel coating cracks, the crack spacing distribution is determined by i) the coating strength distribution, for which Weibull statis-tics was found appropriate [8], and ii) the parameters of stress transfer at the coating/substrate interface, par-ticularly the critical stress transfer length [14, 15], also related to the so-called ineffective length [7] or recov-ery length [16]. Two principal fragmentation stages can be differentiated [17]. The initial fragmentation stage is characterized by crack spacing exceeding consider-ably the stress transfer length. During this stage, crack interaction is negligible, therefore the rate of crack gen-eration is governed solely by the coating strength dis-tribution and the crack location is determined by the defect distribution in the coating. This feature has been successfully utilized to determine the Weibull strength distribution parameters of the brittle coating in a bi-axial fragmentation test [18]. The second fragmenta-tion stage corresponds to crack spacing becoming small with respect to the stress transfer length. As a result, the maximum stress in a fragment cannot reach the unper-turbed far-field level, which leads to a marked reduction of the fragmentation rate. The cracking rate and the spacing distribution in this stage depend on both the strength distribution and the stress transfer efficiency [19]. By contrast, biaxial loading leads to the forma-tion of much more complicated crack patterns [20] and accurate modeling of their evolution requires numer-ical methods [10, 21, 22]. Nevertheless, it would be of interest to describe in a simplified manner the evo-lution of a relevant feature of the crack pattern such as the average crack spacing, using for instance the Weibull parameters of the coating strength [8] deter-mined under uniaxial conditions. To this end, this work details the fragmentation process of silicon oxide coat-ings on poly(ethylene terephthalate) films under equibi-axial stress, with attention paid to the mechanical
be-havior of the polymer and to the strength distribution of the coating.
2. Experimental
2.1. Materials
The materials investigated were 12 µm thick
biaxi-ally stretched poly(ethylene terephthalate) (PET) films, coated by physical vapor deposition (PVD) with two
different SiOx layers, of thicknesses 53± 3 nm and
103± 3 nm, as measured from X-ray fluorescence. The stoichiometry ratio x of the coatings was found equal
to 1.7± 0.05 from photoelectron spectroscopy (ESCA)
measurements [23].
2.2. Equibiaxial fragmentation
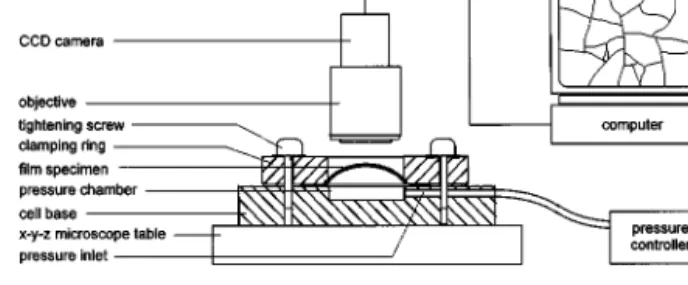
Fragmentation tests under equibiaxial plane stress con-ditions were performed at room temperature on circu-lar specimens of diameter 50 mm previously punched from the coated films with a sharp punch. This op-eration inevitably produced cracks in the coating at the periphery of the specimen. It was verified that these cracks, which extend to a distance of less than 10 µm from the edge, clearly do not influence the failure processes of the coating during the fragmen-tation test. These cracks are indeed located on the stress free boundary of the specimen, further protected by the clamping ring of the bulging cell described below. The specimens were mounted in a transpar-ent poly(methylmethacrylate) (PMMA) bulging cell as schematically depicted in Fig. 1, characterized by a di-ameter of the specimen free surface of 36 mm. The de-vice was pressurized by means of a precision pressure controller Festo, which enabled stepwise application of the pressure through 47 mbar steps. The cell was in-stalled on an Olympus SH-2 optical microscope stage to allow observations at magnifications up to 1000.
The pressure was subsequently increased stepwise with pressure intervals of the order of 150 mbar and the crack pattern was recorded at constant pressure via a charge-coupled device (CCD) camera connected to the microscope. Observations were done under reflected light for enhanced contrast, and kept under focus at increasing pressure levels by applying a vertical dis-placement of the microscope table. The biaxial strain,
ε, was measured from the evolution of the diameter of
a circular ink mark drawn in the center of the disk
spec-imen, with an accuracy of±20 µm. The initial mark
diameter was 1840µm. The following section details
alternative approaches to the derivation of the strain and stress fields in the inflated film.
The crack pattern was analyzed at each pressure step in terms of the average fragment equivalent disk di-ameters. The values were calculated from the ratio of the number of fragments to the corresponding un-strained film surface, accounting for edge effects as detailed in the following. In the case of the 103 nm thick coating, the distribution of equivalent disk di-ameters of fragments was also determined at various pressure levels. To this end, a semi-automatic image analysis procedure was developed. At each pressure step, three micrographies were taken at arbitrary loca-tions in the immediate vicinity of the calotte top. The microscope resolution together with the image con-trast between the fragments and the cracks were not high enough for reliable automated image processing and accurate detection of individual fragments. Instead, fragment contours easily identified by eye on micro-graphs printed using a high resolution laser printer were hand-traced with a black permanent pen onto
trans-parency films, within a 122.3µm × 122.3 µm square
frame, and the gap between adjacent fragments was filled in black. The traced fragmented patterns were
then scanned into a high resolution 1080× 1080 pixels
image. Subsequently, the individual fragments could be accurately identified with standard automatic detec-tion algorithms, from which the equivalent diameter of each fragment was calculated, including a contour
thickness set to a value of 0.5µm. A size filter was
operated to remove small artifact objects of size less than 20 pixels. The Ferret diameters of each fragment
along the x and y axes of the image, Fx and Fy, were
also computed, including the 0.5 µm contour
thick-ness, to correct the fragment size distribution for edge effects [24]. Indeed, the probability for a fragment to intercept the edge of the image increases with the frag-ment size, and therefore the measured distribution is biased to the small sizes. The method chosen to cor-rect the distribution adjusts the probability by the term Wx · Wy/(Wx− Fx)(Wy− Fy), where Wx and Wy are
the image widths along the x and y directions.
3. Mechanical behavior of the SiOx/PET film
under equibiaxial loading
3.1. Estimate for pressure dependence of strains and stresses
The theoretical analysis of the film deformation process is complicated by both geometrical nonlinearity due to large displacements and material nonlinearity caused by substrate plasticity and coating cracking. Further-more, crack density and coating fragment topology are expected to vary with the distance from the film cen-ter, r , due to the variation of radial and circumferential stresses. Therefore the constraint exerted on the PET substrate by the coating depends not only on the applied pressure, but also on r . These features complicate to a considerable extent the rigorous analytical derivation of stress and strain distribution in the film as a function of applied pressure. Instead, a simplified geometrical calculation is proposed in this case as a viable
approxi-mation. It assumes that for a thin circular specimen, the deformed film forms a spherical cap associated with homogeneous equibiaxial strain and stress state in the film. Such an approximation is routinely applied in the bulge test data analysis as reviewed by Small and Nix [25]. The ensuing relations reported in ref. [25] are rel-evant to the case of a small bulge, for which the calotte top displacement, d, is much less than the film radius, R0. This condition, d¿ R0, is not necessarily met in the present test case, and, therefore, the following relations were derived to account for large strain and associated film thickness reduction. The biaxial strainε is related to the ratio between initial and final film surface area, and expressed via the measured displacement d of the top of the inflated calotte as follows:
ε = 1 2Ln µ d2+ R2 0 R2 0 ¶ (1)
The biaxial stress,σ, is estimated from equilibrium con-siderations leading to:
σ = P · ¡ d2+ R2 0 ¢2 4de0R20 (2)
where R0and e0are the initial radius of the free surface of the specimen and its initial thickness, respectively,
equal to 18 mm and 12µm in the present case, and
P is the applied pressure. The thickness variation with equibiaxial strain given by Equation 1 is accounted for in Equation 2 assuming constant film volume.
The accuracy of the simple relations (1) and (2) is evaluated below by comparing their predictions with linearly elastic membrane response in the small pres-sure range and with experimental strain meapres-surements in the large pressure range.
3.2. Linear elastic model
During the initial loading stage up to the onset of mate-rial nonlinearity, only the geometrical nonlinearity has to be accounted for. A closed-form solution was de-rived by Hencky for a circular membrane loaded by an uniform pressure P [26]. Expressions for stresses and displacement of the membrane in polar coordinates with the origin at the membrane center were obtained as a power series of the normalized radial coordinate, r/R0. Truncating the series yields the displcement d and
equibiaxial stressσ in the center of the membrane as:
d= CdR03 s PR0 e0E (3) and σ = Cσ 3 s E µ PR0 e0 ¶2 (4)
where E is the Young modulus of the membrane. Using Hooke’s law for equibiaxial tension, the strain in the
center of the membrane,ε, is then given by: ε = 1− ν E σ = Cσ(1− ν) 3 sµ PR0 e0E ¶2 (5) The prefactors of the RHS in Equations 3–5 depend on
the Poisson’s ratio of the coated film, ν, taken equal
to 0.4, and on the number of terms retained in series. Keeping up to the tenth order terms in the displacement series and up to the 12-th order terms in the stress series
yields the following prefactor values: Cd= 0.626 and
Cσ= 0.444.
In order to assess the accuracy of the truncated analyt-ical solution, calculations using a finite element method (FEM NISA2 software) were performed. 3-D general shell elements accounting for membrane, bending and transverse shear stresses were applied to model one quarter of the circular membrane with clamped bound-ary and appropriate symmetry conditions. The modulus E was calculated using the rule of mixtures from the corresponding values of the polymer substrate and the coating, respectively equal to 3920 MPa and 79.5 GPa. Fig. 2 shows the comparison of analytical and FEM re-sults for the PET film with a 103 nm thick coating [27]. The displacement of the film center vs. applied pres-sure, as well as membrane stress distribution in the film, are in good agreement with the analytical model [26].
The constant equibiaxial stress given by Equation 2 is also plotted in Fig. 2b, taking displacement d in Equa-tion 2 equal to the FEM predicEqua-tion for the given pressure value. Despite the presence of pronounced variation of the membrane stresses with the radial coordinate ne-glected in deriving Equation 2, the latter provides a reasonably good estimate for stress in the equibiaxially loaded region in the film center vicinity. The application of Equation 1 for strain estimation in the linear elastic range also underestimates the strain at the film center compared to Hencky’s model, although it adequately reflects the strain-displacement dependence as shown
in Fig. 2c. Indeed, for d¿ R0Equation 1 reduces to
ε = 0.5d2/R2
0, while the combination of Equations 5
and 3 yieldsε = Cσ(1− ν)d2/C2
dR20≈ 0.68d2/R20.
3.3. Equibiaxial stress and strain of the SiOx/PET film
Fig. 3 compares the pressure dependence of the biax-ial strain for the two types of coated materbiax-ials up to burst pressures, calculated from the measured displace-ment d using Equation 1, together with the measured values for the 103 nm thick coating. It is evident that this coated film is more resistant to the applied pres-sure than the film with the 53 nm thick coating. More-over, the approximate geometrical calculation of the strain (Equation 1) reproduces the measured strain, up to approximately 25%, above which the extensive plas-tic deformation of the polymer overcomes the model prediction.
The pressure dependence of the biaxial stress calcu-lated from measured pressure and displacement using Equation 2 is shown in Fig. 4 for the two coated films. In the low pressure range, a higher stress is calculated for
(a)
(b)
(c)
Figure 2 Comparison of FEM results (dots), Hencky’s analytical model
(solid lines) and the spherical membrane model prediction (dotted lines) for the bulge test of PET film with a 103 nm thick SiOxcoating. (a)
depen-dence of calotte top displacement on applied pressure; (b) radial,σr, and circumferential,σθ, stress distributions, and constant equibiaxial stress,
σ, (Equation 2, dotted line) at a pressure equal to 0.3 bar; (c) dependence
Figure 3 Pressure dependence of biaxial strain of SiOx coated PET films. The filled symbols correspond to measured strain values for the 103 nm thick coating. The open symbols correspond to calculated strain values, from measured displacement of the top of the inflated calotte of each film at increasing pressure levels, using Equation 1. The curves are quadratic fits to the data, as a guide for the eye. (Short dashes are for the 53 nm thick coating; long dashes are for the 103 nm thick coating.)
Figure 4 Pressure dependence of biaxial stress of SiOx coated PET films. The lines are guides for the eye.
the 103 nm thick coating/PET assembly, although the values for both coated films are comparable within ex-perimental scatter, whereas the opposite is true at higher pressures. In this range, such behavior is unexpected as the thinner coating would oppose less resistance than the thicker coating. The physical mechanism for such cross-over could be related to the interplay of fragmen-tation rate, substrate deformation, and stress transfer to the coating. This subject is nonetheless beyond the scope of the present paper, and is the purpose of ongo-ing research. Interestongo-ingly though, the stress at failure is found to be slightly larger than 260 MPa, as the burst pressure was measured to be close to 2.1 bars. By
com-Figure 5 Stress-strain behavior of SiOxcoated PET films under equibi-axial loading. The continuous lines are guides for the eye, and the dashed lines represent the calculated biaxial moduli for each coated film.
parison, the failure (true) stress of the same material under uniaxial loading was found to be equal to ap-prox. 280 MPa [28].
The strain and stress data in Figs 3 and 4 are gathered in Fig. 5, which represents the mechanical behavior of the coated films under equibiaxial load. A yield stress close to 75 MPa is evident at a biaxial strain close to 2%. The difference in stresses between the two films was previously discussed. It is important to point out that the strain at rupture is close to 35%. Recalling that the effective plastic strain is twice the biaxial plastic strain (J2 flow theory, [29]), one gets an effective strain at failure close to 70%, which is almost identical to that measured under uniaxial tension [28]. Also shown in
the figure are the biaxial moduli, Y= E/(1 −ν), where
E is the Young modulus of the SiOx/PET assembly,
calculated from the rule of mixtures [30]. It is evident that a good agreement is obtained for the 103 nm thick coating, whereas the other coated film appears to be more compliant. Improvements in the pressure resolu-tion, especially in this very low pressure range, will obviously improve the measured biaxial moduli.
4. The fragmentation process of thin SiOx
coatings on PET substrates under equibiaxial stress
4.1. Fragmentation sequences
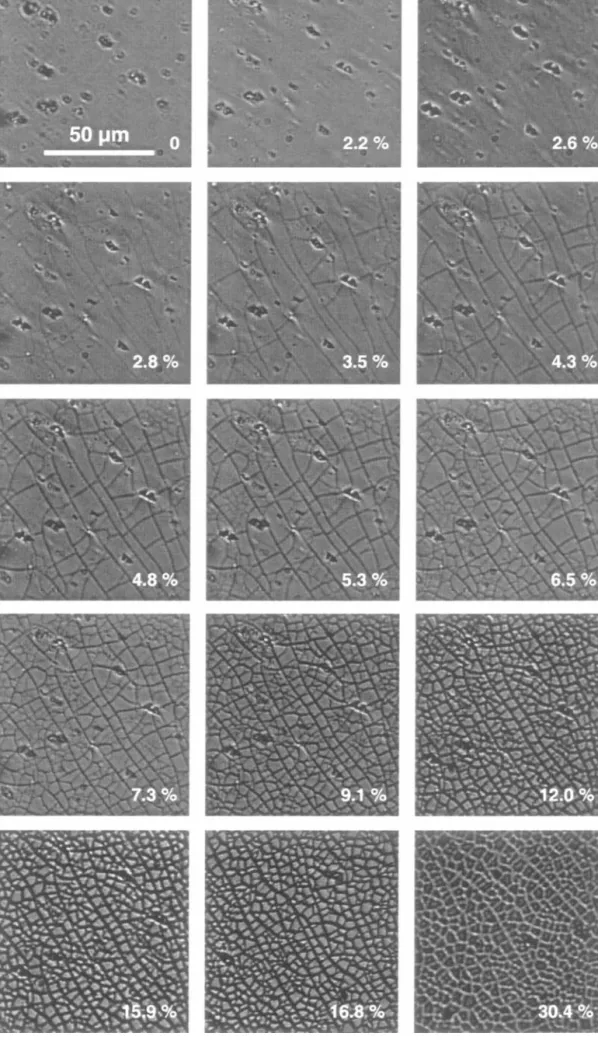
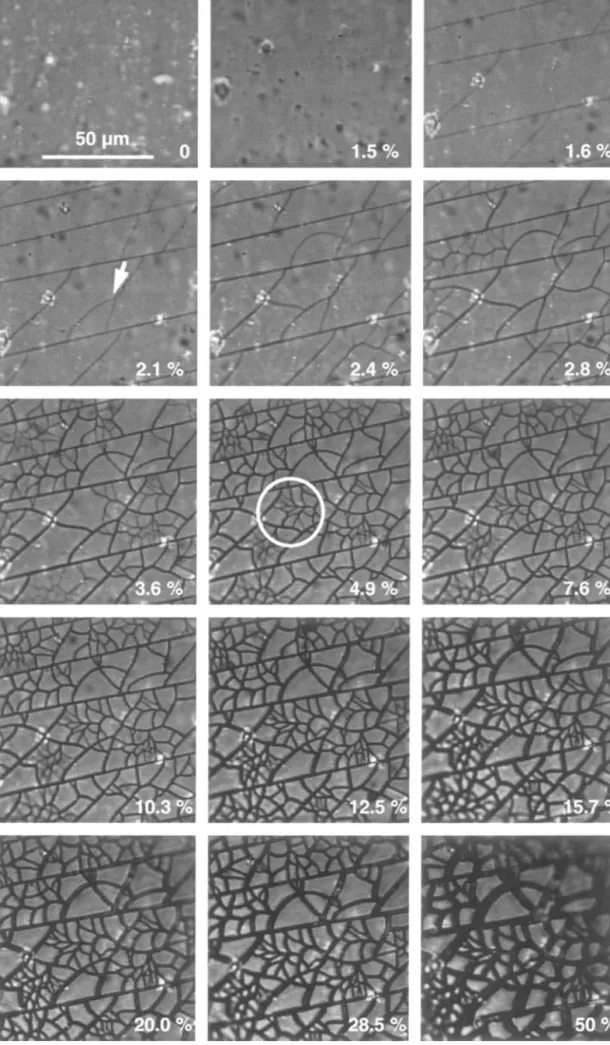
Fragmentation sequences of the 53 and 103 nm thick oxide coatings under equibiaxial load are shown in Figs 6 and 7.
In the case of the 53 nm thick coating, no cracks were detected until approx. 2% strain, at which value a net-work of cracks is initiated. The crack onset strain under biaxial loading is interestingly similar to that measured under uniaxial stress, found equal to 1.8± 0.2% for the same material [23]. It is evident that the very first cracks develop along a preferential direction. This asymmetry is the signature of small residual tensile forces, likely
Figure 7 Fragmentation sequence of the 103 nm thick SiOx coating during equibiaxial straining of the coated PET film. The arrow at 2.1% strain indicates a crack branching event; the circle at 4.9% strain shows a disintegrated fragment.
to result from the mounting of the film specimen in the bulging cell: in this operation, an exactly uniform axi-symmetric force balance on the specimen is not achiev-able. Whether the observed effect would also be related to residual stresses which could have developed along a preferential direction of the film during deposition is unlikely. Indeed, the density of cracks measured under uniaxial tension along the machine and transverse
di-rections of the same SiOx/PET film were found to be
identical within experimental error, although the exact crack onset strain had not been measured in both in-stances [28]. As the strain is increased, curved cracks develop and some amount of crack branching is evident. At approx. 5% strain, several oxide fragments suddenly disintegrate into a mosaic of tiny, sharp splinters. This remarkable shattering phenomena was never observed during uniaxial fragmentation [8]. At this stage, the distribution of fragment sizes is obviously very large,
where fragments larger than 10 µm coexist with
ap-proximately 1µm large fragments. At higher strains,
the gap between adjacent fragments widens up, show-ing plastic strain localization, and the number of dis-integrated fragments rapidly increases. Beyond 10% strain, coating failure processes slow down, whereas crack opening proceeds with applied pressure, and, ul-timately, beyond 30% strain, fragmentation stops as the stress transfer process has reached the saturation regime. At this stage, the fragment size distribution has considerably narrowed; the crack pattern reveals a char-acteristic length scale, which images the stress trans-fer phenomenon at the coating/substrate interface, and shows the existence of a critical stress transfer length.
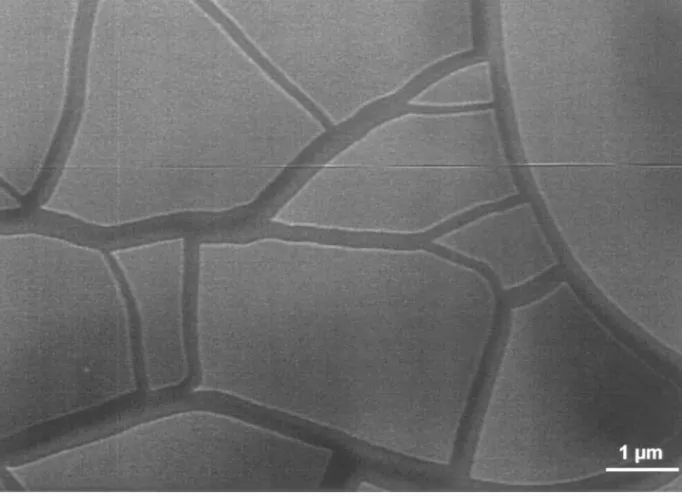
Figure 8 Scanning electron micrograph of 53 nm thick SiOxfragments at saturation.
The fragmentation sequence shown in Fig. 7 for the 103 nm thick coating exhibits strong similarities with that described above. Crack onset strain is found to be equal to 1.5%, which is also close to the value ob-tained under uniaxial load, and the same remarkable dynamic processes such as disintegration are also ob-served. However, one may notice that for this coating, the number of disintegrated fragments rapidly increases with applied strain, while some larger fragments re-main unaffected. This effect results in a considerable broadening of the fragment size distribution. The last micrography of the fragmentation sequence was taken just prior to the specimen burst, around 50% strain.
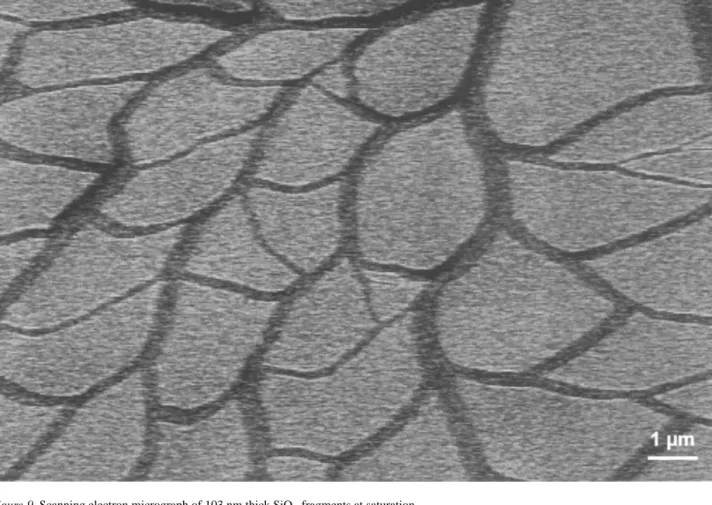
An accurate determination of the size of the small-est fragments is not possible under optical microscopy whose resolution is related to the wavelength of visible light. To overcome this limitation, samples fragmented beyond the saturation onset were observed under a scan-ning electron microscope (SEM Philips XL30-F). Prior to their observation in the SEM, non conducting sur-faces such as silicon oxide are first usually coated with a thin gold layer to dissipate electron charges. In order to prevent any artifact arising from the possible tearing of the gold layer under the electron beam, the SEM was operated at low tension (1 kV) with non gold-coated samples. The micrographs reproduced in Figs 8 and 9 for the 53 nm and 103 nm thick coatings, respectively, exemplify the very broad distribution of fragment sizes. The smallest fragments are characterized by an
equiv-alent disk diameter of the order of 1µm, whereas the
largest fragments are only observed at smaller magni-fication, particularly for the thicker coating. This issue
Figure 9 Scanning electron micrograph of 103 nm thick SiOxfragments at saturation.
Figure 10 Crack density of the SiOx coating vs. biaxial stress of the coated PET films. The dashed lines are guides for the eye.
of broad fragment size distribution will be treated in a separate work.
The fragmentation processes of the two coatings are depicted in Fig. 10 where the evolution of the crack den-sity, defined in the present case as the inverse of the aver-age equivalent disk diameter of the fragments, is plotted as a function of applied biaxial stress. This represen-tation eliminates the various dissipative mechanisms
which participate to the overall fragmentation process [8], in contrast to the more traditional approach where the crack density is analyzed vs. applied strain. The fragmentation onset stress is accurately determined,
and found to be equal to 71.0± 0.8 MPa for the 53 nm
coating, and to 63.0± 1.4 MPa for the 103 nm coating.
The initial increase is very fast, as most of the fragments are formed before 10% strain. This steep increase how-ever rapidly levels off, and beyond 20% strain, the crack density becomes constant, which corresponds to the saturation stage of the stress transfer process. In this regime, fragments have reached a critical size below which stress cannot build up from the polymer through the interface to such a level that would exceed the ox-ide strength at this size. The precise determination of the saturation onset is however not possible, due to the limited amount of experimental data.
4.2. Fragment size distributions
A refined analysis of the fragmentation phenomena of the 103 nm thick coating is given with the distributions of Fig. 11. This graph summarizes the salient features noticed previously. Whatever the strain is, the distribu-tion of fragment sizes is very much larger than what was measured in the uniaxial case [8]. The largest frag-ment is approximately 15 times larger than the smallest fragment at all strains above 2% strain under equibiax-ial conditions. This finding is in contrast to the uniax-ial loading, where the ratio of the largest fragment to the smallest decreases rapidly with applied strain from
Figure 11 Cumulative distributions of the fragment size of the 103 nm
thick SiOxcoating, expressed in terms of their equivalent disk diameter,
as a function of biaxial strain.
approximately 7 down to a value close to 3.7 in the sat-uration regime [8]. Investigations of local stresses ef-fect on such considerable differences in fragment sizes distributions between the two loading modes will be treated in a separate work.
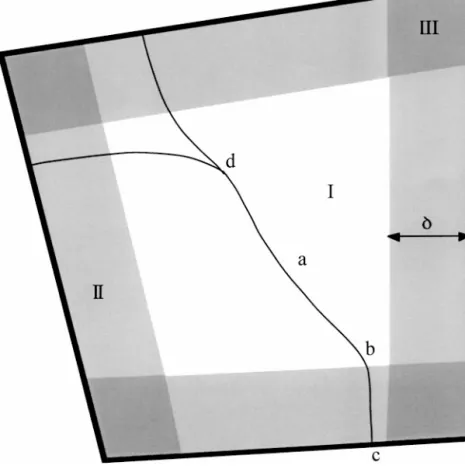
Figure 12 Schematic view of a coating fragment traversed by a branching crack. Filling indicates regions with different stress states.
5. Statistical model of cracking
5.1. Crack generation and trajectory
Cracks in the brittle coating originate from various sources, including coating defects, surface defects or kinks of the existing cracks, and crack branching dur-ing propagation. The first two mechanisms are gov-erned primarily by the interaction of the equilibrium stress distribution in a coating fragment and the rele-vant defect field, while crack branching is a dynamic phenomenon.
Consider the schematic stress distribution in a coat-ing fragment presented in Fig. 12. The stress is trans-ferred from the substrate via the interface, and reaches its far-field level,σc, at a distanceδ from the fragment edge. The central region of the fragment denoted by I is therefore subjected to the nominal equibiaxial stress. In region II the stress component acting along the edge has regained its nominal value, while the stress component normal to the edge is varying from zero at the edge to the nominal level reached in region I. Finally, in region III at the fragment “corners” both principal stresses are smaller thanσc. Therefore the probability for a coat-ing defect of given size to start propagatcoat-ing is highest in the most heavily loaded region I and comparatively negligible in the almost unloaded region III. Another possible source of crack is fragment edge, i.e., surface defects of the existing cracks. For glass and other brit-tle materials, the crack surface exhibits the well-known mirror, mist, and hackle sequence. While the mirror stage is characterized by a smooth surface, the mist and
hackle zones possess increasing surface roughness and sub-surface microcracks [31–33]. Thus crack propaga-tion can indeed generate new defects, but their effect on the subsequent coating fragmentation seems to be marginal, because the mirror – mist transition occurs only shortly before crack branching, therefore most of the rough crack surface is likely to be contained within shielded region III.
The crack patterns shown in Figs 6 to 9 also reflect both the static equilibrium stress field and the dynamic effects due to fast crack propagation. Let us consider typical crack path features and the underlying physi-cal mechanisms. The trajectory of a crack originating at point a in the equibiaxially loaded region I of the fragment is plotted schematically in Fig 12. The crack path in region I is not necessarily straight although the crack is subjected to Mode I loading like in the uniax-ial load case [8]. The important difference lies in the local non-singular stress component, T , acting at the crack tip parallel to the crack. According to ref. [34], straight crack propagation under Mode I loading is
sta-ble only for T< 0, and this condition is not met in
region I. Consequently the crack, contrary to the uni-axial case, can follow a complex trajectory, determined by the local stress perturbation at the crack tip and the defect structure of the coating. Because crack propaga-tion speed cannot exceed the Rayleigh wave velocity in the medium [35], the crack tip can also interact with the stress wave generated by crack propagation and re-flected from fragment boundary [36].
Upon entering zone II, characterized by markedly non-uniform stress distribution, point b in Fig. 12, the crack turns so that its direction is normal to the maxi-mum tensile stresses, and finally hits the fragment edge at an almost right angle, point c. It should be noted that a crack emanating from a surface defect in point c also would possess a similar path, i.e. the knowledge of crack path alone in this case is not sufficient for determi-nation of its origin. Kinks in crack trajectory, like point b, can generate new cracks due to local overload caused by static stress concentration [21]. The same effect can also be caused by dynamic stress waves reflected from fragment boundary.
An essentially dynamic fracture phenomenon is crack branching, shown schematically at point d in Fig. 12. Branching was never observed in uniaxial tests of the coated film [8], while it is quite common for fast propagation of Mode I cracks in brittle materi-als [37]. A likely reason for branching suppression of coating cracks under uniaxial loading is the pres-ence of the compressive T -stress [34] experimentally shown to delay crack branching [36]. The difference in
Poisson ratios of the PET substrate,ν, and SiOx
coat-ing,νc, causes the T stress component in the coating
Tv≈ (νc− ν)Ecε1, proportional to the applied uniaxial strainε1. This additional compressive T stress increases dynamic crack stability against bifurcation compared to uniaxially loaded glass sheet. Contrarily, under equibi-axial loading, the stress T is obviously larger than that under uniaxial loading, and a crack is more likely to branch. It is also conceivable that the shattering phe-nomenon, when a relatively large fragment suddenly disintegrates producing a number of small fragments
separated by a system of meandering cracks, is caused by sequential dynamic crack branching. Experimental studies of fast crack propagation in glass [38, 39] re-veal that the higher the stress level in the specimen, the shorter is the distance that the crack runs before bifurcation, and the higher the number of (primary and secondary) branches generated upon bifurcation. This is in qualitative agreement with coating fragmentation observations illustrated in Figs 6 and 7, showing that the relative number of shattered fragments increases with load up to saturation.
The analysis above relates primarily to the first stage of coating fragmentation characterized by fragment
size exceeding the load transfer length δ, as shown
schematically in Fig. 12. Disintegration of the larger fragments due to cracking as well as the growth of the stress transfer zone caused by substrate plasticity and by debonding of the coating leads to the onset of the second fragmentation stage when the typical fragment size is comparable or smaller than the stress transfer length. Then the stress distribution in a coating frag-ment becomes highly non-uniform and very sensitive to the fragment geometry and the stress transfer mech-anism governed by the mechanical properties of the coating-substrate interface. The maximum stress in the fragment cannot reach the far field level,σc, any more. These effects cause a reduction in fragmentation rate as seen in Fig. 10. For the limiting case of a perfectly plas-tic interface, the stress transfer length is proportional
to the coating thickness,δ ∝ hc [27]. Hence the crack
density at fragmentation slow-down should be roughly proportional to the inverse of coating thickness. This is in qualitative agreement with the experimental re-sults in Fig. 10. However, quantitative analysis of the cross-over between the fragmentation stages mentioned requires detailed knowledge of the mechanical proper-ties of the SiOx/PET interface which are not available
currently.
5.2. Weibull model for initial fragmentation stage
An adequate quantitative model of the complicated coating fragmentation phenomena observed has to in-corporate a number of interacting fracture mechanisms described above. Nevertheless, a simplified model ap-pears applicable for the initial stage of fragmentation, while crack density is small and the effect of crack branching and stress relaxation along cracks on frag-mentation is negligible. In the following, cracking is considered to result only from coating defects. Crack generation is modeled as a Poisson process with in-tensity (σc/β)αS/S0[18]. Then the average number of cracks Ncin the coating surface area S under the stress
σcis expressed as Nc= S S0 µ σc β ¶α
coating strength distribution under equibiaxial loading is consequently: F (σc)= 1 − exp · − S S0 µ σc β ¶α¸ (6)
where α is the shape parameter and β the scale pa-rameter of the Weibull distribution, and S0is a normal-ization factor. For the sake of consistency, the factor
S0 is taken equal to that used in modeling coating
strength distribution from uniaxial tension experiments [8], S0= w0l0= 104 µm2, where w0 represents the
width of the specimen, equal to 10 mm, and l0 is a
normalization factor chosen equal to 1µm.
Furthermore, cracks are assumed to propagate in-stantaneously stopping only upon encountering a pre-viously formed crack. Then appearance of a new crack increases the number of fragments by one, and average fragment area is related to the total number of cracks per coating area S as:
hSi ≈ S Nc = S0 µ σc β ¶−α (7)
Relation (7) allows evaluation of the coating’s Weibull parameters from average fragment area vs. stress data. Since Equation 7 is valid only for small stress,σcin this
range can be roughly estimated via membrane stressσ
given by Equation 2, assuming elastic film behavior, which leads to:
σc= σ
1− ν
E Ec
1− νc (8)
It follows from Figs 6 and 7 that crack branching and fragment shattering is negligible for up to about 5% strain for the 53 nm thick coating, and up to 2.8% strain for the 103 nm coating. Since fragmentation data are available only for the 53 nm coating in the strain range of interest, they were used for Weibull parameter deter-mination. Fig. 13 shows the dependence of experimen-tal average fragment area on the nominal equibiaxial stressσccomputed according to Equation 8. The initial part of the diagram appears linear in double logarithmic coordinates in agreement with the power-law relation
Figure 13 Dependence of the average fragment area on the nominal
biaxial stress in the 53 nm thick coating.
(7). The approximation of the fragmentation data in
the strain range ε ≤ 5% by Equation 7 (solid line in
Fig. 13) yields α = 14.0 and β = 900 MPa. The
cor-responding parameters of the same coated film under
uniaxial loading reported in ref. [8] areα = 13.3 and
β = 2000 MPa. While Weibull shape parameter values
for biaxial and uniaxial loading are in good agreement, the biaxial scale parameter is considerably smaller than its uniaxial counterpart. This disagreement may result in part from violating the assumption of film elastic be-havior [27] employed in deriving Equation 8, because upon the onset of plastic deformation of the PET sub-strate, a larger fraction of the in-plane stress is born by the elastic coating than predicted by relation (8).
It should however be pointed out that the present sta-tistical approach is unable to quantify the intriguing failure phenomena that were observed, such as frag-ment shattering. Work is in progress to better under-stand such dynamic events, and, in particular, to explore the emergence of auto-similar features in the later stages of pattern formation, as has been observed in a variety of material combinations [40]. These would provide unique information about the failure processes of the oxide and its concomitant mechanical reliability.
6. Conclusions
The fragmentation process of 53 and 103 nm thick silicon oxide coatings on poly(ethylene terephthalate) films were investigated under equibiaxial stress load-ing, by means of a bulging cell designed to enable step-wise pressurization of film specimens, and mounted under an optical microscope. The device allows the measurement of pressure and displacement of the in-flated calotte top. The progressive fragmentation of the oxide coating was characterized by means of image pro-cessing of optical micrographies of the crack pattern, from which were derived the distributions of fragment equivalent disk diameters of the 103 nm thick coating. The analysis of the mechanical behavior of the coated films under biaxial tension, and of the fragmentation patterns as a function of applied strain and stress leads to the following remarks.
• A theoretical derivation of the pressure dependence of biaxial strain assuming plane stress conditions reproduces the measured data up to 25% strain. Above this value, the extensive plastic deformation of the polymer overcomes the model prediction. The biaxial strength was found to be slightly larger than 260 MPa, and effective plastic strain at rupture was measured to be of the order of 70%, both being close to the uniaxial values.
• The fragmentation of the oxide coating under equibiaxial stress is characterized by complex dy-namic fragmentation phenomena including crack branching and fragment disintegration and consid-erable broadening of the fragment size distribution. • The evolution of the average fragment area as a function of biaxial stress in the early stages of the fragmentation process is approximated by a two-parameter Weibull statistics to describe the coating
strength. In this model, the shape parameter is found to be similar to that derived under uniaxial tension, whereas the scale parameter is consider-ably smaller.
Acknowledgments
The authors acknowledge the Swiss National Sci-ence Foundation for financial support, and thank Lawson Mardon Packaging for supplying film samples. The Interdepartmental Center for Electron Microscopy (CIME-EPFL) is also gratefully acknowledged for the SEM observations.
References
1. J. T. F E L T S, J. Plast. Film Sheet. 9 (1993) 201.
2. Y. L E T E R R I E R,G. R O C H A T,P. F A Y E T andJ. -A. E. MA N S O N˚ , Proc. 41st Society of Vacuum Coaters Annual Confer-ence, SVC, Boston, April 18–23 (1998) p. 429.
3. B. M. H E N R Y,A. P. R O B E R T S,C. R. M. G R O V E N O R, A. P. S U T T O N,G. A. D. B R I G G S,Y. T S U K A H A R A, T. M I Y A M O T O,M. Y A N A K AandR. J. C H A T E R, Proc. 41st Society of Vacuum Coaters Annual Conference, SVC, Boston, April 18–23 (1998) p. 434.
4. K. L. M I T T A L, J. Adhesion Sci. Technol. 1 (1987) 247. 5. B. O L L I V I E RandA. M A T T H E W S, ibid. 8 (1994) 651. 6. Y.P I T T O N,S.D.H A M M,F. -R.L A N G,H.J.M A T H I E U,
Y.L E T E R R I E RandJ. -A.E.MA N S O N˚ , ibid. 10 (1996) 1047. 7. W. A. F R A S E R, F. H. A C H K E R and A. T. D I B E N E D E T T O, in Proc. 30th Conf. SPI Reinforced Plas-tics Division, Section 22-A, 1 (1975).
8. Y.L E T E R R I E R,L.B O O G H,J.A N D E R S O N SandJ. -A.E. MA N S O N˚ , J. Polym. Sci. B: Polym. Phys. 35 (1997) 1449. 9. Y. W Y S E R, PhD thesis, EPFL #1750, 1997.
10. T. H O R N I G,I. M. S O K O L O VandA. B L U M E N, Phys. Rev.
E 54 (1996) 4293.
11. W. K O R N E T A,S. K. M E N D I R A T T AandJ. M E N T E I R O,
ibid. 57 (1998) 3142.
12. P. M E A K I N, Science 252 (1991) 226.
13. J. A N D E R S O N S,Y. L E T E R R I E RandJ. -A. E. MA N S O N˚ , in Proc. ECASIA’95, edited by H. J. Mathieu, B. Reihl and D. Briggs (Wiley and Sons, New-York, 1996) p. 15.
14. A. K E L L YandW. R. T Y S O N, J. Mech. Phys. Sol. 13 (1965) 329.
15. P. F E I L L A R D,G. DE S A R M O T´ andJ. P. F A V R E, Compos.
Sci. Technol. 50 (1994) 265.
16. W. A. C U R T I N, J. Mater. Sci. 26 (1991) 5239.
17. D. R. W H E E L E RandH. O S A K I, in “Metallization of Poly-mers,” ACS Symposium Series 440 (1990) p. 500.
18. J. A N D E R S O N S,Y. L E T E R R I E R andR. J O F F E, Mater.
Manuf. Processes 13 (1998) 597.
19. U. A. H A N D G E,I. M. S O K O L O VandA. B L U M E N, Phys.
Rev. E 61 (2000) 3216.
20. V. M. P A R F E E V,J. J.S I L I S,J. P. S K R A S T I N S H,A. K. D U K A TandS. V.P A R F E E V, Mech. Compos. Mater. 28 (1992) 560.
21. V. T A M U Z S,V. B E I L I N,R. J O F F EandV. V A L D M A N I S,
Mech. Compos. Mater. 30 (1994) 529.
22. P. M E A K I N, Thin Solid Films 151 (1987) 165.
23. Y. L E T E R R I E R, J. A N D E R S O N S, Y. P I T T O N and J. -A. E. MA N S O N˚ , J. Polym. Sci. B: Polym. Phys. 35 (1997) 1463.
24. J. C. R U S S, “Computer-Assisted Microscopy. The Measurement and Analysis of Images” (Plenum Press, New-York, 1990) p. 216. 25. M. K. S M A L LandW. D. N I X, J. Mater. Res. 7 (1992) 1553. 26. H. H E N C K Y, Z. Math. Physik 63 (1915) 311.
27. Y. L E T E R R I E R, D. P E L L A T O N, J. A N D E R S O N S and J. -A. E. MA N S O N˚ , In “Recent Developments in Durabil-ity Analysis of Composite Systems,” edited by A. H. Cardon, H. Fukuda, K. L. Reifsnider and G. Verchery, Balkema, Rotterdam (2000) p. 29.
28. L. B O O G H, Internal Report LTC-DMX-EPFL, 1993.
29. G. E. D I E T E R, “Mechanical Metallurgy,” (McGraw Hill Book Co., New-York, 1988) p. 87.
30. Y. L E T E R R I E R, Y. W Y S E R, J. -A. E. MA N S O N˚ and J. H I L B O R N, J. Adhesion 44 (1994) 213.
31. J. W. J O H N S O N andD. G. H O L L O W A Y, Phil. Mag. 17 (1968) 899.
32. J. E. F I E L D, Contemp. Phys. 12 (1971) 1.
33. K. R A V I-C H A N D A RandW. G. K N A U S S, Int. J. Fracture
26 (1984) 65.
34. B. C O T T E R E L LandJ. R. R I C E, ibid. 16 (1980) 155. 35. L. B. F R E U N D, “Dynamic Fracture Mechanics,” (Cambridge
University Press, Cambridge, 1990) p. 563.
36. K. R A V I-C H A N D A RandW. G. K N A U S S, Int. J. Fracture
26 (1984) 189.
37. M. R A M U L UandA. S. K O B A Y A S H I, ibid. 27 (1985) 187. 38. H. S C H A R D I N, in “Fracture.” edited by. B. L. Averbach, D. K.
Felbeck, G. T. Hahn and D. A. Thomas (The Technology Press of MIT, J. Wiley & Sons, New-York, 1959) p. 297.
39. F. P. B O W D E N,J. H. B R U N T O N,J. E.F I E L DandA. D. H E Y E S, Nature 216 (1967) 38.
40. J. -F.G O U Y E T, “Physique et structures fractales” (Masson, Paris, 1992) p. 62.
Received 20 April
![Fig. 2 shows the comparison of analytical and FEM re- re-sults for the PET film with a 103 nm thick coating [27].](https://thumb-eu.123doks.com/thumbv2/123doknet/14850222.629397/4.918.484.800.96.1117/fig-shows-comparison-analytical-fem-sults-thick-coating.webp)