Decoupling genetics, lineages, and microenvironment
in IDH-mutant gliomas by single-cell RNA-seq
The MIT Faculty has made this article openly available.
Please share
how this access benefits you. Your story matters.
Citation
Venteicher, Andrew S. et al. “Decoupling Genetics, Lineages, and
Microenvironment in IDH-Mutant Gliomas by Single-Cell
RNA-Seq.” Science 355, 6332 (March 2017): eaai8478 © 2017 American
Association for the Advancement of Science
As Published
http://dx.doi.org/10.1126/SCIENCE.AAI8478
Publisher
American Association for the Advancement of Science (AAAS)
Version
Author's final manuscript
Citable link
http://hdl.handle.net/1721.1/116743
Terms of Use
Creative Commons Attribution-Noncommercial-Share Alike
Decoupling genetics, lineages, and microenvironment in
IDH-mutant gliomas by single-cell RNA-seq
Andrew S. Venteicher1,2,3,*, Itay Tirosh2,*,†, Christine Hebert1,2, Keren Yizhak1,2, Cyril
Neftel1,2,4, Mariella G. Filbin1,2,5, Volker Hovestadt1,2, Leah E. Escalante1,2, McKenzie L.
Shaw1,2, Christopher Rodman2, Shawn M. Gillespie1, Danielle Dionne2, Christina C. Luo1,
Hiranmayi Ravichandran1, Ravindra Mylvaganam1, Christopher Mount6, Maristela L.
Onozato1, Brian V. Nahed3, Hiroaki Wakimoto3, William T. Curry3, A. John Iafrate1, Miguel
N. Rivera1,2, Matthew P. Frosch1, Todd R. Golub2,5,7, Priscilla K. Brastianos8, Gad Getz1,2,
Anoop P. Patel3, Michelle Monje6, Daniel P. Cahill3, Orit Rozenblatt-Rosen2, David N.
Louis1, Bradley E. Bernstein1,2, Aviv Regev2,7,9,†,‡, and Mario L. Suvà1,2,†,‡
1Department of Pathology and Center for Cancer Research, Massachusetts General Hospital and
Harvard Medical School, Boston, MA 02114, USA 2Broad Institute of Harvard and MIT,
Cambridge, MA 02142, USA 3Department of Neurosurgery, Massachusetts General Hospital and
Harvard Medical School, Boston, MA 02114, USA 4Institute of Pathology, Faculty of Biology and
Medicine, Centre Hospitalier Universitaire Vaudois, 1011 Lausanne, Switzerland 5Department of
Pediatric Oncology, Dana-Farber Cancer Institute and Children’s Hospital Cancer Center, Boston, MA 02215, USA 6Departments of Neurology, Neurosurgery, Pediatrics and Pathology, Stanford
University School of Medicine, Stanford, CA 94305, USA 7Howard Hughes Medical Institute,
Chevy Chase, MD 20815, USA 8Departments of Medicine and Neurology, Massachusetts
General Hospital and Harvard Medical School, Boston, MA 02114, USA 9Koch Institute and
Department of Biology, Massachusetts Institute of Technology, Cambridge, MA 02139, USA
Abstract
INTRODUCTION—Tumor fitness, evolution, and resistance to therapy are governed by selection of malignant cells with specific genotypes, by expression programs related to cellular phenotypes, and by influences of the tumor microenvironment (TME). Although bulk tumor analysis can interrogate the genetic state of tumor cells with high precision, bulk expression profiles average the diverse cells within each tumor, thereby masking critical differences and providing limited insight into cancer cell programs and TME influences. Single-cell RNA sequencing (scRNA-seq) can help to address those challenges but incurs financial and logistic considerations, including the time required to accrue large cohorts of fresh tumor specimen for single-cell analysis.
†Corresponding author. suva.mario@mgh.harvard.edu (M.L.S.); aregev@broadinstitute.org (A.R.); tirosh@broadinstitute.org (I.T.).
*These authors contributed equally to this work. ‡These authors contributed equally to this work.
SUPPLEMENTARY MATERIALS
HHS Public Access
Author manuscript
Science
. Author manuscript; available in PMC 2018 March 31.Published in final edited form as:
Science. 2017 March 31; 355(6332): . doi:10.1126/science.aai8478.
A
uthor Man
uscr
ipt
A
uthor Man
uscr
ipt
A
uthor Man
uscr
ipt
A
uthor Man
uscr
ipt
RATIONALE—We reasoned that scRNA-seq of a limited number of representative tumors could be combined with bulk data from large cohorts to decipher differences between tumor subclasses. In this approach, bulk samples collected for large cohorts, such as from The Cancer Genome Atlas (TCGA), are first used to define the combined effects of differences in cancer cell genotypes, phenotypes, and the composition of the TME. Single-cell analysis of a limited set of representative tumors is then used to distinguish those effects. We applied this approach to understand the differences between two types of isocitrate dehydrogenase (IDH)-mutant gliomas: astrocytoma (IDH-A) and oligodendroglioma (IDH-O). IDH-A and IDH-O are distinguished by co-occurring signature genetic events and by histopathology and are thought to recapitulate distinct glial lineages. By combining 9879 scRNA-seq profiles from 10 IDH-A tumors, 4347 scRNA-seq profiles from six IDH-O tumors, and 165 TCGA bulk RNA profiles, we could decipher differences between these two tumor types at single-cell resolution.
RESULTS—We find that differences in bulk expression profiles between IDH-A and IDH-O are primarily explained by the impact of signature genetic events and TME composition, but not by distinct expression programs of glial lineages in the malignant cells. We infer that both IDH-A and IDH-O share the same developmental hierarchy, consisting in each case of three subpopulations of malignant cells: nonproliferating cells differentiated along the astrocytic and oligodendrocytic lineages, and proliferative undifferentiated cells that resemble neural stem/progenitor cells. By analyzing tumors of different clinical grades, we observe that higher-grade tumors present enhanced proliferation, larger pools of undifferentiated glioma cells, and an increase in macrophage over microglia programs in the TME.
CONCLUSION—Our approach provides a general framework to decipher differences between classes of human tumors by decoupling cancer cell genotypes, phenotypes, and the composition of the TME. The shared glial lineages and developmental hierarchies observed in IDH-A and IDH-O suggest a common progenitor for all IDH-mutant gliomas, shedding light on a longstanding debate in gliomagenesis. In contrast to the similarity in glial lineages, IDH-A and IDH-O differ
significantly in their TME, and in particular in the abundance of microglia/macrophage cells. Microglia and macrophages also differ between IDH-A tumors of different grades. Our study redefines the cellular composition of human IDH-mutant gliomas, with important implications for disease management.
Graphical abstract
Single-cell RNA-seq of IDH-mutant gliomas reveals tumor architecture. (Top) Human samples were dissociated and analyzed by scRNA-seq. (Bottom) IDH-O and IDH-A differ in genetics and TME but are both primarily composed of three main types of malignant cells: cycling stem-like cells and noncycling astrocyte-like and oligodendrocyte-like cells. Tumor progression is associated with increased proliferation, decreased differentiation, and increase in macrophages over microglia in the TME.
A
uthor Man
uscr
ipt
A
uthor Man
uscr
ipt
A
uthor Man
uscr
ipt
A
uthor Man
uscr
ipt
Cancer cell genotypes, in combination with expression programs related to cellular phenotypes and influences of the tumor microenvironment (TME), govern tumor fitness, evolution, and resistance to therapy (1). In recent years, studies such as those of The Cancer Genome Atlas (TCGA) have charted the genetic landscape and the bulk expression states of thousands of tumors, identifying driver mutations and defining tumor subtypes on the basis of specific transcriptional profiles (2,3). Whereas the genetic state of individual tumors can be studied with high precision, bulk expression profiles provide only limited insight because they average together the phenotypic determinants of cancer programs, TME influences, and intratumoral genetic heterogeneity. Single-cell RNA-seq (scRNA-seq) can help to address those challenges (4–7) but poses financial and logistic considerations, including the time required to accrue large cohorts of fresh tumor specimens for single-cell analysis, especially in rare tumor types.
We reasoned that scRNA-seq of a limited number of representative tumors could be combined with existing bulk data from large cohorts to decipher these distinct effects, and sought to apply this approach in an effort to understand the differences between two major types of diffuse gliomas. In adults, diffuse gliomas are classified into three main categories on the basis of integrated genetic and histologic parameters: IDH-wild-type glioblastoma (GBM) is the most prevalent and aggressive form of the disease, whereas mutations in IDH1 (or less frequently IDH2) define two major classes of gliomas: astrocytoma (IDH-A) and oligodendroglioma (IDH-O) (8). IDH-A and IDH-O are two distinct tumor types that differ in their genetics, histopathology, and prognosis. Genetically, IDH-A is characterized by TP53 and ATRX mutations, whereas IDH-O is characterized by mutations in the TERT promoter and loss of chromosome arms 1p and 19q, defining a robust genetic separation into two disease entities (2).
In histopathology, IDH-A and IDH-O are distinct and are thought to predominantly recapitulate astrocytic and oligodendrocytic lineages of glial differentiation, respectively. The notion that glial lineages differ between astrocytoma and oligodendroglioma, as implied by their names, originates from distinct morphology and tissue staining. However,
expression of both oligodendroglial (e.g., OLIG2) and astrocytic [e.g., glial fibrillary acidic protein (GFAP)] markers can be readily identified in both diseases (8), mixtures of cells with histological features of neoplastic astrocytic and oligodendroglial cells are frequently
A
uthor Man
uscr
ipt
A
uthor Man
uscr
ipt
A
uthor Man
uscr
ipt
A
uthor Man
uscr
ipt
observed within individual tumors, and cellular morphologies are only partially reminiscent of distinct glial cells. Thus, the hypothesis of distinct glial lineages is questionable.
Here, we combined 9879 scRNA-seq profiles from 10 IDH-A gliomas with 4347 single-cell profiles from six IDH-O gliomas and 165 TCGA bulk RNA profiles to decipher cancer cell genotypes and phenotypes and to gain insight into TME composition across IDH-mutant gliomas. We find that differences in bulk profiles between IDH-A and IDH-O are primarily explained by signature genetic events and distinct TME composition, but not by distinct influences of glial lineages in the malignant cells of the two tumor types. Furthermore, as glioma grade increases, we observe enhanced proliferation of malignant cells, a larger pool of undifferentiated glioma cells, and an increase in macrophage over microglia programs in the TME. Our study redefines the cellular composition of human IDH-mutant gliomas and provides a general approach to deciphering differences between tumor subtypes.
Deciphering differences between bulk IDH-mutant glioma samples with
single-cell RNA-seq
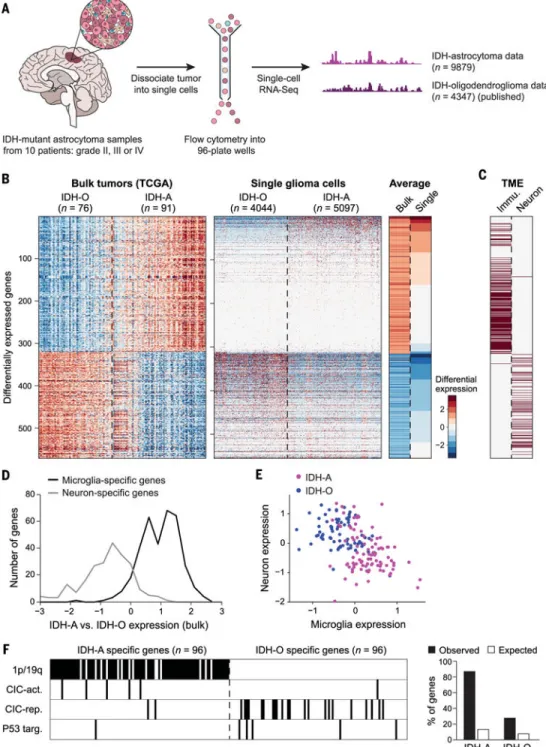
We compared the expression profiles of IDH-A and IDH-O gliomas using bulk expression profiles from the TCGA data sets (76 IDH-O and 91 IDH-A gliomas) as well as newly measured single-cell RNA-seq profiles (Fig. 1A). Comparing the TCGA bulk profiles, we found ~550 differentially expressed genes, suggesting the existence of distinct regulatory programs (2) (Fig. 1B). Because bulk profiles averaged the contributions of both genetically and phenotypically diverse malignant cells and additional diverse cells from the TME, we profiled single cells from 10 IDH-A tumors spanning clinical grades II to IV (table S1 and fig. S1), retaining 6341 single-cell profiles after filtering out low-quality cells (Fig. 1A). We first sought to classify single cells as malignant or nonmalignant. Although genetic mutations may be used for such classification, mutation calling from scRNA-seq has limited sensitivity and specificity, and combined single-cell DNA and RNA profiling is not yet scalable to thousands of cells (9,10). We thus used two complementary approaches: (i) Gene expression clustering separated cells into three groups, consistent with the programs of glioma cells, immune cells, and oligodendrocytes (fig. S2). (ii) Because glioma cells frequently harbor large-scale chromosomal aberrations (2), we estimated copy number variations (CNVs) from the average expression of genes in large chromosomal regions within each cell (4) and validated some of our predictions by whole-exome sequencing and DNA fluorescence in situ hybridization (FISH) (fig. S2 and table S2) (11).
The resulting expression-based and CNV-based classifications were highly consistent with one another, and we used both criteria to identify 5097 malignant cells (fig. S3). Our classification scheme was further validated by IDH mutations whose detection, although technically limited in scRNA-seq data, was highly specific to cells classified as malignant (fig. S3; P <10−16, hyper-geometric test).
A
uthor Man
uscr
ipt
A
uthor Man
uscr
ipt
A
uthor Man
uscr
ipt
A
uthor Man
uscr
ipt
Many differences between bulk IDH-A and IDH-O glioma samples do not
stem from malignant cells
Surprisingly, when we directly compared the IDH-A malignant cells to 4044 malignant cells profiled from six IDH-O tumors (12) (Fig. 1B), only about half of the genes that were differentially expressed according to bulk TCGA samples were also differentially expressed between the single malignant cells of the two tumor types (Fig. 1B and fig. S4). This suggests that the remaining differentially expressed genes may reflect differences in the TME rather than differences in the expression programs of malignant cells. Indeed, most of the remaining expression differences between bulk samples involved either microglia/ macrophage-specific genes or neuron-specific genes (11), which were preferentially expressed in bulk IDH-A or IDH-O samples, respectively (Fig. 1, C to E, and fig. S4), suggesting influences from nonmalignant cells in the bulk profiles. Differential expression between IDH-A and IDH-O was consistent among microglia/macrophage-specific genes and among neuron-specific genes (Fig. 1D); this allowed us to estimate the relative abundance of microglia/macrophages and of neuronal cells in each of the bulk tumors from the average expression of these two signatures (Fig. 1E). Thus, IDH-A tumors are associated with more microglia/macrophages and fewer neuronal cells than are IDH-O tumors, with few
exceptions (Fig. 1E). Note also that these differences are observed between A and IDH-O tumors of the same clinical grade or when restricting the analysis to untreated tumors (fig. S4).
Most expression differences between IDH-A and IDH-O malignant cells are
attributable to genetics
Next, we focused on the expression differences between IDH-A and IDH-O that are significant in comparisons of both bulk samples and single malignant cells of the two tumor types (11). We reasoned that specific genetic events might determine at least some of these differences. Indeed, most genes with higher expression in single malignant cells in IDH-A are located on chromosomes 1pand19q, which are co-deleted in IDH-O (Fig.1F). Loss of function of the transcriptional repressor CIC, which is specific to IDH-O, accounted for an additional ~10% of the expression differences (Fig. 1F), as inferred from a CIC expression signature (11–13). We also found a limited yet significant (P = 0.018, hypergeometric test) enrichment of p53 targets among genes more highly expressed in IDH-O tumors, consistent with a mutated TP53 in IDH-A. Overall, 57% of the expression differences were consistent with at least one of these genetic causes (Fig. 1F). Taken together, these results suggest that differences between bulk TCGA expression signatures of IDH-A and IDH-O primarily reflect TME composition and influences of genetic alterations.
scRNA-seq reveals shared glial lineages in IDH-A and IDH-O
IDH-A and IDH-O are thought to primarily recapitulate the astrocytic and oligodendrocytic glial lineages, respectively (8). However, the above results demonstrate that most differences between IDH-A and IDH-O may be accounted for by genetics and TME and do not fit the hypothesis of distinct glial lineages in these tumors. Indeed, we observed limited differences
A
uthor Man
uscr
ipt
A
uthor Man
uscr
ipt
A
uthor Man
uscr
ipt
A
uthor Man
uscr
ipt
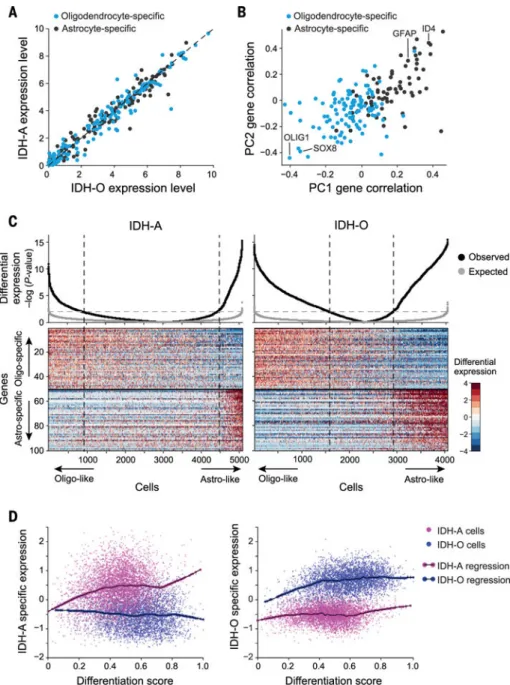
in the expression of astrocyte-specific and oligodendrocyte-specific genes between IDH-A and IDH-O, either in bulk or in single-cell profiles (Fig. 2A). Instead, the expression of these genes varied substantially across the cells within each of the IDH-A and IDH-O tumors. After subtracting intertumor differences (11), principal components analysis (PCA) across all IDH-A cells demonstrated that principal components PC1 and PC2 are associated with astrocyte-specific (PC1/2-high) and oligodendrocyte-specific (PC1/2-low) genes (Fig. 2B and table S3; P <10−9, hypergeometric test).
We refined the sets of glial lineage genes using the scRNA-seq data to define astrocyte-like and oligodendrocyte-like expression programs that covary across IDH-A cells (Fig. 2C and table S3) (11). These expression programs–which were not accounted for by intertumor differences, nor by technical and batch effects (fig. S5, A and B, and fig. S6A)–were reproduced in an analysis of 3538 additional cells from two IDH-A tumors profiled with a different single-cell RNA-seq protocol (fig. S5C) and were also coexpressed among IDH-O cells (Fig. 2C). We scored individual cells in each tumor type for expression of these programs; we then used these scores to classify cells with preferential expression of each program as well as intermediate cellular states (Fig. 2C). All tumors exhibited a wide distribution of cellular states, yet there were more IDH-A cells in intermediate states (Fig. 2C and fig. S6A). The distribution of single-cell profiles from IDH-wild-type GBMs differed, showing a bias toward the astrocytic program; this finding supports the idea that the cellular architecture of IDH-A and IDH-O is specific to IDH-mutant tumors and is not shared across all diffuse gliomas (fig. S6B). Thus, our data support a model in which malignant cells in IDH-A and IDH-O share inferred lineages of glial differentiation. We next investigated whether the 192 genes differentially expressed between the malignant cells of IDH-A and IDH-O (Fig. 1F) are shared across all malignant cells or whether they are specific to certain subpopulations. As expected, expression differences in 109 genes that can be attributed to signature genetic alterations (Fig. 1F) were shared across all malignant cells (fig. S6C). However, differences between IDH-A and IDH-O in the expression of the remaining 83 differentially expressed genes (table S3) were most pronounced in
differentiated tumor cells and were almost completely abolished among the most
undifferentiated cancer cells (Fig. 2D). Thus, undifferentiated cells from these tumor types exhibit increased similarity in gene expression programs, raising the possibility of a shared cell of origin for IDH-A and IDH-O.
To further test this hypothesis, we analyzed DNA bulk methylation patterns, as DNA methylation may preserve epigenetic signatures of the cell of origin that are not evident by gene expression analysis. We found high similarity in DNA methylation between IDH-A and IDH-O relative to both IDH-wild-type gliomas and IDH-mutant non-glioma tumors (fig. S7). Although DNA methylation is highly influenced by the IDH1 (or IDH2)mutation, this high similarity is consistent with a shared histogenesis of IDH-A and IDH-O.
A
uthor Man
uscr
ipt
A
uthor Man
uscr
ipt
A
uthor Man
uscr
ipt
A
uthor Man
uscr
ipt
Undifferentiated glioma cells are associated with proliferation and a shared
stemness program
The high degree of expression similarity between undifferentiated cells in A and IDH-O and the possibility that these might reflect a stem/progenitor cell phenotype prompted us to further investigate their developmental programs. We previously identified cancer stem-like cells in IDH-O that display neural stem/progenitor programs and are highly enriched in cell cycle programs (12). Generalizing this finding across all IDH-mutant glioma classes, we identified cycling cells on the basis of the expression of consensus cell cycle signatures (fig. S8A) (11,12,14) and found that in both IDH-A and IDH-O, only a small proportion of cells are proliferating (~4% on average in our cohort) and that there is an inverse correlation between proliferation and differentiation(Fig. 3A). Remarkably, the fraction of cycling cells for a given state of differentiation is similar between IDH-A and IDH-O (Fig. 3A). This supports a model in which proliferation and cell identity are tightly coupled in IDH-mutant tumors.
We derived a gene signature of the undifferentiated cells (excluding cycling cells) across the IDH-A and IDH-O tumors. Ninety genes were enriched within undifferentiated cells of at least three distinct tumors and were examined further for their coexpression among undifferentiated IDH-A and IDH-O cells (Fig. 3B). We defined a putative glioma stemness program as the subset of genes that are both enriched and co-expressed in undifferentiated cells of both IDH-A and IDH-O(Fig.3C). This program includes neurodevelopmental transcription factors (e.g., SOX4, SOX11, and TCF4) and is consistent with the expression program of human neural stem cells (NSCs) and neural progenitor cells (NPCs) and with a program we highlighted in IDH-O (fig. S9). We validated this tumor architecture in IDH-A tissues in 14 additional cases (table S1), showing in each tumor (i) two glial lineages of cancer cell differentiation, (ii) mutually exclusive expression of cycling (by Ki-67 staining) and differentiation (by ApoE expression) markers, and (iii) coexpression of cycling (Ki-67) and putative stem cell (SOX4) markers (Fig. 3D and table S1). This architecture has also been validated in a cohort of 16 IDH-O tumors (12).
Changes in tumor architecture associated with tumor grade and genetic
subclones
Although IDH-A and IDH-O share the same stem/progenitor programs and putative lineages of glial differentiation, regional and intertumoral variability can be observed in tissues, prompting us to investigate additional factors that might modulate tumor architecture. A comparison of IDH-A and IDH-O tumors reveals three interrelated differences: (i) The overall fraction of cycling cells (fig. S8) is higher in our IDH-A cases, (ii) the overall fraction of undifferentiated cells (Fig. 2D) is higher in our IDH-A cases, and (iii) the two lineage scores are inversely related in IDH-O, consistent with a differentiation process in which one lineage represses the other–a relationship not observed in IDH-A (fig. S6, D and E).
A
uthor Man
uscr
ipt
A
uthor Man
uscr
ipt
A
uthor Man
uscr
ipt
A
uthor Man
uscr
ipt
Notably, all three aspects vary significantly within the IDH-A tumors and correlate with tumor grade, such that higher-grade tumors tend to have more cycling cells, more undifferentiated cells, and a more limited association between lineage programs (Fig. 4A and fig. S10, A and B). This provides a molecular fingerprint for tumor progression, because IDH-A tumors are thought to begin as grade II lesions and progress to grade III and IV. We validated the correlation between the frequency of cycling malignant cells (as reflected by the cell cycle program) and tumor grade with analysis of bulk TCGA samples (fig. S10C). We hypothesized that the observed fingerprint of tumor grade-associated changes might also be reflected in clonal evolution, whereby genetically distinct subclones within the same tumor vary in their frequency of cycling and undifferentiated cells, with selection favoring the more aggressive subclones. To study genetic intratumoral heterogeneity, we inferred CNVs from single-cell expression profiles (fig. S2B) and predicted subclones in three of our tumors, MGH44, MGH57, and MGH103 (Fig. 4, B and C, and fig. S11). In each of these cases, although the overall tumor architecture was preserved across clones, we also observed variability either in the fraction of cycling cells or in differentiation patterns (Fig. 4, D and E, and fig. S11). Overall, these cases, together with two IDH-O cases (12), demonstrate that patterns of differentiation and proliferation can be partially modulated by genetics and subjected to selection. Future studies should further investigate the modulation of our inferred cellular architecture by genetic evolution.
The microglia-to-macrophage balance in the glioma TME
Finally, we used PCA to analyze the diversity of microglia/macrophage cells, the
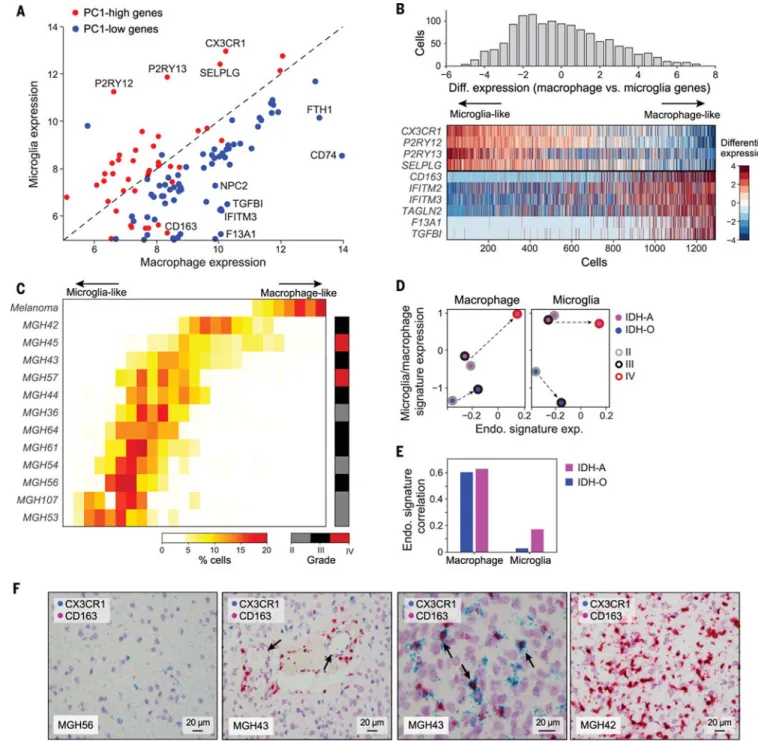
predominant subset of nonmalignant cells in the TME (n = 1043 in A and 246 in IDH-O) (fig. S12). The second principal component (PC2) reflected an inflammatory program consisting of cytokines [interleukin-1 (IL-1), IL-8, and tumor necrosis factor (TNF)], chemokines (CCL3 and CCL4), NF-кB-related genes (REL, NFKBIA and NFKBIZ), and immediate early genes (JUNB FOSB EGR3 IER3, and ATF3). The program was active in most microglia/macrophage cells across IDH-A and IDH-O tumors and is similar to a reported program in IDH-O (12) (table S3). PC1 highlighted two mutually opposing programs, which were highly consistent with microglia high) and macrophage (PC1-low) expression programs (Fig. 5A and table S3). Top PC1-high genes included microglia markers, such as CX3CR1, P2RY12, and P2RY13 (15), whereas CD163, TGFBI, and F13A1 were among the PC1-low genes and are more highly expressed in diverse
macrophage populations than in microglia (16) (Fig. 5A). Thus, the difference between PC1-high and PC1-low may correspond to how brain-resident microglia differ from infiltrating macrophages that reach the tumor through the circulation and must pass through the blood-brain barrier.
However, scoring cells by the relative expression of microglia-specific versus macrophage-specific genes revealed a continuum rather than a bimodal distribution (Fig. 5B) This is difficult to reconcile with a simple model of two populations (microglia and macrophages) and suggests additional influences on these expression programs. Furthermore, even the top macrophage-like cells in gliomas have lower macrophage scores than macrophages from melanoma tumors (Fig. 5C) (5). Thus, the glioma microenvironment might have altered the
A
uthor Man
uscr
ipt
A
uthor Man
uscr
ipt
A
uthor Man
uscr
ipt
A
uthor Man
uscr
ipt
expression profiles of macrophages, thereby decreasing their difference from microglia. Moreover, microglia/macrophages from each individual tumor had a limited range of scores, with some tumors biased toward macrophage-like cells (e.g., MGH42) and others toward microglia-like cells (e.g., MGH56) (Fig. 5C). This indicates that specific properties of the microenvironment of each tumor may be dominant over the immune cell of origin with respect to macrophage-like and microglia-like expression states, consistent with the results of recent studies (15).
This observed intertumor variability in microglia/macrophage states correlated with grade, such that cells from higher-grade tumors were preferentially associated with macrophage-like expression states. We validated this association by comparing the expression of macrophage-specific and microglia-specific genes across grades in bulk TCGAIDH-A and IDH-O tumors (Fig. 5D). These results suggest that early in their development, gliomas primarily contain brain-resident microglia-like cells, whereas macrophage-like programs are associated with higher grades and possibly coincide with other grade-associated changes, such as increased angiogenesis and alterations of the blood-brain barrier.
Accordingly, this effect may parallel changes in tumor vascularity. We derived a signature of endothelial-specific genes (11) and used their average expression to estimate the abundance of endothelial cells in each bulk tumor. This endothelial signature is correlated with the macrophage-specific, but not microglia-specific, programs across IDH-O and IDH-A tumors (Fig. 5E). Moreover, the endothelial signature increases with tumor grade, paralleling changes in the macrophage-specific, but not microglia-specific, expression programs (Fig. 5D). We validated our observations by RNA in situ hybridization for CX3CR1 (microglia) and CD163 (macrophages) in our own cohort (Fig. 5F). We also observed cells that co-express microglia and macrophage programs in tumors, supporting our hypothesis of a continuum of microglia-like to macrophage-like states (Fig. 5F).
Although the endothelial program correlates with variability in the macrophage-like expression program between cells, it does not account for the variability in the overall proportion of microglia and macrophages. IDH-A tumors have a considerably higher proportion of microglia/macrophage cells than do IDH-O tumors, as noted above (Fig. 1C), and this difference is not accounted for by endothelial cells or by grade (Fig. 5D).
To search for additional mechanisms that might regulate infiltration of microglia/ macrophage cells into the tumor, we searched for genes that are not expressed by macrophage/microglia but are correlated with the inferred abundance of microglia/ macrophage cells across bulk tumor samples. We found that 24 genes are correlated with both microglia and macrophage expression across IDH-A tumors, and separately across IDH-O tumors (fig. S13A, top). Although these analyses were performed within a tumor type and thus were not directly influenced by differences between IDH-A and IDH-O, these 24 genes were preferentially expressed in IDH-A (fig. S13A, bottom), consistent with the increased macrophage/microglia signatures in IDH-A. We cannot determine whether these associations are causal (i.e., we cannot distinguish whether these genes influence or are influenced by immune infiltration, or whether both are affected by a third hidden factor); however, the ability of this expression program to predict the extent of microglia/
A
uthor Man
uscr
ipt
A
uthor Man
uscr
ipt
A
uthor Man
uscr
ipt
A
uthor Man
uscr
ipt
macrophage infiltration across tumors and tumor types (fig. S13B) suggests interactions between immune infiltration and other cells in the tumor. Interestingly, three of those genes were components of the complement system, a specialized arm of the innate immune system, as we recently observed in a similar analysis of fibroblast-immune cell interactions in melanoma (5).
Taken together, our observations (i) define microglia and macrophage programs in gliomas at single-cell resolution; (ii) associate the macrophage program, but not the microglia program, with clinical grade and increased vascularity; (iii) highlight a continuity in transcriptional programs of microglia/macrophages in tumors (rather than a bimodal distribution), suggesting plasticity of cellular states; (iv) reveal an overall increase in microglia/macrophage infiltration in IDH-A compared to IDH-O; and (v) define a tumor expression signature associated with increased microglia/macrophage infiltration.
Discussion
By combining single-cell analysis of a limited set of representative tumors with bulk samples collected for larger cohorts, such as those from TCGA, our approach provides a general framework for decoupling cancer cell genotypes, phenotypes, and the composition of the TME in tumors. In IDH-mutant gliomas, our approach uncovers shared neural developmental programs and putative lineages of glial differentiation in IDH-A and IDH-O. Thus, IDH-mutant gliomas are primarily composed of three subpopulations of malignant cells: nonproliferating differentiated cells of two glial lineages, as well as proliferative undifferentiated cells that resemble neural stem/progenitor cells. The shared glial lineages and developmental hierarchies suggest a common progenitor for all IDH-mutant gliomas with NSC/NPC-like programs, thereby shedding light on a long-standing debate in gliomagenesis (17).
Our study thus represents a shift in our understanding of the histogenesis of glial tumors and supports a model where IDH-mutant glioma subclasses share developmental programs and putative lineages of glial differentiation, but differ primarily by genetic mutations and TME composition. All IDH-mutant gliomas we examined at single-cell resolution, including 10 IDH-A tumors and six IDH-O tumors as defined by genetics and histopathology, contained malignant cells recapitulating oligodendrocyte-like and astrocyte-like glial programs as well as a neural precursor program. Although our cohort is fairly limited, our cases have had little selection bias (consecutive cases operated at our institution), and our observations have been validated in larger cohorts by tissue staining and by analysis of the TCGA data sets.
Given the similar developmental architecture of IDH-A and IDH-O, the morphological differences between these two entities might be linked to genetic differences between IDH-A and IDH-O and to TME composition. Accordingly, at least two genes involved in
cytoskeleton and cell shape are down-regulated by IDH-O-specific mutations (table S3): (i) GFAP, a marker commonly used to assess astrocytic lineage in histopathology, is positively regulated by CIC (12)and is thus more highly expressed in IDH-A than IDH-O; and (ii) RHOC, encoding RhoC guanosine triphosphatase, a well-known regulator of cell shape and motility (18,19), is located on chromosome arm 1p and is therefore more highly expressed in
A
uthor Man
uscr
ipt
A
uthor Man
uscr
ipt
A
uthor Man
uscr
ipt
A
uthor Man
uscr
ipt
IDH-A. Thus, signature genetic events might influence the morphology of cancer cells and underlie at least some of the histopathologic differences.
We also found a considerable difference in the TME composition of IDH-mutant gliomas, whereby IDH-A is enriched with microglia/macrophage signatures. These differences in TME composition may also, at least in part, be driven by genetic influences. For example, TP53 (mutated only in IDH-A) has been shown to influence major immuneregulatory pathways such as NF-κB (20).
Although our data support a shared architecture for all IDH-mutant gliomas, the cellular composition of other diffuse gliomas might differ. Indeed, we were not able to clearly identify a similar architecture in IDH-wild-type GBM. Because much of the literature on putative glial lineages of glioma cells preceded the discovery of the IDH1/2 mutations, wild-type tumors might have confounded analyses in those studies. By analyzing IDH-mutant gliomas of different clinical grades (spanning II to IV) at single-cell resolution, we identified a potential molecular fingerprint of tumor progression, with support in TCGA data sets; our analyses suggest that high-grade lesions show increased proliferation, larger pools of undifferentiated cells, partially aberrant differentiation programs, and increased
infiltration by macrophages over resident microglia. Finally, from a therapeutic standpoint, our data raise the possibility that triggering cellular differentiation could arrest the growth of these tumors. By shedding light on the cellular composition of IDH-mutant gliomas, our data also offer opportunities for the design of immunotherapies targeting cancer cell phenotypes, a potentially novel avenue in the treatment of these currently incurable malignancies.
Materials and methods
Tumor dissociationPatients at Massachusetts General Hospital gave consent preoperatively in all cases according to Institutional Review Board Protocol 1999P008145. Fresh tumors were collected at the time of resection, and presence of malignant cells was confirmed by frozen section. Fresh tumor tissue was mechanically and enzymatically dissociated using a papain-based brain tumor dissociation kit (Miltenyi Biotec). Large pieces of debris were removed with a 100-μm strainer, and dissociated cells were layered onto a 5-ml density gradient (Lympholyte-H, Cedar Lane Labs), which was centrifuged at 2000 rpm for 10 min at room temperature to pellet dead cells and red blood cells. The interface containing live cells was saved and used for staining and flow cytometry. Viability was measured using trypan blue exclusion.
Fluorescence-activated cell sorting (FACS)
Tumor cells were blocked in 1% bovine serum albumin in Hanks’ buffered saline solution (BSA/ HBSS), and then stained first with CD45-Vioblue direct antibody conjugate (Miltenyi Biotec) for 30 min at 4°C. Cells were washed with cold phosphate-buffered saline and then resuspended in 1 ml of BSA/HBSS containing 1 μM calcein AM (Life Technologies) and 0.33 μM TO-PRO-3 iodide (Life Technologies) to costain for 30 min before sorting. FACS
A
uthor Man
uscr
ipt
A
uthor Man
uscr
ipt
A
uthor Man
uscr
ipt
A
uthor Man
uscr
ipt
was performed on FACSAria Fusion Special Order System (Becton Dickinson) using 488 nm (calcein AM, 530/30 filter), 640 nm (TO-PRO-3, 670/14 filter), and 405 nm (Vioblue, 450/50 filter) lasers. Fluorescence-minus-one controls were included with all tumors, as well as heat-killed controls in early pilot experiments, which were crucial to ensure proper identification of the TO-PRO-3-positive compartment and ensure sorting of the live cell population. Standard, strict criteria for forward scatter height versus area were used to discriminate doublets and to gate only singleton cells. Viable cells were identified by staining positive with calcein AM but negative for TO-PRO-3. Single cells were sorted into 96-well plates containing cold TCL buffer (Qiagen) containing 1% β-mercaptoethanol, snap-frozen on dry ice, and then stored at −80°C prior to whole-transcriptome amplification, librarypreparation, and sequencing.
Whole-transcriptome amplification, library construction, sequencing, and processing
Libraries from isolated single cells were generated based on the Smart-seq2 protocol (21) with the following modifications. RNA from single cells was first purified with Agencourt RNAClean XP beads (Beckman Coulter) prior to oligo-dT primed reverse transcription with Maxima reverse transcriptase and locked TSO oligonucleotide, which was followed by 20 cycles of PCR amplification using KAPA HiFi HotStart ReadyMix (KAPA Biosystems) with subsequent Agencourt AMPure XP bead purification as described. The Nextera XT Library Prep kit (Illumina) with custom barcode adapters (sequences available upon request) was used for library preparation. Libraries from 384 cells with unique barcodes were combined and sequenced using a NextSeq 500 sequencer (Illumina).
Paired-end, 38-base reads were mapped to the UCSC hg19 human transcriptome using Bowtie (22) with parameters “-q-phred33-quals -n 1 -e 99999999 -l 25 -I 1 -X 2000 -a -m 15 -S -p 6”, which allows alignment of sequences with single base changes. Expression values were calculated from SAM files using RSEM v1.2.3 (23) in paired-end mode using parameters “-estimate-rspd-paired end -sam -p 6”, from which TPM values for each gene were extracted.
Analysis of bulk DNA methylation profiles
Raw Illumina Human Methylation 450 array data from the TCGA LGG and AML projects were downloaded from the Genomic Data Commons Legacy Archive (
https://gdc-portal.nci.nih.gov/ legacy-archive). Annotation for IDH mutational status and 1p/19q co-deletion were obtained from published TCGA studies (2, 24). Methylation data and IDH mutational status (25) were downloaded from the Gene Expression Omnibus
(www.ncbi.nlm.nih.gov/geo), accession number GSE40853. TCGA data were processed from idat files in R using the minfi Bioconductor package with default parameters (26), and beta-values were used for subsequent analysis. Of the 482,421 CpG probes present on the array, the following were removed: probes targeting the X and Y chromosomes (n = 11,551), probes containing a single-nucleotide polymorphism (dbSNP132 Common) within five base pairs of and including the targeted CpG-site (n = 7998), and probes not mapping uniquely to the human reference genome (hg19) allowing for one mismatch (n = 3965). In total, 459,226 probes were kept for analysis. For heat map representation, data from the TCGA LGG
A
uthor Man
uscr
ipt
A
uthor Man
uscr
ipt
A
uthor Man
uscr
ipt
A
uthor Man
uscr
ipt
project were downsampled to 25 samples per group, and the 10,000 most variable CpGs (by standard deviation) across groups were selected.
RNA in situ hybridization
Paraffin-embedded tissue sections from human tumors from Massachusetts General Hospital were obtained according to Institutional Review Board-approved protocols (1999P008145 and 2011P002334), mounted on glass slides, and stored at −80°C. Slides were stained using the RNAscope 2.5 HD Duplex Detection Kit (Advanced Cell Technologies, cat. no.
322430). Slides were baked for 1 hour at 60°C, deparaffinized, and dehydrated with xylene and ethanol. The tissue was pretreated with RNAscope hydrogen peroxide (cat. no. 322335) for 10 min at room temperature and RNAscope Target Retrieval Reagent (cat. no. 322000) for 15 min at 98°C. RNAscope Protease Plus (cat. no. 322331) was then applied to the tissue for 30 min at 40°C. Hybridization probes were prepared by diluting the C2 probe (red) 1:50 into the C1 probe (green). Advanced Cell Technologies RNAscope Target Probes used included SOX4 (C1, cat. no. 469911), MKI67 (C2, cat. no. 591771-C2), CX3CR1 (C1, cat. no. 411251), and CD163 (C2, cat. no. 417061-C2). Probes were added to the tissue and hybridized for 2 hours at 40°C. A series of 10 amplification steps were performed using instructions and reagents provided in the RNAscope 2.5 HD Duplex Detection Kit. Tissue was counterstained with Gill’s hematoxylin for 25 s at room temperature followed by mounting with VectaMount mounting media (Vector Laboratories). For a subset of slides, we used the ViewRNA technology (Affymetrix). Briefly, slides were baked at 60°C for 1 hour, then denatured at 80°C for 3 min, deparaffinized with Histoclear, and subjected to ethanol dehydration. RNA targets in dewaxed sections were unmasked by treating with pretreatment buffer at 95°C for 10 min and digested with 1:100 dilution protease at 40°C for 10 min, followed by fixation with 10% formalin for 5 min at room temperature. Probe concentration was 1:40 for both type 1 (red) and type 6 (blue) probe sets. Probes were incubated on sections for 2 hours at 40°C and then washed serially. Affymetrix Panomics probes included ApoE (type 6, cat. no. VA6-16904 and type 1, cat. no. VA1-18265) and ApoD (type 1, VX6-99999-01). Signal was amplified using PreAmplifier mix QT for 25 min at 40°C followed by Amplifier mix QT for 15 min at 40°C, and then signal was hybridized with labeled probe at 1:1000 dilution for 15 min at 40°C. Color was developed using Fast Blue substrate for Type 6 probes and Fast Red substrate for Type 1 probes for 30 min at 40°C. Tissue was counterstained with Gill's hematoxylin for 25 s at room temperature followed by mounting with ADVANTAGE mounting media (Innovex). For quantification of compartments by ISH, at least 1000 cells were counted in representative areas of the tumors.
DNA fluorescence in situ hybridization
The probes used in this study consisted of centromeric (CEP) and locus-specific identifiers (LSI) probes. Control probes included centromere (CEP) 1 (10p11.1-q11.1, spectrum orange), CEP4 (4p11-q11, spectrum aqua), CEP7 (7p11.1-q11.1, spectrum aqua), CEP10 (10p11.1-q11.1, spectrum aqua), and chromosome 19 control enumeration probe (19p13, green 5-fluorescein), except for chr19 enumeration probe that was purchased from Empire Genomic (Buffalo, NY); all others were obtained from Abbott Molecular Inc. LSI probes were1p36/1q25 and 19q13/19p13 dual-color probe set (Abbott), bacterial artificial chromosomes RP11-626F2 (19q13.2), RP11-112J7 (4q32.1), RP11-1065D4 (7q34),
A
uthor Man
uscr
ipt
A
uthor Man
uscr
ipt
A
uthor Man
uscr
ipt
A
uthor Man
uscr
ipt
RP11-165M8 (10q23.31) labeled spectrum orange, RP11-54A4 (1q21.2-1q21.3),
RP11-1061I17 (1q44), RP11-114O6 (7q31.2), RP11-1053E10 (10q25.1) labeled spectrum green all obtained from Children’s Hospital Oakland Research Institute (Oakland, CA). FISH was performed as described (27). Briefly, 5-μm sections of formalin-fixed, paraffin-embedded tumor material were deparaffinized, hydrated, and pretreated with 0.1% pepsin for 1 hour. Slides were then washed in 2× saline-sodium citrate buffer (SSC), dehydrated, air dried, and co-denatured at 80°C for 5 min with a two- or three-color probe panel and hybridized at 40°C overnight using the Hybrite Hybridization System (Abbott). Two 3-min post-hybridization washes were performed in 2× SSC/0.3% NP40 at 72°C followed by one 1-min wash in 2× SSC at room temperature. Slides were mounted with Vectashield containing 4’,6-diamidino-2-phenylindole (Vector). Entire sections were observed with an Olympus BX61 fluorescent microscope equipped with a charge-coupled device camera and analyzed with Cytovision software (Leica Biosystems). The LSI and control (CEP) signals were quantified in 50 randomly selected, nonoverlapping nuclei, and mean numbers of LSI copies and control (CEP) per nucleus were calculated. Scores were calculated, and
amplification was considered when the LSI/ control CEP ratio was ≥2.0 and deletion was considered for ratios of ≤0.75.
Single-cell RNA-seq data processing
Expression levels were quantified as Ei,j =log2 [(TPMi,j/10) +1], where TPMi,j refers to
transcript-per-million for gene i in sample j, as calculated by RSEM (23). TPM values are divided by 10 because we estimate the complexity of single-cell libraries on the order of 100,000 transcripts and would like to avoid counting each transcript ~10 times, as would be the case with TPM, which may inflate the difference between the expression level of a gene in cells in which the gene is detected and those in which it is not detected.
For each cell, we quantified two quality measures: the number of genes for which at least one read was mapped, and the average expression level of a curated list of housekeeping genes. We then conservatively excluded all cells with either fewer than 3000 detected genes or an average housekeeping expression level (E, as defined above) below 2.5. For the remaining cells, we calculated the aggregate expression of each gene as Ea(i) =
log2[average(TPMi,1…n) + 1] and excluded genes with Ea < 4. For the remaining cells and
genes, we defined relative expression by centering the expression levels, Eri,j = Ei,j
-average[Ei,1…n].
Analysis of bulk RNA-seq profiles from glioma tumors from TCGA
TCGA data were downloaded from the Broad Firehose website (https://
gdac.broadinstitute.org/), including RNA-seq (rnaseqv2-RSEM_genes_ normalized), mutation, and copy number files from the GBMLGG data set. We used integrated molecular and histological classification to define 76 IDH-O tumors (oligodendroglioma histology plus IDH1/2 mutation and co-deletion of chromosome arms 1p and 19q) and 91 IDH-A tumors (astrocytoma histology plus IDH1/2 mutation, without co-deletion of chromosome arms 1p and 19q, and with mutations in P53 or ATRX). We log2-transformed the expression data of
all tumors, restricted our analysis to 10,375 genes with an average expression above 4 (after log transformation), and then identified differentially expressed genes between IDH-A and
A
uthor Man
uscr
ipt
A
uthor Man
uscr
ipt
A
uthor Man
uscr
ipt
A
uthor Man
uscr
ipt
IDH-O by a combination of fold-change and P value criteria (based on t test); the strict definition was based on fold-change of 2 and a P value of 10−5 (before correcting for multiple hypothesis testing), whereas the lenient definition was based on fold-change of 1.5 and a P value of 10−3. The strict definition was used to identify differentially expressed genes based on bulk analysis alone (and subsequently examine the genes in single cells, as shown in Fig. 1B); the lenient definition was used as additional support for genes first detected as differentially expressed in single-cell comparison of IDH-A and IDH-O malignant cells. To define signature scores for bulk samples, we centered the log-transformed expression values of each gene and calculated the average expression of the respective gene sets.
Classification of single cells into malignant and nonmalignant cell types
Hierarchal clustering of all IDH-A single cells revealed three main clusters (fig. S2A), including cluster 1, which preferentially expressed oligodendrocytic markers (MBP, MOBP, PLLP, and CLDN11), and cluster 2, which preferentially expressed markers of microglia or macrophages (CD14, CD163, CX3CR1, and IFNGR1) and primarily included cells from plates, which were sorted as CD45+ cells. We thus hypothesized that the first two clusters reflect nonmalignant oligodendrocytes and microglia/macrophages, whereas the third cluster corresponds to malignant cells. To further verify this, we inferred chromosomal copy numbers as described below (fig. S2B). We then defined two initial classifications based on gene expression and CNVs: (i) We scored cells by their correlation with the average expression profile of each cluster to derive expression-based scores for oligodendrocytes, microglia/macrophages, and malignant cells, and classified cells to the highest-scoring cluster if the correlation for that cluster was higher than that for the other clusters by at least 0.3; cells with a lower difference in correlation scores were defined as borderline. (ii) We classified cells as malignant, nonmalignant, and borderline according to the extent and profile of CNVs. We scored each cell for the extent of CNV signal, defined as the sum of squares of CNV values across the genome, and for the correlation between the CNV profile of each cell with the average CNV profile of all cells from the corresponding tumor that are classified by expression as malignant. We defined malignant cells as those with CNV signal above 0.05 and CNV correlation above 0.5 (fig. S3A), nonmalignant cells as those that satisfy neither of these thresholds, and borderline as those that satisfy only one threshold. Finally, we classified cells as oligodendrocytes or microglia/macrophages if they were defined as nonmalignant by CNV and as the corresponding expression cluster, and we classified cells as malignant if they were classified as such in both expression and CNV analyses, or in one of those analyses but as borderline in the other analysis.
CNV estimation
Initial CNVs (CNV0) were estimated by sorting the analyzed genes by their chromosomal
location and applying a moving average to the relative expression values, with a sliding window of 100 genes within each chromosome, as described (4,12). To avoid considerable impact of any particular gene on the moving average, we limited the relative expression values to [−3,3] by replacing all values above 3 by a ceiling of 3, and replacing values below −3 by a floor of −3. This was performed only in the context of CNV estimation. This initial analysis is based on the average expression of genes in each cell relative to the other cells
A
uthor Man
uscr
ipt
A
uthor Man
uscr
ipt
A
uthor Man
uscr
ipt
A
uthor Man
uscr
ipt
and therefore does not have a proper reference to define the baseline. We thus defined the gene expression clusters annotated as oligodendrocytes and microglia/macrophages by gene expression as the nonmalignant cells, and used the average CNV estimate at each gene across those cells as the baseline. Because the nonmalignant cells include both microglia/ macrophages and oligodendrocytes, which differ in gene expression patterns and therefore also in expression-based CNV estimates, we defined two baselines, as the average of all microglia and the average of all oligodendrocytes, and based on these the maximal
(BaseMax) and minimal (BaseMin) baseline at each window. The final CNV estimate of cell i at position j was defined as
Single-cell comparison of IDH-A and IDH-O malignant cells
We compared the average relative expression of each gene between all malignant IDH-A and IDH-O cells and defined a fold-change difference. To assign a P value, we shuffled the assignments of cells to tumor types 10,000 times and counted the fraction of times where an equal or larger difference is obtained for subsets of cells of the same size as the IDH-A and IDH-O cells. We then defined differentially expressed genes as those with fold-change of 2 and P < 0.01. The extent to which differential expression in single-cell analysis recapitulates the differences observed in bulk analysis depends on the choice of specific thresholds, and therefore we examined these fractions with a range of thresholds (s).
Principal components analysis
We performed principal components analysis (PCA) for the relative expression values of all malignant cells (as defined by integrated expression and CNV analysis). To decrease the impact of intertumoral variability on the combined analysis of malignant cells, we recentered the data within each tumor separately, such that the average of each gene was zero among cells from each tumor. The covariance matrix used for PCA was generated using an approach previously outlined (28) to decrease the weight of less reliable “missing” values in the data. Because of the limited sensitivity of single-cell RNA-seq, many genes are not detected in individual cells despite being expressed. This is particularly pronounced for genes with lower expression and for cells that have lower library complexity (i.e., for which relatively fewer genes are detected); the result is nonrandom patterns in the data, whereby cells may cluster according to their complexity and genes may cluster according to their expression levels rather than “true” covariation. To mitigate this effect, we assigned weights to missing values, such that the weight of Eij is proportional to the expectation that gene i
will be detected in cell j given the average expression of gene i and the total complexity (number of detected genes) of cell j.
Definition of cell type-specific gene sets
We defined astrocyte-specific, oligodendrocyte-specific, neuron-specific, and endothelial-specific gene sets using RNA-seq data from sorted cell types from mouse brain (29). For
A
uthor Man
uscr
ipt
A
uthor Man
uscr
ipt
A
uthor Man
uscr
ipt
A
uthor Man
uscr
ipt
each cell type, we identified genes with a higher expression in the respective cell type than in all other brain cell types (astrocytes, oligodendrocytes, neurons, endothelial cells, and microglia) by at least a factor of 4. As a more lenient definition (fig. S4), we reduced this threshold to a factor of 2. Microglia/ macrophage-specific genes were defined based on the IDH-A and IDH-O single-cell data, comparing the average expression of all microglia/ macrophage cells to that of malignant cells and to that of oligodendrocytes with a factor of 8 threshold (in both comparisons); a factor of 2 threshold was used for the lenient definition in fig. S4.
Defining cell and sample scores
Given a set of genes (Gj) reflecting a specific cell type or biological function, we define a
score, SCj (i), for each cell i, quantifying the relative expression of Gj in cell i as the average
relative expression (Er) of the genes in Gj compared to the average relative expression of a
control gene set (Gjcont): SCj(i) = average[Er(Gj,i)] -average[Er(Gjcont,i)]. The control gene
set is defined by first binning all analyzed genes into 25 bins of aggregate expression levels and then, for each gene in the considered gene set, randomly selecting 100 genes from the same expression bin. In this way, the control gene set has a distribution of expression levels comparable to that of the considered gene set, and the control gene set is larger by a factor of 100 such that its average expression is analogous to averaging over 100 randomly selected gene sets of the same size as the considered gene set. A similar approach was used to define bulk sample scores.
Genetic causes of expression differences between IDH-A and IDH-O malignant cells
To test the degree to which expression differences between IDH-A and IDH-O could be explained by known genetic differences, we focused on genetic events specific to IDH-O (co-deletion of chromosome arms 1p and 19q, decreased or loss of function of the
transcriptional repressor CIC) and those specific to IDH-A (mutations in TP53 and ATRX). The immediate impact of the co-deletion is reduction in the expression of all genes on the corresponding chromosome arms. Additional effects could reflect trans-effects (e.g., due to reduced expression of regulators on these chromosomes); although these effects are generally difficult to infer, one of the regulators on these chromosomes is CIC, which is further mutated (i.e., causing loss of function of the second allele) in most IDH-O tumors, and thus reduced CIC activity is a universal feature of IDH-O that is driven by both co-deletionand additional loss-of-function mutations. To infer the effects of reduced CIC activity, we combined the results of two analyses: (i) We recently identified a subclonal CIC mutation in the oligodendroglioma MGH53 (12) and defined subsets of mutant cells and wild-type cells by single-cell analysis, thus enabling a direct comparison and identification of differentially expressed genes within the same tumor. (ii) We compared the expression of all IDH-O TCGA tumors with a CIC mutation to those without CIC mutations and identified differentially expressed genes that are either activated or repressed by CIC, using a fold-change threshold of 2 and a t-test P value of 0.01. We combined the results of these two analyses to define putative sets of CIC repressed and activated genes. P53 targets were defined according to chromatin immunoprecipitation and presence of a binding motif (30).
A
uthor Man
uscr
ipt
A
uthor Man
uscr
ipt
A
uthor Man
uscr
ipt
A
uthor Man
uscr
ipt
Lineage and differentiation scores
Variability among malignant IDH-A cells, as reflected by the first principal component (PC1), is consistent with astrocyte-specific (PC1-low genes) and oligodendrocyte-specific (PC1-high) genes (Fig. 2B and table S3). However, this consistency is partial, reflecting the differences between differentiation programs as measured in mice (29) and as we observe in IDH-A and IDH-O tumors. To refine the definition of these expression programs in the context of IDH-A, we used an approach similar to the signature algorithm (31). First, we scored each cell based on the expression of the above gene sets to define initial astrocytic and oligodendrocytic scores (SCastro and SColigo). We then calculated the correlation of each
gene with SCastro − SColigo across all malignant IDH-A cells. The 50 genes with highest and
50 genes with lowest correlations were then used to define the refined astrocytic and oligodendrocytic scores (SCrefastro and SCrefoligo), which were used in all subsequent
analyses. Thus, genes associated with glial differentiation that do not correlate with the program in the tumor cells were removed, whereas other genes that are not known to be involved in glial differentiation but are coexpressed with the glial programs are added, resulting in gene sets that are coherently expressed across tumor cells but maintain high similarity to developmental glial expression programs (table S3). We then scaled these scores to the range [0 1] by subtracting the minimal score and dividing by the range of scores. Finally, we defined a differentiation score for each cell (regardless of lineage) as max(SCrefastro, SCrefoligo).
Cell cycle analysis
Gene sets reflecting the expression program of the G1/S and G2/M phases of the cell cycle
were defined as the overlap between gene sets identified in several previous studies, as described (12). We used the average relative expression of these gene sets to derive G1/S and
G2/M scores. Cycling cells were defined as those in which one of the scores was above 1.5
and where the P value from one sample t test over the corresponding gene set was below 10−4.
Identification of a putative stemness program
We searched for genes that are preferentially expressed in undifferentiated cells, after excluding cycling cells, in order to avoid cell cycle-related effects. In each tumor, we compared the average relative expression of each gene between undifferentiated cells (differentiation score below 0.25) and differentiated cells(differentiation score above 0.4), separated into those with a higher astrocytic or a higher oligodendrocytic score. This resulted in two values of fold-change (undifferentiated versus astro-like and versus oligo-like) and two corresponding P values, which were calculated by shuffling cell identities 10,000 times. Significant genes were defined in each tumor as those with a fold-change above 1.5 and a P value below 0.05; we used these lenient criteria within each tumor because of the limited number of un-differentiated cells, but then focused on genes that were
significant across multiple tumors. A control analysis after shuffling cell identities within each tumor led to genes that were significant in one or at most two tumors, and thus we used a threshold of significance in three tumors. Ninety genes satisfied this criterion. To restrict those genes to a subset of coherently regulated genes that may reflect a stemness program,
A
uthor Man
uscr
ipt
A
uthor Man
uscr
ipt
A
uthor Man
uscr
ipt
A
uthor Man
uscr
ipt
we hierarchically clustered the genes in IDH-A and in IDH-O using 1 - R, where R is a Pearson correlation coefficient across all undifferentiated cells in the corresponding tumor type. In both IDH-A and IDH-O we observed one dominant cluster; we defined that cluster as the largest cluster when cutting the hierarchical clustering tree at a correlation of R = 0.4. We then ranked the genes by their association with that cluster, defined as the average correlation with the genes in that cluster.
Analysis of microglia/macrophages
PCA was performed over the relative expression of all microglia/macrophages from IDH-A and IDH-O, including all genes with Ea > 4 (defined only on the basis of microglia/
macrophage cells). PC1 genes were defined as those with a Pearson correlation above 0.3 (PC1-high genes) or below −0.3 (PC1-low genes). We then examined the expression of the mouse orthologs of those genes in mouse microglia and macrophages (16); because multiple types of macrophages were previously profiled, we considered the maximal expression and the average expression of each gene across those macrophage subtypes. We then defined microglia-specific genes as those with higher expression in microglia than the maximal macrophage expression by at least a factor of 5, and macrophage-specific genes as those with higher maximal macrophage expression than microglia expression by at least a factor of 5, as well as higher average macrophage expression than microglia expression by at least a factor of 2. We focused on the genes that were defined as both microglia-specific and PC1-high (CX3CR1, P2RY12, P2RY13, and SELPLG), and on genes defined as both
macrophage-specific and PC1-low (e.g., CD163, CD74, TGFBI, IFITM2, IFITM3, F13A1, NPC2, TAGLN2, and FTH1); the average relative expression of those genes defined the microglia-specific and macrophage-specific scores, and their difference defined the macrophage versus microglia score, which is shown in Fig. 5B.
Supplementary Material
Refer to Web version on PubMed Central for supplementary material.
Acknowledgments
We thank L. Gaffney, L. Friedman, and A. Hupalowska for assistance with design of figures. Supported by the Smith Family Foundation, the V Foundation for Cancer Research, the Merkin Institute Fellows at the Broad Institute, the American Cancer Society, and NIH-NCI brain cancer SPORE P50CA165962 (Developmental Research Project) (M.L.S.); the Broad Institute Broadnext10 program (M.L.S. and O.R.-R.); the National Brain Tumor Society (M.L.S. and D.N.L.); the Rachel Molly Markoff Foundation (M.L.S. and B.E.B.); NIH R25 fellowship NS065743 and research grants from the American Brain Tumor Association and Neurosurgery Research and Education Foundation (A.S.V.); a Human Frontier Science Program fellowship and a Rothschild fellowship (I.T.); the Placide Nicod Foundation (C.N.); an EMBO long-term fellowship (V.H.); the Burroughs-Wellcome Fund CAMS and K12 Paul Calabresi Career Award for Clinical Oncology-Training Program in Nervous System Tumors grant K12CA090354 (M.G.F.);the Howard Hughes Medical Institute, the Klarman Family Foundation, STARR cancer consortium, NCI grants 1U24CA180922 and R33CA202820, and Koch Institute Support (core) grant P30-CA14051 from NCI, the Ludwig Center, and the Broad Institute (A.R.); Burroughs-Wellcome Fund CAMS grant BWF 1007616.02 (D.P.C.); California Institute of Regenerative Medicine grants RB4-06093 and RN3-06510 and the Virginia and D. K. Ludwig Fund for Cancer Research (M.M.); and start-up funds from the MGH Department of Pathology. Flow cytometry and sorting services were supported by shared instrumentation grant
1S10RR023440-01A1. A.R. is a scientific advisory board member for ThermoFisher Scientific and Syros Pharmaceuticals and a consultant for Driver Group. A.S.V., A.R., B.E.B., I.T., M.L.S., and O.R.-R. are inventors on patent application PCT/US17/14995 submitted by the Broad Institute, MIT, and MGH that covers certain subject matter of this manuscript, including gene signatures and application to development of therapeutics. A.J.I. holds
A
uthor Man
uscr
ipt
A
uthor Man
uscr
ipt
A
uthor Man
uscr
ipt
A
uthor Man
uscr
ipt
equity in ArcherDx. Data generated for this study are available through the Gene Expression Omnibus (GEO) under accession number GSE89567.
REFERENCES AND NOTES
1. Kreso A, Dick JE. Evolution of the cancer stem cell model. Cell Stem Cell. 2014; 14:275–291. DOI: 10.1016/j.stem.2014.02.006 [PubMed: 24607403]
2. Brat DJ, et al. Comprehensive, integrative genomic analysis of diffuse lower-grade gliomas. N Engl J Med. 2015; 372:2481–2498. DOI: 10.1056/NEJMoa1402121 [PubMed: 26061751]
3. Lawrence MS, et al. Discovery and saturation analysis of cancer genes across 21 tumour types. Nature. 2014; 505:495–501. DOI: 10.1038/nature12912 [PubMed: 24390350]
4. Patel AP, et al. Single-cell RNA-seq highlights intratumoral heterogeneity in primary glioblastoma. Science. 2014; 344:1396–1401. DOI: 10.1126/science.1254257 [PubMed: 24925914]
5. Tirosh I, et al. Dissecting the multicellular ecosystem of metastatic melanoma by single-cell RNA-seq. Science. 2016; 352:189–196. DOI: 10.1126/science.aad0501 [PubMed: 27124452]
6. Dalerba P, et al. Single-cell dissection of transcriptional heterogeneity in human colon tumors. Nat Biotechnol. 2011; 29:1120–1127. DOI: 10.1038/nbt.2038 [PubMed: 22081019]
7. Lawson DA, et al. Single-cell analysis reveals a stem-cell program in human metastatic breast cancer cells. Nature. 2015; 526:131–135. DOI: 10.1038/nature15260 [PubMed: 26416748] 8. Louis, DN., Ohgaki, H., Wiestler, OD., Cavenee, WK. World Health Organization histological
classification of tumours of the central nervous system. Proceedings of the International Agency for Research on Cancer (IARC ’16); Lyon, France. 2016.
9. Macaulay IC, et al. G&T-seq: Parallel sequencing of single-cell genomes and transcriptomes. Nat Methods. 2015; 12:519–522. DOI: 10.1038/nmeth.3370 [PubMed: 25915121]
10. Macaulay IC, et al. Separation and parallel sequencing of the genomes and transcriptomes of single cells using G&T-seq. Nat Protoc. 2016; 11:2081–2103. DOI: 10.1038/nprot.2016.138 [PubMed: 27685099]
11. See supplementary materials.
12. Tirosh I, et al. Single-cell RNA-seq supports a developmental hierarchy in human
oligodendroglioma. Nature. 2016; 539:309–313. DOI: 10.1038/nature20123 [PubMed: 27806376] 13. Padul V, Epari S, Moiyadi A, Shetty P, Shirsat NV. ETV/Pea3 family transcription factor-encoding genes are overexpressed in C/C-mutant oligodendrogliomas. Genes Chromosomes Cancer. 2015; 54:725–733. DOI: 10.1002/gcc.22283 [PubMed: 26357005]
14. Kowalczyk MS, et al. Single-cell RNA-seq reveals changes in cell cycle and differentiation programs upon aging of hematopoietic stem cells. Genome Res. 2015; 25:1860–1872. DOI: 10.1101/gr.192237.115 [PubMed: 26430063]
15. Bennett ML, et al. New tools for studying microglia in the mouse and human CNS. Proc Natl Acad Sci USA. 2016; 113:E1738–E1746. DOI: 10.1073/pnas.1525528113 [PubMed: 26884166] 16. Lavin Y, et al. Tissue-resident macrophage enhancer landscapes are shaped by the local
microenvironment. Cell. 2014; 159:1312–1326. DOI: 10.1016/j.cell.2014.11.018 [PubMed: 25480296]
17. Zong H, Parada LF, Baker SJ. Cell of origin for malignant gliomas and its implication in therapeutic development. Cold Spring Harb Perspect Biol. 2015; 7:a020610.doi: 10.1101/ cshperspect.a020610 [PubMed: 25635044]
18. Sequeira L, Dubyk CW, Riesenberger TA, Cooper CR, van Golen KL. Rho GTPases in PC-3 prostate cancer cell morphology, invasion and tumor cell diapedesis. Clin Exp Metastasis. 2008; 25:569–579. DOI: 10.1007/s10585-008-9173-3 [PubMed: 18461284]
19. Tseliou M, et al. The role of RhoA, RhoB and RhoC GTPases in cell morphology, proliferation and migration in human cytomegalovirus (HCMV) infected glioblastoma cells. Cell Physiol Biochem. 2016; 38:94–109. DOI: 10.1159/000438612 [PubMed: 26741994]
20. Cooks T, Harris CC, Oren M. Caught in the cross fire: p53 in inflammation. Carcinogenesis. 2014; 35:1680–1690. DOI: 10.1093/carcin/bgu134 [PubMed: 24942866]
21. Picelli S, et al. Full-length RNA-seq from single cells using Smart-seq2. Nat Protoc. 2014; 9:171– 181. DOI: 10.1038/nprot.2014.006 [PubMed: 24385147]