Abstract The success of the hotspot approach for biodiversity conservation depends on the spatial scale and the indicator species used. In this study, we investigated grasshopper species richness in Switzerland at a 1 ha resolution including a total of 111 species. We compared the representativeness of common and of endangered grasshopper species for the overall grasshopper species richness and we assessed the efficiency of the hotspot approach for grasshopper conservation. The pattern of overall grasshopper species richness was well represented by both the number of common and the number of endangered grasshopper species. For eval-uating the efficiency of different hotspot approaches for conservation, we compared hotspots of common species, hotspots of endangered species (rarity hotspots), and hotspots of all grasshopper species (richness hotspots). Among these hotspot types, richness hotspots not only featured most common grasshopper species, but they even contained more endangered species than the rarity hotspots. The combination of rarity hotspots and hotspots of common species featured more species than the other combinations of hotspot types. However, the gain of combining two hotspot types compared to the single-hotspot approach was low (max. 3 species). About 24% of the species were not contained in any of the hotspots. These grasshopper species require species-specific action plans. As rarity hotspots were located in areas that are rather strongly affected by landscape change, species richness in rarity hotspots may decrease in the future. We conclude that, for grasshoppers, the hotspot approach on the 1 ha scale can be an effective way to conserve a high proportion of species richness.
Keywords Hotspots Æ Grasshoppers Æ Cultural landscape Æ Endangered species Æ Conservation strategy Æ Switzerland
C. E. Steck Æ T. Coch
Chair of Nature and Landscape Protection, Swiss Federal Institute of Technology Zurich (ETH), CH-8092 Zurich, Switzerland
M. Bu¨rgi Æ P. Duelli Æ C. E. Steck (&)
Swiss Federal Research Institute WSL, Zu¨rcherstrasse 111, CH-8903 Birmensdorf, Switzerland e-mail: [email protected]
DOI 10.1007/s10531-006-9089-7 O R I G I N A L P A P E R
Hotspots and richness pattern of grasshopper species
in cultural landscapes
Claude E. Steck Æ Matthias Bu¨rgi Æ Thomas Coch Peter Duelli
Received: 4 November 2005 / Accepted: 7 July 2006 / Published online: 27 October 2006
Introduction
The protection of diversity hotspots is an obvious strategy for the effective conser-vation of biodiversity (Prendergast et al.1993; Armsworth et al.2004). The global application of the hotspot-approach (Myers et al. 2000), however, is disputed be-cause decision makers may see it as a cure all, and the world outside the hotspots would remain or become a ‘coldspot’ (Jepson and Canney 2001; Kareiva and Marvier2003). On a regional or national scale, the protection of diversity hotspots could provide a basis for designing reserve networks in the sense of the Convention on Biological Diversity (ISCBD1994; Bonn et al.2002; Kati et al.2004), but also on this smaller scale there are constraints on the hotspot concept.
Several studies have shown that the diversity hotspots of different taxonomic groups are not identical and there is a lack of good biodiversity-indicators (Prender-gast et al.1993; Ricketts et al. 1999; Bonn et al.2002). However, on the landscape scale and with a high resolution, e.g. Duelli and Obrist (1997) and Sauberer et al. (2004) have shown that Heteroptera and Orthoptera can capture a high percentage of the overall species richness. Therefore, the hotspot-strategy based on high resolution surveys of popular taxonomic groups could be an efficient way of conserving biodiversity.
In practice, conservation strategies are often tailored to endangered species be-cause they are of major concern due to their above average risk of extinction. Selecting sites for a reserve network by targeting endemic and/or threatened species may therefore be a first step in reserve planning (Bonn et al. 2002). However, species-rich areas frequently do not coincide with the hotspots of rare species (Prendergast et al.1993; Bonn et al.2002), and, conversely, it is not the rare but the common species that are most responsible for richness patterns (Lennon et al.2004). In other words, the conservation of rarity hotspots (plots with high numbers of endangered species; Gjerde et al. 2004) does not necessarily capture a high per-centage of the overall species richness. In this study we address the question whether this limitation of the hotspot-strategy at low to intermediate resolutions (Prendergast et al.1993; Bonn et al.2002; Lennon et al.2004) is also effective on fine-scale hotspots (resolution = 1 ha; e.g. Gjerde et al.2004).
The discordance of the spatial patterns of common and rare species is, among other factors, caused by the markedly differing environmental requirements of these two groups (Jetz and Rahbeck 2002; Duelli and Obrist 2003; Magurran and Henderson 2003). The increasing rarity of species and the impoverishment of bio-diversity in the European cultural landscape are partially caused by habitat loss due to human-induced landscape change (e.g. Desender and Turin 1989; Ko¨hler et al. 2003). In Switzerland, the habitats of endangered grasshopper species are mainly relicts of natural habitats like natural floodplains or bogs, and relicts of traditional landscape elements such as poor grassland (Thorens and Nadig1997). Rarity hot-spots should therefore mainly be located in such relicts of either natural or tradi-tional cultural landscapes, while the hotspots of common species can also be situated on sites with higher productivity and more intense agriculture. If the rarity hotspots are actually located in either natural or traditional cultural landscapes, they are in danger of being affected by human-induced landscape changes.
Due to the potential limitation of the hotspot strategy and the potential vulner-ability of rarity hotspots, we decided to evaluate the fine-scale hotspots (resolution of 1 ha) of Swiss grasshoppers based on the following research questions:
• Is it the common or the endangered grasshopper species that are most respon-sible for the spatial pattern of grasshopper species richness?
• What environmental factors differentiate rarity hotspots from the hotspots of common species?
• Are fewer grasshopper species captured by rarity hotspots than by hotspots of common species or by richness hotspots?
Methods Study design
The database for this study consists of the grasshopper surveys in Switzerland made during the time period 1998–2003 and collected at the Swiss Biological Records Centre (CSCF Neuchaˆtel). In this time period 13,429 plots of 1 ha were surveyed (total surface of Switzerland: 4,128,400 ha). Within these plots 111 grasshopper species were found, of which 62 are endangered (Thorens and Nadig1994) and 49 species are common (not endangered).
Hotspots were defined here as the 50 plots with the highest numbers of grass-hopper species (Fig.1). We evaluated rarity hotspots (highest numbers of endan-gered grasshopper species, Thorens and Nadig1994), hotspots of common species (not endangered grasshopper species), and richness hotspots (all grasshopper spe-cies). The plots of the rarity hotspots were occupied by 9–18 endangered grass-hopper species, hotspots of common species represent plots with 11–15 species, and 17–29 grasshopper species were reported in the 50 richness hotspots (number of all plots: 13, 429).
Representativeness of common and endangered species for the spatial pattern of grasshopper species richness
A hotspot approach based on endangered species or on rarity hotspots is only valid for the entire taxon, if the endangered species are good indicators of the richness
Fig. 1 Frequency distribution of grasshopper species richness per 1 ha plot (Number of all plots: n = 13, 429). For three groups of grasshopper species, the 50 plots with highest numbers species were defined as hotspots
pattern of the whole taxon. To compare the representativeness of endangered grasshopper species and of common grasshopper species, we calculated the bivariate Spearman correlation coefficients between the number of endangered grasshopper species, the number of common grasshopper species, and the number of all grass-hopper species. These calculations were done by either including all 13,429 plots with grasshopper surveys or by two subsets, i.e., plots with 1–14 species (n = 13,298) and plots with 15–29 species (n = 131).
Differences between rarity hotspots and hotspots of common species
To evaluate the differences in the habitat-characteristics of rarity hotspots (reduced number: n = 47) and hotspots of common species (n = 50), the plots of these two hotspot types were compared by means of a logistic regression (model: a = 0.05; variables: a = 0.05; stepwise backwards procedure). In three cases two rarity hot-spots touched each other. To minimize autocorrelation one of the two hothot-spots was removed randomly.
The rarity hotspots were compared with the hotspots of common species according to 8 predictive variables. As a factor for local climate we chose the interaction of the sum of solar radiation in July and the average temperature in July (radiation by temperature; metric factor). Precipitation (sum of rainfall in July; metric) is a measure of either microclimate and of the productivity of the vegetation. The mean slope (metric) is a measure for productivity and for human disturbance, because slope in the study sites was highly correlated with soil depth (Spearman correlation coefficients > 0.6) and in steep habitats land use is more difficult. Due to soil depth’s high correlation with slope, the factor soil depth was disregarded in the model. Distance to settlements (metric) is an indicator of accessibility. If a plot contains surfaces that are listed in a national inventory of natural floodplains, of bogs, or of poor grassland, it contains a relatively ‘old’ habitat-type (habitat conti-nuity; Boolean factor). Land-use category (categorical factor with 24 classes) is a point survey of the land use in one corner of the studied plots. This survey is based on the interpretation of aerial photographs and was made between 1992 and 1997 (Swiss Federal Statistical Office 2001). Additionally the number of land-use cate-gories (land-use variety, metric factor) in the surroundings (radius = 300 m) of the study sites was taken into account in the model. As a measure of landscape change we counted the number of 1 ha plots in the surroundings (radius = 300 m) of the hotspots, in which the land-use category changed between the surveys of 1979/85 and 1992/97 (Swiss Federal Statistical Office2001).
Representativeness of different hotspot types for grasshopper species richness We used two measures to compare the representativeness of rarity hotspots, hot-spots of common species, and richness hothot-spots. First, we counted the number of species occurring in the plots of the different hotspot types and their combinations, and second, we evaluated the number of occupied plots (‘range size’ in Lennon et al.
2004) of the grasshopper species in the different hotspot types. The ‘range size’ of endangered and of common species in the three hotspot types was compared with the Friedman-test and pair-wise with the Wilcoxon-test for related samples (Bonferroni adjusted a = 0.016).
Results
Representativeness of common and endangered species for the spatial pattern of grasshopper species richness
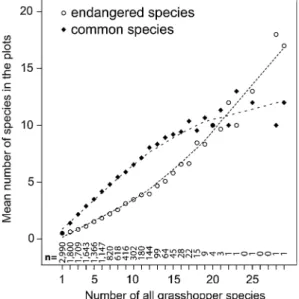
Plotting common and endangered species against total numbers of grasshopper species revealed that the representativeness of common and endangered species depends on the number of total grasshopper species per plot (Fig.2). Considering all the plots in Switzerland where grasshopper releves have been made (1–29 species, n = 13,429) and plots with 14 or less species (n = 13,298), common species (Spear-man correlation coefficients = 0.88) represent more of the total grasshopper species richness than endangered species (Spearman correlation coefficient = 0.60 and 0.59). In the plots with at least 15 grasshopper species (n = 131) the endangered species represent the total grasshopper species richness better (Spearman correlation coefficient = 0.53) than common species (Spearman correlation coefficient = 0.26). In these plots the endangered species and the common species are negatively cor-related (Spearman correlation coefficient = – 0.61).
Differences between rarity hotspots and hotspots of common species
The model outcome of the logistic regression analysis is highly significant (P < 0.001; Table1). Rarity hotspots and hotspots of common species differed significantly in several variables, namely: continuity (more rarity hotspots with ‘old’ habitat-types, Table1), precipitation (less precipitation in rarity hotspots), and landscape change (more changes in the surroundings of rarity hotspots; Table1, Fig.3).
Fig. 2 Mean numbers of endangered and common Swiss grasshopper species plotted against the total number of grasshopper species per plot: in the most species rich plots (at least 15 grasshopper species; n = 131) the number of endangered species represents the grasshopper richness pattern better than the number of common species does (dotted lines = Loess smoother; standard deviations have been omitted to make the patterns clearer)
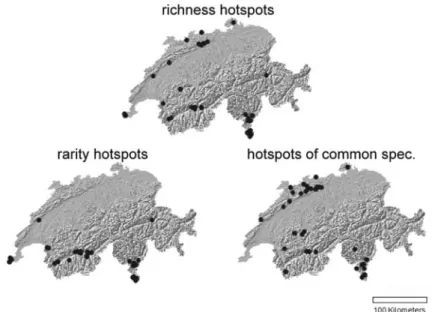
Representativeness of different hotspot types for grasshopper species richness Analyzing the spatial distribution of hotspots reveals that richness hotspots, hotspots of common species and rarity hotspots (n = 50 each) are distributed differently: whereas richness hotspots and hotspots of common species are located in both northern and southern Switzerland, rarity hotspots are mostly located in southern Switzerland (Fig.4). The 50 richness hotspots consist of 27 rarity hotspots, 17 hot-spots of common species, and 10 other plots. Four of the hothot-spots of common species and rarity hotspots are identical.
The richness hotspots represent 73% of all grasshopper species, and the hotspots of common species and rarity hotspots represent 69% (Table2). As expected, rarity hotspots represent more endangered and fewer common species than hotspots of common species. By combining different or all hotspot types, a maximum of 3 species are gained (Table2). In all three hotspot types the endangered species of the Red List category 3 (vulnerable) are better represented than the more threatened species of the Red List categories 1 (critically endangered) and 2 (endangered; Table3). 14 of the most endangered grasshopper species (Red List categories 1 and 2) are not recorded in the rarity hotspots, and 15 are not represented by hotspots of common species and by richness hotspots (Table3).
The ‘range sizes’ (number of occupied plots) of endangered species in the richness hotspots and in the rarity hotspots significantly exceed the range size of endangered
Table 1 Results of the logistic regression to differentiate between rarity hotspots (n = 47) and the hotspots of common species (n = 50): rarity hotspots and the hotspots of common species differ significantly in the variables precipitation, habitat-continuity and landscape change
Variable B SE v2 df P
Radiation by temperature – – – – –
Precipitation – 0.003 0.001 16.8 1 < 0.001
Slope – – – – –
Distance from settlement – – – – –
Habitat continuity 1.469 0.557 7.4 1 0.006 Land-use category – – – – – Land-use variety – – – – – Landscape change 0.450 0.115 23.8 1 < 0.001 Constant 1.632 0.931 Model 45.4 3 < 0.001
Fig. 3 Distinguishing between rarity hotspots and hotspots of common species: rarity hotspots (n = 47) have a lower precipitation than hotspots of common species (n = 50) and their surroundings are more strongly affected by landscape change (dotted line = Loess-smoother)
Fig. 4 Locations of grasshopper hotspots in Switzerland: rarity hotspots (n = 50) are mostly restricted to southern Switzerland, whereas the hotspots of common species (n = 50) and richness hotspots (n = 50) are also located in northern Switzerland
Table 2 Representativeness of the three hotspot types: the richness hotspots feature more species than the rarity hotspots and hotspots of common species
# Species in hotspots # Species not in hotspots
Common Endangered Common Endangered
1. Richness hotspots 36 45 13 17
2. Rarity hotspots 33 44 16 18
3. Hotspots common spec. 34 43 15 19
Hotspot combinations
1 + 2 37 46 12 16
1 + 3 37 45 12 17
2 + 3 38 46 11 16
1 + 2 + 3 38 46 11 16
Table 3 Number of endangered species in hotspots: critically endangered and endangered species (Red List categories 1 and 2) are less well represented by the three hotspot types than the more common, but still endangered, species of Red List category 3 (vulnerable)
Critically endan-gered spec.
Endangered spec. Vulnerable spec.
Total In % Total In % Total In %
Switzerland 14 8 40
Richness hotspots 4 28.6 3 37.5 38 95.0
Rarity hotspots 5 35.7 3 37.5 36 90.0
species in the hotspots of common species (Friedman-test: v2= 31.1; P < 0.001, Wilcoxon-test: Z = – 4.7; P < 0.001). The range size of common species in the rarity hotspots is significantly lower than in the hotspots of common species test: Z = – 3.4; P = 0.001) and also lower than in the richness hotspots (Wilcoxon-test: Z = – 4.3; P < 0.001). The range size of common species does not differ between the hotspots of common species and the richness hotspots (Wilcoxon-test: Z = – 1.5; P = 0.13).
Discussion
Representativeness of common and endangered species for the spatial pattern of grasshopper species richness
Our analyses show that both the number of common grasshopper species and the number of endangered species are good indicators for overall grasshopper species richness. This corresponds with several other studies where rare and/or common species also correlated with the species richness of the whole taxon (e.g. Thomas and Mallorie 1985; Berg and Tjernberg 1996; Gaston and Blackburn 1996; Lehmann et al. 2002; Lennon et al.2004; Werner and Buszko 2005). In our study, however, it was crucial to differentiate between the species-rich plots and the plots with lower numbers of species as common species contributed more to the richness pattern in areas with lower numbers of grasshopper species. Conversely, the endangered grasshopper species had a higher affinity for the most species rich plots and therefore explained more of the richness pattern in the species-rich areas. Consequently, more than 50% of the richness hotspots coincide with rarity hotspots.
The number of common Swiss grasshopper species per plot rises only to a certain level. With increasing species richness of the whole taxon, the number of common species levels off. Therefore, the habitat requirements of common Swiss grasshopper species are likely to be more heterogeneous (i.e. some species prefer dry habitats, some species prefer humid habitats and some species are generalists) than those of the endangered species, which accumulate especially in the most species-rich plots. Many of the endangered species tend to occur only under very specific conditions (e.g. dry and highly structured grassland), where they are more likely to co-exist than common grasshopper species due to their less diverse environmental requirements. Given this and because there is no published evidence that common and endangered grasshopper species differ in their mean mobility, we hypothesize that the frequency and the degree of endangerment of the grasshopper species reflects primarily habitat availability as was suggested generally by Wright et al. (1998). This hypothesis stands in contradiction to the general statements by Tilman (1997) and Hubbell (2001), who suggest that rarity depends mostly on the dispersal ability of a species or on dispersal limitation due to fragmentation.
We conclude that the rarity hotspots of an indicator taxon are likely to capture a high proportion of the overall biodiversity, because endangered grasshopper species are good indicators for grasshopper species richness, and grasshopper species are also good indicators for overall biodiversity (Sauberer et al.2004). Therefore, the general constraints on the hotspot-strategy proposed by Prendergast et al. (1993), Bonn et al. (2002), and Lennon et al. (2004) are not supported by our results.
Differences between rarity hotspots and hotspots of common species
The locations of the hotspots of endangered species (rarity hotspots) and the loca-tions of the hotspots of common species differ markedly with regard to several environmental variables: Rarity hotspots are located in areas that are less humid (precipitation), that are more likely to contain old habitat-types, such as natural floodplains, bogs, or poor grassland (habitat-continuity), and that are more strongly affected by landscape change. Due to lower humidity (with the same radiation by temperature), the productivity in rarity hotspots is likely to be lower than in the hotspots of common species. This lower productivity may indicate less land-use intensity. A lower productivity of rarity hotspots would correspond with the gen-erally differing habitat requirements of rare and common species (Jetz and Rahbeck
2002; Magurran and Henderson2003), and in particular with the higher affinity of endangered Swiss grasshopper species for habitats with low productivity (Thorens and Nadig1997). These differences in the habitat requirements of endangered and common grasshopper species lead to the different spatial distributions of rarity hotspots and the hotspots of common species in Switzerland, as their habitats are not distributed equally.
We assume that the rarity hotspots of Swiss grasshopper species are relicts of former more common habitats. The relictic character of the areas where rarity hotspots are located is indicated by their relatively low productivity and the high proportion of old habitat types. Low productivity may be a reason for the comparatively high degree of landscape change in the surroundings of the rarity hotspots because land of low productivity is often abandoned leading to the re-growth of scrub and secondary forests (Ba¨tzing 1996). The process of landscape change is highly relevant for nature conservation as it threatens habitat quality in the hotspots. Furthermore, landscape changes in the surroundings of the hotspots may affect important source populations. If nearby source populations have been lost, landscape changes in the surroundings of the hotspots might lead to a decrease in species richness in the hotspots themselves, even if they are not directly affected by these processes (e.g. Tilman et al.1994; Hanski and Ovaskainen2002; Cabeza and Moilanen 2003; Jacquemyn et al. 2003; Lindborg and Eriksson 2004; Roy et al.
2004).
Representativeness of different hotspot types for grasshopper species richness In comparison to investigations on other taxa (e.g. Prendergast et al. 1993; Gjerde et al.2004), each of our three hotspot types feature a relatively high proportion of all Swiss grasshopper species. Interestingly, it is the richness hotspots that capture most common as well as most endangered grasshopper species. Therefore, protecting richness hotspots is more ‘efficient’ than the other hotspot approaches. The ‘range size’ of the species (number of occupied hotspots) does not significantly differ from the other two hotspot types. These findings suggest that protecting richness hotspots is most efficient for conservation practice.
Most of the richness hotspots are identical with either rarity hotspots or hot-spots of common species. Rarity hothot-spots and the hothot-spots of common species differ in their environmental characteristics (Table2) and spatial distributions (Fig.4). Therefore, we conclude that the richness hotspots encompass a higher diversity of habitat-types than the rarity hotspots or the hotspots of common
species. Consequently, richness hotspots are likely to capture a higher proportion of grasshopper species than either the rarity hotspots or the hotspots of common species. But the higher diversity of habitat types is mainly reflected by the ‘range size’ of the species and only marginally by the set of species featured by the hotspots (see below).
A considerable proportion of Swiss grasshopper species does not occur in any of the three types of hotspots. Especially many critically endangered and endangered species (Red List categories 1 and 2) are not featured by the hotspots. Even com-bining two or all the three hotspot types does not lead to a remarkable increase in the number of featured grasshopper species. Therefore, very rare species or species that adapted to special habitat types (such as bogs) or special climatic regions (i.e. high altitude) are rarely featured by the hotspots. For these species, especially for the relatively high number of endangered species that do not occur in hotspots, species specific conservation policies are needed, because even a hotspot approach at regional levels would probably fail to protect them adequately.
Conclusions
In combination with species-specific conservation plans, fine-scale hotspots of species richness (at a resolution of 1 ha) are a valuable tool for biodiversity conservation in cultural landscapes, even with a focus on endangered species. However, there is a trade off between efficiency and conservation needs: while richness hotspots are most efficient in representing grasshopper species richness, it is the rarity hotspots that are most vulnerable due to landscape changes in their surroundings.
To conserve species richness in the hotspots and increase species richness in their surroundings, it might be appropriate to reintroduce or imitate traditional land-use practices if the hotspots concerned are relicts of traditional cultural landscape ele-ments such as poor grasslands (sensu Austad2000). Converting farmland into low-input habitats is an important instrument in the agri-environmental schemes developed in many European countries (Kleijn and Sutherland 2003). Protecting biodiversity is also a major objective of agri-environmental schemes in Switzerland (Bo¨tsch1998; Forni et al.1999). However, endangered species rarely benefit from these schemes (Herzog et al. 2005; Knop et al. 2006). To improve this situation, species richness must be efficiently enhanced by linking the hotspots with other species-rich habitats and by creating new hotspots. This requires having information on the most suitable sites for creating low-input habitats. Here, taxon-specific habitat-suitability models can provide a basis for optimizing the selection of potential hotspots for restoration (e.g. Maes et al.2003). Although richness hotspots capture more species, our study suggests that focussing conservation efforts on rarity hotspots might be preferred as these sites seem to be currently the most critically threatened by land-use changes.
Acknowledgements We would like to thank two anonymous reviewers for helpful comments on the manuscript. We would also like to thank P. Marchesi and E. Wermeille for the authorisation to use data of their grasshopper surveys, F. Kienast for climate-data, L. Gygax for statistical support, the Swiss Biological Records Centre (CSCF Neuchaˆtel) for their cooperation, and S. Dingwall for improving our English. This research was supported by the Swiss Agency for the Environment, Forests and Landscape (SAEFL).
References
Armsworth PR, Kendall BE, Davis FW (2004) An introduction to biodiversity concepts for envi-ronmental economists. Resour Energy Econ 26:115–136
Austad I (2000) The future of traditional agricultural landscapes: retaining desirable qualities. In: Klijn J, Vos W (eds) From landscape ecology to landscape science. Kluwer, Dordrecht, pp 43–56
Ba¨tzing W (1996) Landwirtschaft im Alpenraum unverzichtbar, aber zukunftslos? Eine alpenweite Bilanz der aktuellen Probleme und der mo¨glichen Lo¨sungen. Landwirtschaft im Alpenraum – unverzichtbar, aber zukunftslos? In: Ba¨tzig W (ed) Europa¨ische Akademie Bozen, Fachbereich Alpine Umwelt, Blackwell, Wien, Benton, 2002, pp 9–11
Berg A˚ , Tjernberg M (1996) Common and rare Swedish vertebrates – distribution and habitat preferences. Biodiv Conserv 5:101–128
Bonn A, Rodrigues ASL, Gaston KJ (2002) Threatened and endemic species: are they good indi-cators of patterns of biodiversity on a national scale? Ecol Lett 5:733–741
Bo¨tsch M (1998) Das Agrar-Umweltprogramm der Schweiz. Schriftenreihe Landesanstalt fu¨r Pflanzenbau und Pflanzenschutz 6:25–43
Cabeza M, Moilanen A (2003) Site-selection algorithms and habitat loss. Conserv Biol 17:1402–1413 Desender K, Turin H (1989) Loss of habitats and changes in the composition of the ground and tiger beetle fauna in four west European countries since 1950 (Coleoptera: Carabidae, Cicindelidae). Bio Conserv 48:277–294
Duelli P, Obrist MK (1997) In search for the best correlates for local organismal biodiversity in cultivated areas. Biodiv Conserv 7:297–309
Duelli P, Obrist MK (2003) Biodiversity indicators: the choice of values and measures. Agric Ecosyst Environ 98:87–98
Forni D, Gujer HU, Nyffenegger L, Vogel S, Gantner U (1999) Evaluation der O¨ komassnahmen und Tierhaltungsprogramme. Agrarforschung 6:107–110
Gaston KJ, Blackburn TM (1996) The spatial distribution of threatened species: macroscales and new world birds. Proc R Soc Lond B 263:235–240
Gjerde I, Sætersdal M, Rolstad J, Blom HH, Storaunet KO (2004) Fine-scale diversity and rarity hotspots in northern forests. Conserv Biol 18:1032–1042
Hanski I, Ovaskainen O (2002) Extinction debt at extinction threshold. Conserv Biol 16:666–673 Herzog F, Dreier S, Hofer G, Marfurt C, Schu¨pbach B, Spiess M, Walter T (2005) Effect of
eco-logical compensation areas on floristic and breeding bird diversity in Swiss agricultural land-scapes. Agric Ecosyst Environ 108:189–204
Hubbell SP (2001) A unified neutral theory of biodiversity and biogeography. Princeton University Press, Princeton
ISCBD (1994) Convention on biological diversity. UNEP
Jacquemyn H, Butaye J, Hermy M (2003) Influence of environmental and spatial variables on regional distribution of forest plant species in a fragmented and changing landscape. Ecography 26:768–776
Jepson P, Canney S (2001) Biodiversity hotspots: hot for what? Global Ecol Biogeogr 10:225–227 Jetz W, Rahbeck C (2002) Geographic range size and determinants of avian species richness. Science
297:1548–1551
Kareiva P, Marvier M (2003) Conserving biodiversity coldspots. Am Sci 91:344
Kati V, Devillers P, Dufreˆne M, Legakis A, Vokou D, Lebrun P (2004) Hotspots, complementary or representativeness? Designing optimal small-scale reserves for biodiversity conservation. Biol Conserv 120:471–480
Kleijn D, Sutherland WJ (2003) How effective are European agri-environment schemes in conserving and promoting biodiversity? J Appl Ecol 40:947–969
Knop E, Kleijn D, Herzog F, Schmid B (2006) Effectiveness of the Swiss agri-environment scheme in promoting biodiversity. J Appl Ecol 43:120–127
Ko¨hler G, Detzel P, Mass S (2003) Kriterian des Aussterbens––eine Ero¨terung anhand der in den Bundesla¨ndern augestorbenen Heuschreckenarten (Ensifera, Celifera). Articulata 18:109–138 Lehmann A, Leathwick JR, Overton JM (2002) Assessing New Zealand fern diversity from spatial
predictions of species assemblages. Biodiv Conserv 11:2217–2238
Lennon JJ, Koleff P, Greenwood JJD, Gaston KJ (2004) Contribution of rarity and commoness to patterns of species richness. Ecol Lett 7:81–87
Lindborg R, Eriksson O (2004) Historical landscape connectivity affects present plant species diversity. Ecology 85:1840–1845
Maes D, Gilbert M, Titeux N, Goffart P, Dennis RLH (2003) Prediction of butterfly diversity hotspots in Belgium: a comparison of statistically focused and land use-focused models. J Bio-geogr 30:1907–1920
Magurran AE, Henderson PA (2003) Explaining the excess of rare species in natural species abundance distributions. Nature 422:714–716
Myers N, Mittermeier RA, Mittermeier CG, da Fonseca GA, Kent J (2000) Biodiversity hotspots for conservation priorities. Nature 403:853–858
Prendergast JR, Quinn RM, Lawton JH, Eversham BC, Gibbons DW (1993) Rare species, the coincidence of diversity hotspots and conservation strategies. Nature 365:335–337
Ricketts TH, Dinerstein E, Olson DM, Loucks C (1999) Who’s where in North America? Bioscience 49:369–381
Roy M, Pascual M, Levin SA (2004) Competitive coexistence in a dynamic landscape. Theor Popul Biol 66:341–353
Sauberer N, Zulka KP, Abensberg-Traun M, Berg H-M, Bieringer G, Milasowszky N, Moser D, Plutzar C, Pollheimer M, Storch C, Tro¨stl R, Zechmeister H, Grabherr G (2004) Surrogate taxa for biodiversity in agricultural landscapes of eastern Austria. Biol Conserv 117:181–190 Swiss Federal Statistical Office (2001) The changing face of land use – Land use statistics of
Switzerland. SFSO, Neuchaˆtel
Thomas CD, Mallorie HC (1985) Rarity, species richness and conservation: butterflies of the Atlas Mountains in Morocco. Biol Conserv 33:95–117
Thorens P, Nadig A (1994) Rote Liste der gefa¨hrdeten Heuschrecken der Schweiz. In: Duelli P (ed) Rote Listen der gefa¨hrdeten Tierarten in der Schweiz. BUWAL-Reihe Rote Listen, EDMZ, Bern, pp 66–68
Thorens P, Nadig A (1997) Verbreitungsatlas der Orthopteren der Schweiz. Doc Faunistica Helv 16:236
Tilman D, May RM, Lehman CL, Nowak MA (1994) Habitat destruction and the extinction debt. Nature 371:65–66
Tilman D (1997) Community invasibility, recruitment l imitation, and grassland biodiversity. Ecol-ogy 78:81–92
Werner U, Buszko J (2005) Detecting biodiversity hotspots using species-area and endemics-area relationships: the case of butterflies. Biodiv Conserv 14:1977–1988
Wright DH, Patterson BD, Mikkelson GM, Cutler A, Atmar W (1998) A comparative analysis of nested subset patterns of species compositin. Oecologia 113:1–20