REVIEW
Recent developments in the use of isotope ratio mass
spectrometry in sports drug testing
Thomas Piper&Caroline Emery&Martial Saugy
# Springer-Verlag 2011
Abstract According to the annual report of the World Anti-Doping Agency, steroids are the most frequently detected class of doping agents. Detecting the misuse of endogenously occurring steroids, i.e. steroids such as testosterone that are produced naturally by humans, is one of the most challenging issues in doping control analysis. The established thresholds for urinary concentrations or concentration ratios such as the testosterone/epitestosterone quotient are sometimes inconclusive owing to the large biological variation in these parameters.
For more than 15 years, doping control laboratories focused on the carbon isotope ratios of endogenous steroids to distinguish between naturally elevated steroid profile parameters and illicit administration of steroids. A variety of different methods has been developed throughout the last decade and the number of different steroids under investi-gation by isotope ratio mass spectrometry has recently grown considerably. Besides norandrosterone, boldenone was found to occur endogenously in rare cases and the misuse of corticosteroids or epitestosterone can now be detected with the aid of carbon isotope ratios as well. In addition, steroids excreted as sulfoconjugates were investi-gated, and the first results regarding hydrogen isotope ratios recently became available.
All of these will be presented in detail within this review together with some considerations on validation issues and on identification of parameters influencing steroidal isotope ratios in urine.
Keywords Carbon isotope ratio . Hydrogen isotope ratio . Steroid profile . Steroid metabolism . Doping control
Introduction
Steroids are still very popular amongst athletes as performance-enhancement drugs and are responsible, according to the annual World Anti-Doping Agency (WADA) laboratory statistics report [1], for nearly two thirds of all adverse or atypical analytical findings. In the WADA list of prohibited substances, anabolic androgenic steroids are divided into exogenous and endogenous compounds [2]. In the case of exogenous steroids, i.e. steroids not synthesized by humans, the presence of these substances or their metabolites is strictly prohibited in urine specimens. Detection at any concentration results in an adverse analytical finding.
For endogenous steroids, i.e. steroids produced naturally by humans, the situation is more complicated as these steroids are always present in doping control specimens. Therefore, thresholds have been established for the concentration or concentration ratio. A very useful one is the ratio of testosterone (T) to epitestosterone (EpiT) (T/EpiT), both excreted as glucuronides into urine [2–5]. A T/EpiT ratio exceeding the threshold of 4 is suspicious for T administra-tion as defined in the WADA Technical Documents. Unfortunately, in most samples in which this threshold is exceeded, the T/EpiT ratios are elevated owing to natural variations [4]. To distinguish between these natural elevated T/EpiT ratios and steroid misuse, longitudinal steroid profiles were established and are still used today [5–7]. As these are quite time-consuming and expensive, doping control labora-tories started to discover, in the mid-1990s, the potential of gas chromatography/combustion/isotope ratio mass spec-trometry (GC/C/IRMS) to assist in making a more timely decision [8–13].
Published in the special issue Anti-Doping Analysis with Guest Editor Mario Thevis.
T. Piper (*)
:
C. Emery:
M. Saugy Swiss Laboratory for Doping Analyses, Ch. des Croisettes 22,1066 Epalinges, Switzerland e-mail: [email protected]
Received: 23 December 2010 / Revised: 3 March 2011 / Accepted: 8 March 2011 / Published online: 30 March 2011
Isotopic fractionation takes place during the formation or degradation of organic substances. The stable isotopes of carbon, 13C and 12C, are then not uniformly distributed throughout all organic materials [14, 15]. Consequently, steroids produced inside the body exhibit a different13C/12C ratio than pharmaceutically produced steroids. The carbon isotope ratios (CIR) of endogenous steroids reflect the individual’s diet (see “Factors influencing CIR of endoge-nous steroids”) derived from a mixture of C3and C4plants.
Pharmaceutically produced T, in contrast, is obtained from one plant material, namely the C4plant soy, and therefore in
most cases shows depleted13C/12C ratios.
CIR are expressed as δ13C values against the interna-tional standard Vienna Pee Dee Belemnite (VPDB) based on the equation 1000 * ‰ 12 13 12 13 12 13 13 std std sample C C C C C C C ð1Þ
where 13C/12C refers to the isotopic composition of the sample or standard [16].
Usually,δ13C values of endogenous steroids fall between −26‰ and −16‰, whereas pharmaceutical preparations have δ13
C values below −27‰ [17–19]. As the absolute differ-ence between endogenous and exogenous steroids can be quite small, WADA established difference (Δ) values between endogenous reference compounds (ERC) and target compounds (TC) to distinguish the source of urinary steroids. TheseΔ values are expressed by Eq.2:
TC
ERC
C
C
1313
‰
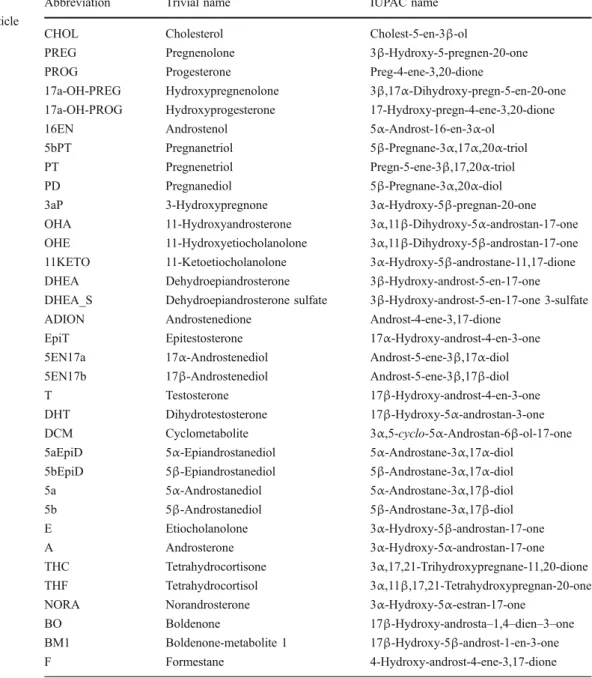
ð2ÞAll ERC and TC routinely employed in doping control analysis are depicted in Fig. 1, showing the assumed metabolic pathways, and are listed in Table1. All endoge-nous steroids and their abbreviations used throughout this article are also summarized in Table1.
This review is subdivided into several parts dealing with different aspects of isotope ratio mass spectrometry (IRMS) and steroids. It starts with a brief review of the
develop-Fig. 1 Metabolism of endogenous steroids. Steroids with abbreviated names in blue are referred to as precursor steroids, steroids with abbreviated names in green are used as endogenous reference
compounds and steroids with abbreviated names in red are target compounds. Brown steroids depict the metabolic route yielding DCM. All abbreviations are described in Table1
ments in IRMS techniques, then summarizes the recent developments in methods for doping analysis using13C/12C isotope ratios, leading to the topic of2H/1H determinations of endogenous steroids. Then factors influencing the CIR of urinary steroids are discussed together with new approaches in validation protocols utilized for GC/C/IRMS.
The development of IRMS and its introduction to sports drug testing
The development of IRMS from its beginning in the 1930s until today has been reviewed several times [20]. To meet the requirements for routine isotope ratio measurements of steroids, gas chromatography (GC) systems had to be coupled
to IRMS systems. With this technique, developed in the 1970s, it was possible to measure nanogram amounts of carbon [21–24]. The key feature was the online combustion of organic compounds that were eluted from the GC system together with the direct transfer of the CO2formed, after water
removal, into the mass spectrometer [25–28]. Since then some reasonable hardware improvements have been accomplished [29–33] together with software advancements [34–36].
One of the main problems regarding steroid measure-ments was the low volatility and the relative high polarity of these compounds. To overcome peak broadening and tailing in the GC system, derivatisation of steroids is usually employed. Initially, the derivatisation of the hydroxyl function to trimethysilyl ethers (TMS) was the method of choice [37]. Later, the enolization and
trime-Abbreviation Trivial name IUPAC name
CHOL Cholesterol Cholest-5-en-3β-ol
PREG Pregnenolone 3β-Hydroxy-5-pregnen-20-one
PROG Progesterone Preg-4-ene-3,20-dione
17a-OH-PREG Hydroxypregnenolone 3β,17α-Dihydroxy-pregn-5-en-20-one 17a-OH-PROG Hydroxyprogesterone 17-Hydroxy-pregn-4-ene-3,20-dione
16EN Androstenol 5α-Androst-16-en-3α-ol
5bPT Pregnanetriol 5β-Pregnane-3α,17α,20α-triol
PT Pregnenetriol Pregn-5-ene-3β,17,20α-triol
PD Pregnanediol 5β-Pregnane-3α,20α-diol
3aP 3-Hydroxypregnone 3α-Hydroxy-5β-pregnan-20-one
OHA 11-Hydroxyandrosterone 3α,11β-Dihydroxy-5α-androstan-17-one OHE 11-Hydroxyetiocholanolone 3α,11β-Dihydroxy-5β-androstan-17-one 11KETO 11-Ketoetiocholanolone 3α-Hydroxy-5β-androstane-11,17-dione DHEA Dehydroepiandrosterone 3β-Hydroxy-androst-5-en-17-one DHEA_S Dehydroepiandrosterone sulfate 3β-Hydroxy-androst-5-en-17-one 3-sulfate
ADION Androstenedione Androst-4-ene-3,17-dione
EpiT Epitestosterone 17α-Hydroxy-androst-4-en-3-one
5EN17a 17α-Androstenediol Androst-5-ene-3β,17α-diol
5EN17b 17β-Androstenediol Androst-5-ene-3β,17β-diol
T Testosterone 17β-Hydroxy-androst-4-en-3-one
DHT Dihydrotestosterone 17β-Hydroxy-5α-androstan-3-one
DCM Cyclometabolite 3α,5-cyclo-5α-Androstan-6β-ol-17-one
5aEpiD 5α-Epiandrostanediol 5α-Androstane-3α,17α-diol
5bEpiD 5β-Epiandrostanediol 5β-Androstane-3α,17α-diol
5a 5α-Androstanediol 5α-Androstane-3α,17β-diol 5b 5β-Androstanediol 5β-Androstane-3α,17β-diol E Etiocholanolone 3α-Hydroxy-5β-androstan-17-one A Androsterone 3α-Hydroxy-5α-androstan-17-one THC Tetrahydrocortisone 3α,17,21-Trihydroxypregnane-11,20-dione THF Tetrahydrocortisol 3α,11β,17,21-Tetrahydroxypregnan-20-one
NORA Norandrosterone 3α-Hydroxy-5α-estran-17-one
BO Boldenone 17β-Hydroxy-androsta–1,4–dien–3–one
BM1 Boldenone-metabolite 1 17β-Hydroxy-5β-androst-1-en-3-one
F Formestane 4-Hydroxy-androst-4-ene-3,17-dione
Table 1 Overview of all endogenous steroids, their abbreviations used in this article together with their IUPAC names
thylsilylation of oxo functions was accomplished by the use of trimethyliodosilane formed in situ [5,38]. This method was used for cholesterol (CHOL) determinations early in development, but this derivatisation method proved to be useless for IRMS determinations as the layer of combusted silicon caused problems within the online combustion tubes by retaining carbon and influencing theδ13C values of the CO2formed [39,40].
Acetylation of hydroxyl functions with acetic anhydride and pyridine prior to CIR determination became the most common derivatisation procedure for steroids. The different methods of sample preparation will be summarized in the following section.
Since the late 1990s, it has been possible to measure hydrogen isotope ratios (HIR) with a continuous-flow IRMS system [41–44]. Hydrogen constitutes, besides carbon, the other abundant element in the steroid backbone and might become of interest for sports drug testing.
The latest instrumental improvement, which is now becoming more and more commercially available, was the direct coupling of a GC system to both an IRMS system and a mass-selective detector (MSD) to achieve a simulta-neous determination of isotope ratios with mass spectral data [45]. Although this application is needed for identifi-cation of target analytes or coeluted substances, it reduces the amount of sample available for IRMS. This could cause problems in measurement of substances with low concentra-tion of interest in doping controls such as norandrosterone (NORA) and boldenone (BO).
IRMS methods developed and used in sports drug testing
The main class of substances investigated with IRMS in the context of doping control analysis is the steroids. In this section, a chronological overview of developments is given. The first offline IRMS determinations, i.e. using a dual-inlet instrument and a sample preparation method encompass-ing offline combustion, of human serum CHOL took place in the early 1980s [46, 47]. In 1993, several research results were published on the topic of CHOL absorption and metabolism. These included 2H- and 13C-labelled CHOL together with acetylation and MSD determination [48], and offline IRMS determination of the 13C-labelled compound after high-performance liquid chromatography (HPLC) separation on an octadecyl silica column [49]. GC/C/IRMS was also introduced to steroid measurement of plasma CHOL after solid-phase extraction (SPE) on an amino (NH2) column and TMS derivatisation [39].
From 1994 onwards, many sample preparation methods for urinary steroids were developed. The main task of sample preparation is the purification of target analytes
from the complex biological matrix (urine) to achieve efficiently isolated and purified compounds and to avoid coelutions that might impede IRMS determinations.
The first published method allowing for determination of CHOL, T, dehydroepiandrosterone (DHEA) and 5β-androstanediol (5b), by Becchi et al. [8], encompasses liquid–liquid extraction (LLE) of unconjugated CHOL followed by SPE and hydrolysis of glucuronidated steroids withβ-glucuronidase. The unconjugated steroids were then further purified by HPLC on a C18 column using an
acetonitrile and water mobile phase and afterwards they were acetylated prior to measurement. The main features of this sample preparation, LLE and SPE, were retained in all subsequent methods. Aguilera et al. [9] presented a method with acetylation prior to HPLC offering the chance to determine 17β-androstenediol (5EN17b). The purification of T using immunoaffinity chromatography was investigated but not employed further [10,11]. Shackleton et al. [12,13] then broadened the range of steroids investigated [5 α-androstanediol (5a), 5b, 5α-epiα-androstanediol (5aEpiD), 5β-epiandrostanediol (5bEpiD) and 5EN17b] by hydrolysis of both glucuronides and sulfoconjugates and by performing the SPE on a Sephadex LH-20 column after removal of ketonic steroids using Girards reagent T.
In 1999 a method was published focusing on pregnane-diol (PD), 5a and 5b, especially to improve the detection of T misuse [50]. Derivatisation with O-ethylhydroxylamine was investigated for determination of etiocholanolone (E) and androsterone (A) [51], and Ueki and Okano [17] investigated PD, 5a and 5b excreted glucuronidated and added dehydroepiandrosterone sulfate (DHEA_S) to the scope of IRMS methods using a TEAP-LH20 anion exchange column.
In 2000, another method for E and A was published but lacked the possibility of determining an ERC [52] and the first experiments regarding pregnenolone (PREG) administration were completed [53]. PREG may be used by athletes as a masking agent, i.e. a substance with no performance-enhancing properties but the ability to cam-ouflage other steroid misuse. PREG is largely converted to PD and therefore can change the CIR of this often used ERC and lead to false-negative results. Furthermore, the misuse of cortisone and its detection by CIR were investigated using the main metabolites tetrahydrocortisol (THF) and tetrahydrocortisone (THC) after both had been converted by potassium dichromate oxidation to 5β-androstan-3,11,17-trione [54].
The first reference population (RefPop)-based values (n=73 males) for 5a, 5b and PD were reported 1 year later [55] and a new analyte, EpiT, was added to the scope of IRMS methods [56]. EpiT has the potential of a masking agent not by influencing CIR but by lowering the T/EpiT ratio of an athlete whereby a administration of T might remain
undis-covered. The first method encompassing androstenol (16EN) together with PD, E, A, 5a and 5b was reported in 2004 and was tested using excretion studies undertaken with DHEA, PREG and T [57, 58]. A novel steroid, the DHEA cyclo-metabolite (DCM), was also included in an existing method for E, A and 11-ketoetiocholanolone (11KETO) [59].
The first results on the 2H/1H ratios of E and A were reported [60] as well as some T-related preparations exhibiting endogenous CIR [61]. One year later, RefPop-based values for E, A and 11KETO (n=167 athletes) were published together with a first insight into isotopic fractionation during DHEA metabolism [62]. After multiple oral administration of DHEA, the urinary excreted main metabolite E showed more deplete δ13C values than the administered DHEA, suggesting that isotopic fractionation must have taken place during the metabolic transformation. In the meantime, investigations on PREG were ongoing [63] and a new method using hydropyrolysis of CHOL instead of derivatisation was developed [64].
In 2006 a new analyte, NORA, was investigated by IRMS, as this occurred in some rare cases endogenously or is produced during bacterial degradation in urine. A CIR method was needed to distinguish these cases from those arising from administration of nandrolone or related prohormones. Sample preparation was extended to a twofold HPLC clean-up using two different columns [65]. The first investigations on the influence of diet on CIR of endogenous steroids were published at that time [66, 67] together with research on interindividual variability of CIR after T administration [68]. In the same year, routine doping control samples (n=99) showing elevated DHEA concen-trations (between 100 and 200 ng/mL) were investigated by IRMS and the meanΔ values for 11-hydroxyandrosterone (OHA), A and E were presented [69]. Ninety-eight samples showed clearly endogenous values, questioning the estab-lished WADA threshold for glucuronidated DHEA of 100 ng/mL.
Formestane (F), which is produced endogenously in low amounts, was added to the steroids of interest for IRMS in 2008 [70] to distinguish low-level natural substance from administered drug. It has to be considered that not only F intake itself will result in influenced CIR of urinary F. Administration of androstenedione (ADION) also has a strong influence on CIR of urinary F. In addition, considering the different punishments applied if their use is detected in sports drug testing, the distinction between both types of administration with the help of CIR measurement is important.
The Cologne group reported the results of two RefPops, one on E, A, OHA and PD (n=56) to show differences inδ values between the genders [71] and one encompassing E, A, 5a, 5b, T, EpiT, DHEA, OHA, PD and 16EN with n=61 volunteers allowing for a comprehensive consideration of
reference-based limits forΔ values and isotopic differences between urinary excreted steroids due to isotopic fraction-ation during metabolism [72].
A comparison of sample preparation including HPLC up of samples rather than to rely only on SPE clean-up was reported in 2009 [73]. In that year a research project focusing on the influence of diet on CIR of steroids was published [74] and another RefPop encompassing 171 male soccer players emerged [75]. Two laboratories reported data using collected samples, which were investigated for CIR and which gave a significant difference inδ values between athletes from different countries but which showed that the Δ values were not influenced [19, 76]. Investigations on the misuse of 4-androstene-3,11,17-trione, a nutritional supplement [77], and a comprehensive method to detect cortisone misuse, again using oxidation of target analytes, were published [78]. Another research focus was on EpiT and its metabolites 5aEpiD and 5bEpiD, which provided data for another RefPop (n=74), again showing differences between the genders in their CIR [79], and the first extensive results on the 2H/1H ratio of endogenous urinary steroids were reported [80]. As expected, HIR showed a larger variation in their δ2H values, but the associated Δ values were found to be stable; this might become a promising approach for doping control.
In 2010, results on2H/1H ratios of synthetic T prepara-tions became available [81]. A method to detect the endogenous source of BO by measuring the CIR of urinary BO and boldenone-metabolite 1 (BM1) [82] and the first investigations on urinary steroids excreted as sulfoconjugates [namely E, A, epiandrosterone EpiA, 17α-androstenediol (5EN17a), 5EN17b, pregnenetriol (PT)] together with reference values were published [83]. Furthermore, IRMS values of steroid degradation products such as 5 α-androstan-3,17-dione and 5β-androstan-α-androstan-3,17-dione were investigated, showing strong isotopic fractionation especially during the formation of DCM by deconjugation of DHEA_S [84]. Finally, two reviews on IRMS in doping analysis have been published [85,86].
2H/1H ratios of endogenous urinary steroids
Why should2H/1H ratios be used in doping control analysis?
As discussed in the previous section, until now the use of CIR has been well investigated. Unfortunately, some specific problems became apparent regarding the use of CIR alone. As can be seen in Fig.2, the difference between endogenous and synthetic steroids is not always large enough to allow them to be distinguished. Whereas endogenous steroids reflect the CIR of a mixture of C3
and C4 plants, synthetic steroids should exhibit a clear
single C3signature, resulting in values lower than−26.5‰
[17,18]. Some rare cases have been reported with steroids exhibiting δ13C values in the endogenous range [61, 82] and recently a comprehensive investigation on seized T samples showed that nearly 10% of all T preparations were enriched more than −25‰ [81]. To overcome these problems, which could result in false-negative doping control samples, HIR might offer a powerful solution.
Isotopic fractionation of hydrogen in plants does not follow a route as distinctive as for carbon and it results in the larger variability of HIR [87–90]. Furthermore, the main factor influencing the2H/1H ratio of endogenous steroids should be drinking water, showing a large variability, and not food intake [91,92]. Thus, the HIR should be independent of the CIR, allowing for the detection of exogenous steroids in cases where CIR alone might fail for the above-mentioned reasons. Technical considerations
HIR are expressed in parallel to CIR using Eq. 3 with Vienna Standard Mean Ocean Water (VSMOW) as an international reference: 1000 * ‰ 1 2 1 2 1 2 2 std std sample H H H H H H H ð3Þ
Δ values are calculated as for CIR (Eq.2).
As the natural abundance of2H is far less than that of
13
C (see Table 2), the amount needed for a valid HIR
determination is approximately tenfold that for a valid CIR determination and the results have larger standard devia-tions (SD) [28]. In addition to the higher amount of sample necessary, the combustion differs considerably from that for CIR. High-temperature pyrolysis was found to be the most effective way to produce H2gas from organic compounds
eluted from the GC column [41,42].
During the IRMS measurements the low-energy helium used as a carrier gas in the system causes problems as it corrupts the m/z 3 measurements [93]. This problem has been overcome by incorporation of a retardation lens for filtering all helium interferences and which is now employed in the commercially available IRMS systems [44]. In correlation to the partial pressure of H2 entering the ion source, H3+ is
formed and adulterates the HIR determination. This formation of H3+ is another interference for m/z 3, which is
amount-dependent and has to be corrected for [94–96]. Furthermore, the helium flow through the combustion tube and the issue of preconditioning the tube with a carbon layer have to be considered [28, 97]. The phenomenon of preconditioning stabilizing the HIR determined can be attributed to a shift of the equilibrium from intact molecules composed of carbon and hydrogen (such as methane and propane) towards H2 in the presence of solid carbon acting as a
catalyst at elevated temperatures [80,98]. First results on endogenous HIR
The first investigation on HIR of steroids was on plant sterols showingδ2H values ranging from−200‰ to −300‰ [88]. In 2004, the first attempt was made to determine the HIR of urinary steroids measured underivatised in order to investi-gate its applicability to antidoping analysis [60]. These results were promising but complicated by memory effects during isotope ratio measurements. To overcome these problems and to extend the number of steroids to be analysed, different derivatisation procedures were investigated.
The first trial using steroid heptafluorbutyrates was promising with regard to both HPLC clean-up and the first IRMS measurements. It enabled the determination of 11KETO, OHA, 16EN, PD, E, A, 5a and 5b from one urine specimen and as this derivatisation did not add any hydrogen to the steroid backbone, it rendered any correc-tion for the derivatisacorrec-tion moiety unnecessary. Memory
-30 -28 -26 -24 -22 -20 -18 ‰ synthetic steroids endogenous steroids -30 -20 -10 0 ‰ C3-plants C4-plants CO2
Fig. 2 Overview of δ13C values expected for endogenous and synthetic steroids. Further information can be found in the text
Element Isotope Natural abundance 1‰ change Typical precision (‰) Typical sensitivity (nmol) Hydrogen 1H 0.999844 0.000000156 2–5 10–50 2 H 0.000156 Carbon 12C 0.98889 0.00001123 0.1–0.3 0.1–5 13 C 0.01111
Table 2 Isotopic abundance at natural levels [28,92]
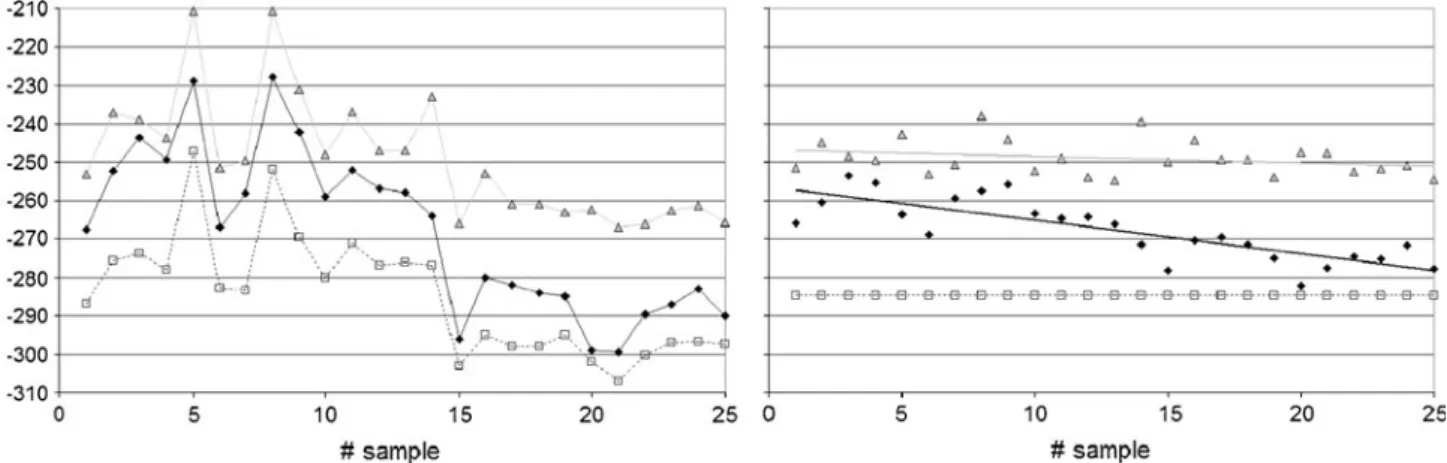
effects were also found for this method, but could be easily corrected for by using 3β-hydroxy-5α-androstan e (RSTD) as secondary reference standard with each measurement. The benefit of this correction is depicted in Fig. 3, decreasing the SD for standard determinations from more than ±16‰ to below ±8‰. Replicated sample preparation and measurement of a blank urine showed comparable results after correction was applied (Table3). Unfortunate-ly, fluorine was found to be an inadequate derivatisation agent, with HF emerging from the ion source after short time despite the use of copper wires for removal of HF from the gas stream, destroying the ceramic thermal conversion tube and causing additional memory effects by the formation of HF during combustion [28,99].
Despite addition of hydrogen to the analyte, acetylation was found to be a reasonable derivatisation process. Using this it was possible to determine the HIR of ten different urinary steroids (OHA, PD, 16EN, E, A, 5a, 5b, T, EpiT, DHEA) from a single aliquot of urine [80]. An interesting correlation between the added reference standard and the target analyte could be observed, not only reflecting problems caused by“classical” memory effects. However, owing to the stability and reproducibility of this correlation, the values obtained could easily be corrected for.
The preliminary RefPop investigated (n = 18 males) showed the presumed stability of interindividual Δ2H values and this should, after further investigation of an appropriate larger population, allow for the calculation of reference values as has been accomplished for CIR. Moreover, a good correlation between CIR and HIR of endogenous steroids could be found, enabling consideration of metabolic pathways and subsequent isotopic fraction-ation. The results suggested a different isotope ratio for both carbon and hydrogen in the different steroid produc-tion sites in the human body [80].
Conclusions
These first results on HIR look promising for use in sports drug testing and should offer the opportunity to use HIR in addition to or complementary to CIR. The results published on the isotope ratios of seized T preparations promote this promise to only a limited extent [81]. Preparations of T found with CIR in the endogenous range (above−26‰) did not exhibit significantly different HIR from the those determined for endogenous T. Further research will have to be conducted on this topic to evaluate the prospects for use of HIR in doping control analysis.
Factors influencing CIR of endogenous steroids
The different RefPops investigated so far allow for identification of some of the factors influencing the isotopic composition of urinary excreted steroids. Some are widely accepted as derived from the influence of diet and some are still under discussion as arising from the influence of ethnicity onδ13C values. All possible factors identified will be discussed.
Influence of diet
Subsequent to the findings for different isotopic composi-tions in different varieties of plants, the influence of the diet on the13C/12C ratio found in animals was investigated [87,
100–102]. Basically, animals reflect the CIR of their diet, usually showing slightly enriched values, which resulted in the dictum by DeNiro and Epstein: “You are what you eat (plus a few‰)”.
Shortly after, results on humans were reported, showing the correlation of CIR to diet and hair together with
Fig. 3 Hydrogen isotope ratios of 25 consecutive determinations of a standard mixture containing (RSTD) (squares), 16EN (diamonds) and E (triangles). The raw data are depicted on the left, and the values
corrected for by RSTD are depicted on the right. Further information can be found in the text
geographical variations inδ13C values of diet [103]. It took quite a long time until the relationship between diet and CIR of steroids was investigated. Some first results on this topic were reported in 2005, showing that an isotopic switch in diet results in a change ofδ13C values of steroids [67]. The same was found for three top-level athletes living partly in Switzerland and in an African country. After the diet had been changed,δ13C values could be made to differ by more than 2‰ [68]. Comparable results were obtained for two German women visiting the USA for 2 weeks. Even after this short trip, their δ13C values were enriched by approximately 1‰ [72], reflecting a change to a diet rich in corn-derived products.
In 2009, the influence of geographical variation on the CIR of steroids was reported by two groups [19, 76]. Presumably, the reasons for these variations are due to the different eating habits together with the differing isotopic composition of food in various parts of the world [103]. Depleted CIR of steroids of a group of vegetarians mainly eating soy products have also been reported [74].
Overall, the influence of diet on the CIR of urinary steroids seems not to be problematic for doping control. The influence on Δ values, i.e. the differences between ERC and TC, can be assumed to be negligible as both ERC and TC are affected in parallel. Thresholds established for Δ values therefore are independent of the absolute δ13
C value [19, 76]. Short-term variations might have an influence if one steroid is influenced faster than another by the change in diet. The preliminary results presented on this topic did not show a false-positive case induced by a change in diet [67,68,72].
Influence of gender
All of the early RefPops investigated in the context of doping control consisted only of males or undeclared gender. The first investigations on the impact of gender on CIR of urinary steroids were presented by Flenker et al. [71]. Women tend to show more depleted, i.e. more negative, δ13C values in their urinary steroids OHA and A. This finding was supported by data from routine doping control samples and another RefPop investigated [19,79]. PD showed the same pattern, whereas EpiT, investigated in the latter population [79], was not significantly different for
males and females, but its metabolites 5aEpiD and 5bEpiD were. Steroids excreted as sulfates demonstrated the same trend towards more depleted values for females, but only DHEA and 5EN17a were found to be significant [83].
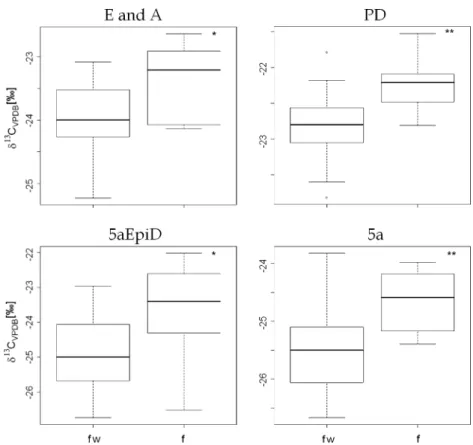
A closer look at the data revealed that the difference could not be attributed to gender but rather could be attributed to the use of oral contraceptives [71, 79]. Only those women using contraceptives showed significantly different CIR in several endogenous steroids (Fig. 4). Women not using contraceptives showed the same CIR as men in their urinary steroids. Despite the fact that the influence of oral contraception on the steroid profile of women is known and has been well investigated [5,104], it is not easy to explain the differences found in CIR. Usually a decrease in the amount of some steroids excreted can be found. But the concentration of steroids excreted is usually not correlated to the corresponding δ13C values [72, 79]. One possible explanation may be the influence of admin-istered contraceptives on the different enzymatic reactions taking place inside the body, transforming steroids. This could change the isotopic fractionation induced by particular enzymes and result in different CIR of the urinary excreted steroids.
Another explanation may be a difference in CIR of steroids excreted at different production sites, namely the adrenal gland and the gonads. A third possible production site in women is the corpus luteum, producing high amounts of PREG depending on the status of the menstrual cycle. PREG is mainly converted to PD and to other steroids with a 5α configuration. This production is completely suppressed by oral contraceptives. To investi-gate a possible difference in CIR of steroids produced by the corpus luteum which might explain the differences found in CIR of women using or not using contraceptives, two women (one using oral contraceptives and the other not) collected urine samples over one menstrual cycle and the urinary concentrations were measured as well as the CIR of selected steroids. The results obtained are depicted in Fig.5.
The female volunteer not using oral contraceptives showed the expected increase in urinary concentrations of PD in the luteal phase of the menstrual cycle. The PROG formed by the corpus luteum is primarily metabolized to PD (see Fig. 1) and is renally excreted. The PD concen-Table 3 Hydrogen isotope ratios of endogenous steroids, n = 8 consecutive preparations of one male blank urine sample. All values in δ2
HVSMOW(‰)
11KETO (‰) OHA (‰) 16EN (‰) PD (‰) A (‰) E (‰) 5a (‰) 5b (‰)
Mean −290 −285 −255 −238 −274 −289 −252 −288
SD 2.9 4.9 8.2 5.3 5.0 5.2 7.4 4.3
trations excreted by the woman using contraceptives remained stable over the complete cycle. The δ13C values remained stable in both volunteers, only showing a slight trend towards more depleted values with an increasing amount of PD excreted. This trend cannot explain the differences found between women not using contraceptives and women using contraceptives. It is too small and is in
the opposite direction. Presumably, this belongs to an effect already described in the context of excretion studies where an elevated amount of urinary excreted steroids caused a slight depletion of the CIR in these steroids [79].
Therefore, further studies are necessary to elucidate the difference in CIR found for women using oral contraceptives. Influence of steroid metabolism
Many different enzymes are involved in the metabolism of steroids. Detailed overviews can be found in the literature [105–109]. Some of these enzymes are ubiquitous, some are only found in distinctive compartments of the body. Overall, this results in a very complicated reaction network, partly depicted in Fig.1, starting from CHOL and ending up in numerous different steroids excreted into urine, faeces and sweat.
Every diffusion process, every enzymatic or chemical reaction can be accompanied by isotopic fractionation [14,
15]. Little is known about the induced changes of isotope ratios of steroids during these processes.
In 2005, a comprehensive study on DHEA administration was performed, showing that one of the excreted main metabolites of DHEA, E, was found depleted in comparison with the administered steroid and the other main metabolite, A [62]. In addition, more E is excreted than A. Presumably the 5-ene-steroid DHEA is metabolized to the 5β-steroid E to a higher extend than to the 5α steroid A and especially the 5β-Fig. 5 Changes in urinary concentrations and CIR of PD over the
menstrual cycle of one woman using oral contraceptives (fw) and one woman not using oral contraceptives (f). Circles represent the CIR of PD of the woman using oral contraceptives, diamonds represent the CIR of PD of the woman not using oral contraceptives, black triangles represent the concentration of PD of the woman not using oral contraceptives and open triangles represent the concentration of PD of the woman using oral contraceptives. Further information can be found in the text
Fig. 4 Box plots of carbon isotope ratios (CIR) of different endogenous steroids excreted as glucuronides. fw women using oral contraceptives (n=18),
f women not using oral contraceptives (n=8). The results found for women not using oral contraceptives are the same as those found for men (n=48) [79]. * p<0.05, **p<0.01 (Wilcoxon test). Because E and A are coeluted on the gas chromatography column, the values are presented as a sum
reductase involved seems to involve isotopic discrimination, resulting in the significant depletion of E [83].
Another excretion study with DHEA showed that the underlying isotopic fractionation does not only depend on a difference between 5α-reductase and 5β-reductase (Fig.6) [83]. In Fig.6theδ13C values of E, A, 5a and 5b excreted as glucuronides after a single dose of 100 mg DHEA administered orally are depicted. The interconversion of 5-ene steroids such as DHEA or 4-ene steroids such as T to the reduced 5α-androstanes (5a, A) and 5β-5α-androstanes (5b, E) is irreversible. Usually it is assumed that 5a is the intermediate in the metabolism to the end product A and 5b is an intermediate on the way to E [69,74,105,
107]. A closer look at the results in Fig.6 reveals a more complicated situation inside the human body. For the 5α steroids, the intermediate 5a is strongly influenced at the beginning and then declines, whereas A is less strongly depleted and then returns to starting values always showing less depleted values. This finding is not contra-dictory to the model with 5a being the intermediate of A formation, as long as the pool of 5a inside the body is small in comparison with that of A, which indeed can be presumed. The different pool size might explain the stronger depletion found for 5a, together with the fact that the enzyme 5α-reductase is found in many different tissues inside the body, rapidly interconverting the administered DHEA and eliminating it through renal excretion.
The outcome of the 5β steroids is completely different. Only the main metabolite E is strongly depleted beyond the δ13
C value of the administered DHEA, whereas the presumed intermediate 5b only shows a weak and slow influence. Thus, 5b cannot be the only intermediate on the metabolic way to E and 5β-reductase does not seem to be solely responsible for the observed isotopic depletion of E
in contrast to DHEA. Otherwise this should be visible for 5b as well. A presumed direct way from DHEA to E is along the route including 5EN17b (Fig. 1), circumventing the formation of 5b. Another hint for the transformation along this route is the relatively depleted CIR of 5EN17b excreted sulfated after application of DHEA [83].
Complications arise when the results of HIR are taken into account [80]. In Fig.7, the HIR and CIR for E, A, 5a, 5b and DHEA of a RefPop encompassing 18 males are plotted against each other. Again, the assumption of a simple relationship between 5α and 5β steroids is not supported by the data. Overall, A shows the most enriched values in both HIR and CIR, whereas 5a shows the most depleted ones and DHEA shows values close to those of A. This does not fit with a direct and singular transformation from DHEA via 5a to A. In the case of 5β steroids, 5b shows values close to those of DHEA, whereas E is slightly more depleted. Here a metabolism of DHEA via 5b to E could be assumed.
As mentioned in the previous subsection, compartmen-talization is a constitutive feature of steroid metabolism. Steroids are mainly produced in the gonads and in the adrenal gland, which again is subdivided into three parts (zona fasciculata, zona reticularis and zona glumerulosa). If we hypothesize that different production sites may produce different isotopic ratios for the steroids formed, this could explain the contradictory results for the DHEA excretion studies. The steady state of steroid flux through the body is strongly disturbed by oral administration of large amounts of steroid. The renal excretion of steroids after oral administration reflects the metabolism in the liver (first path effect), which can explain the differences found between 5α and 5β steroids in a RefPop (undisturbed) and the disturbed steady state after administration. This could recently be demonstrated by a PREG excretion study [110]. After oral ingestion of 100 mg PREG, considerable amounts of PD and
Fig. 6 δ13C values of 5b (grey squares, dashed grey line), 5a (grey triangles, solid grey line), A (open triangles, solid black line) and E (open squares, dashed black line) after oral administration of 100 mg DHEA at 0 h
Fig. 7 δ2H values against theδ13C values of a reference population (RefPop) of n=18 males [80]. Open triangle A, circle DHEA, grey square 5b, open square E, grey triangle 5a. The error bars represent one standard deviation
3-hydroxypregnone (3aP), both metabolites of PREG, were found sulfo-conjugated in urine. Usually, both metabolites are mainly excreted as glucuronides. The normal (undis-turbed) pathway of excretion was disordered, leading to this unusual sulfo-conjugated excretion.
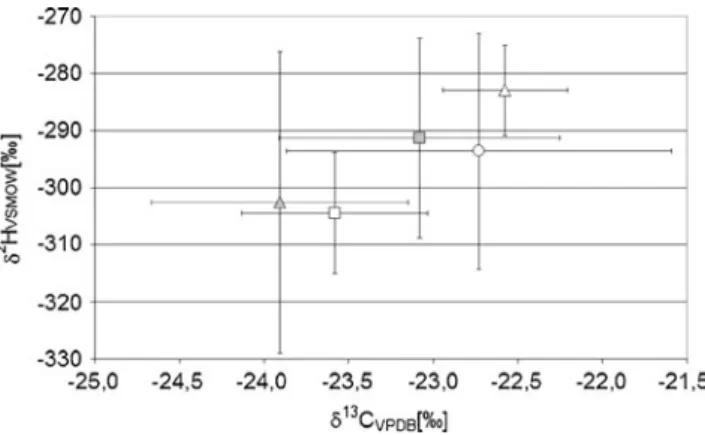
In Fig.8the remaining steroids from the above-mentioned RefPop with n=18 males are depicted [80]. Most of the EpiT is produced in the testes and therefore should reflect the values of this production site. T and 5a are, in addition, derived from adrenal gland and peripheral metabolism, which may explain their shift to more enriched CIR. Corticosteroids such as OHA and 11KETO are only produced in the adrenal gland and reflect the enriched CIR of this production site. Another possible hint for differences in the CIR of production sites may be the significant difference in CIR of DHEA excreted as glucuronide and as the sulfoconjugate (Fig.9). Again DHEA_S, derived from the adrenal gland, shows more enriched CIR than glucuronidated DHEA, derived from both DHEA_S and androgen metabolism.
HIR seem to reflect the ongoing progress of steroid metabolism. Metabolites which undergo little metabolism until excretion such as EpiT or metabolites derived from early stages in metabolism such as PD or 16EN show enriched values, whereas ongoing metabolism seems to introduce depleted hydrogen into the steroid backbone, resulting in more depleted values for later metabolites [80]. This depleted hydrogen is derived from NADPH, which has lowδ2H values. So each introduction of a hydrogen atom into the steroidal backbone is assumed to result in more depletedδ2H values of the complete steroid.
Owing to the limited data presently available, it is not possible to draw a definitive conclusion on the influence of metabolism on HIR and on the different isotope ratios at different production sites. The same holds true for the difference found between glucuronidated and sulfated steroids.
Influence of urine degradation
Recently, the first investigations on the impact of urinary degradation on CIR were completed [84]. In contrast to the common opinion, a strong influence on unconjugated steroids was found especially at the beginning of the degradation process. The metabolite of DHEA_S formed in urine, DCM, showed a very strong influence in its CIR. Owing to the large pool size of glucuronidated steroids in urine, these did not reflect any changes in CIR. This finding is important for doping controls as it supports the use of IRMS of glucuronidated steroids even if samples show early signs of degradation.
Further factors influencing CIR of steroids
Ethnicity as an influencing factor has been investigated several times [55, 56, 76]. Until now, no proof could be given that ethnicity influencesδ13C orΔ values in any way. One study found a significant influence of exercise frequencies on the CIR of different steroids [71], a finding not reflected by subsequent studies [72,79,83].
Method validation in IRMS
The validation of IRMS methods is complicated and depends strongly on the analyte of interest and the sample preparation used. Therefore, here we again focus only on steroid measurements in the context of doping controls. First, several fundamentals of GC/C/IRMS will be dis-cussed, revealing the main pitfalls for valid measurements. Then, the application of these fundamentals to doping control methods as described in the literature will be summarized.
Fig. 9 Box plots of CIR of DHEA excreted glucuronidated (DHEA_G) and sulfo-conjugated (DHEA_S). The RefPop encom-passed n=67 subjects [83]. The difference between the mean values was found to be highly significant with p<0.001 (t test)
Fig. 8 δ2H values against theδ13C values of a RefPop of n=18 males [80]. Open diamond EpiT, black diamond PD, square 16EN, diamond T, open circle DHEA, triangle 5a, black circle OHA, grey circle 11KETO. The error bars represent one standard deviation
Factors influencing GC/C/IRMS determinations
Since its invention, GC/C/IRMS has been investigated to prevent possible sources of problems, which may invalidate the isotope ratio determinations [24,111]. In 1994, the first review on “Factors controlling precision and accuracy…” was published, dealing with problems of non-linearity, necessary sample sizes and instrument drift over time [112]. At the same time, an investigation on possible isotopic fractionation during HPLC fractionation was published [113]. In 1996, a comprehensive investigation of GC parameters such as GC temperature gradient, gas flow or split/splitless injection and their possible influence on CIR was published [114]. As these parameters can change the measured CIR to a small but significant extent, the authors suggested some rules for GC/C/IRMS determinations, and these still hold, such as the use of splitless injections and validating any changes to a method. In 1998, the influence of water background was carefully investigated and demonstrated the necessity of water removal for valid IRMS determinations [115]. One year later, a comprehen-sive review of isotopic fractionation for a variety of chromatographic separations was published [116]. In 2003, Schmitt et al. [117] investigated the extent of the dependency of CIR under different conditions in the split/ splitless injector. To deal with the same issue of linearity, recent careful investigations were performed with parame-ters such as the open split, the GC column and absorption and desorption in the ion source [118]. Some of the proposals from this work, such as the addition of carbon monoxide to reduce effects of non-linearity in the ion source, may be of interest for doping analysis especially for that involving low levels of target analytes.
Referring to all these investigations, there are numerous factors with the potential to affect IRMS measurements. During sample preparation, losses of analyte can be accompanied by isotopic fractionation. For steroids, no fractionation during SPE or LLE has been reported. However, isotopic fractionation during both hydrolysis of conjugates and inappropriate HPLC fractionation can occur [84,113]. The sample transfer on column, the combustion process, the open split and the set-up/condition of the ion source may cause problems.
All these factors have to be under control for valid IRMS measurements. So it is not surprising that, from the beginning, scientists working in the field of sports drug testing have taken care to validate their IRMS methods and to search for factors influencing isotope values.
Approaches for validation of IRMS methods
To achieve good chromatography of all analytes, adequate clean-up during sample preparation is a prerequisite;
therefore, preparation methods have always been compli-cated. The first investigations on possible isotope fraction-ation during SPE were performed in 1999 [50]. One year earlier, HPLC clean-up and chromatographic separation of E and A had been investigated, showing the strong influence HPLC can have on isotopic values by incomplete separation of analytes [119]. In 2000, the validation of an IRMS method was presented, including values for interday and intraday precision and the use of Shewhart charts was introduced to IRMS [52]. The use of these charts has been recommended to monitor method and system stability over time and to reveal possible drifts of the IRMS instrument [19,51,120].
The approaches described so far for validation only cover repeatability and reproducibility but could not show if isotopic fractionation was occurring during sample preparation. Therefore, in 2004, a validation procedure was published using child urine fortified with standards. These fortified urine samples were extracted and the δ13C values obtained were compared with the values of the standards used for fortification [58]. A comparable approach was used to check for isotopic fractionation during sample preparation of steroids not regularly found in urine such NORA and BO or degradation products [65,82,84]. It was possible to show that no significant changes in CIR were introduced by different sample preparation procedures.
A progressive approach was presented in 2008 and applied several times afterwards using linear mixing models to reveal isotopic fractionation during sample preparation [72,79,80,83,84,110]. Repeated fortification of a blank urine sample with defined amounts of steroid standards allows both the detection of possible changes in isotopic values and the repeatability and reproducibility to be tested. Until 2008, only three RefPops had been investigated [52, 56, 62], but then the number of publications on RefPops and population-based reference limits increased considerably [71,72,75,76,79,83]. A RefPop established according to the common rules constitutes an interesting and powerful tool for validation. The rules composing a suitable population have been published by the International Federation of Clinical Chemistry [121–126]. The calculated mean values and their SDs include all potential variations which may occur during sample preparation and measure-ment. The interindividual variances, which accompany biological parameters, are also covered by reference limits derived from a population.
Thus, it is possible to validate a method by establishing population-derived limits as these encompass all the expected variations and include them in the calculated reference limits. Presumably, this approach will be used to distinguish between endogenous or exogenous sources of urinary steroids.
Once established, reference limits can be maintained even after some parts of the method have been changed if the new method is compared with the old one. This has been demonstrated by Saudan et al. [73] using Bland–
Altman plots [127] to estimate the differences between two sample preparation methods. So, it is not always necessary to investigate a new RefPop after some parts of a method have been adopted, as long as the new approach is compared with the former one and no significant difference between both approaches is found.
Another important issue to ensure comparability of measured δ13C values is the calibration of the instrument with continued traceability of experimental values to the international standard VPDB. Different methods of cali-bration are possible; the one mostly supported by isotope chemists is the principal of identical treatment of the standard and the analyte [128]. This means that the standard used for calibration should be chemically similar to the analyte investigated. Several steroids are commer-cially available for this purpose, and since 2009 steroid standards have been prepared especially for doping control laboratories [129].
Conclusion
Since its first introduction to sports drug testing in 1994, GC/C/IRMS and associated sample preparation methods have been carefully improved and laboriously investigated. Most of the approaches affecting doping control analysis have been mentioned and discussed within this article. Especially in recent years, the number of steroids investi-gated has grown considerably, proving the importance of GC/C/IRMS in doping controls.
The first attempts made on hydrogen have been presented but there is ongoing research on this special topic, which may soon lead to improvements for doping control. To elucidate the merit of HIR, reference-based values have to be established and factors influencing HIR of endogenous steroids have to be investigated and identified.
Many known factors influencing the CIR of urinary steroids have been investigated and the impact of these influences on doping control has been studied. Intensive and further research may solve still unanswered questions. As results obtained in sports drug testing always have to be able to be justified at hearings, validation of IRMS methods is emphasised and improved continually. The use of reference-based values to distinguish between endoge-nous and exogeendoge-nous isotope ratios will be a promising approach.
Both isotope ratios of carbon and hydrogen are a highly interesting research field, providing a powerful tool in the
fight against doping, which will presumably be expanded to substances other than steroids soon.
References
1. World Anti-Doping Agency (2009) Laboratory statistics report.
http://www.wada-ama.org/Documents/Science_Medicine/Anti-Doping_Laboratories/Lab_Statistics/ WADA_2009_Laborator-yStatisticsReport_Final.pdf. Accessed 15 Sep 2010
2. World Anti-Doping Agency (2010) The 2010 prohibited list.http:// www.wada-ama.org/Documents/World_Anti-Doping_Program/ WADP-Prohibited-list/WADA_Prohibited_List_2010_EN.pdf. Accessed 15 Sep 2010
3. Donike M, Bärwald KR, Klostermann K, Schänzer W, Zimmermann J (1983) In: Heck H, Hollman W, Liesen H, Rost R (eds) Sport: Leistung und Gesundheit. Deutscher Ärzte Verlag, Cologne
4. Zimmerman J (1986) Untersuchungen zum Nachweis von exoge-nen Gaben von Testosteron. Thesis, Deutsche Sporthochschule Köln, Cologne
5. Mareck U, Geyer H, Opfermann G, Thevis M, Schänzer W (2008) J Mass Spectrom 43:877–891
6. Catlin DH, Hatton CK, Starcevic SH (1997) Clin Chem 43:1280–1288
7. Kicman AT, Gower DB (2003) Ann Clin Biochem 40:321–356 8. Becchi M, Aguilera R, Farizon Y, Flament M-M, Casabianca H,
James P (1994) Rapid Commun Mass Spectrom 8:304–308 9. Aguilera R, Becchi M, Grenot C, Casabianca H, Hatton CK
(1996) J Chromatogr B 687:43–53
10. Aguilera R, Becchi M, Casabianca H, Hatton CK, Catlin DH, Starcevic B, Pope HG Jr (1996) J Mass Spectrom 31:169–176 11. Horning S, Geyer H, Machnik M, Schänzer W, Hilkert A,
Oeßelmann J (1997) In: Schänzer W, Geyer H, Gotzmann A, Mareck-Engelke U (eds) Recent advances in doping analysis, vol 5. Sport und Buch Strauß, Cologne
12. Shackleton CHL, Phillips A, Chang T, Li Y (1997) Steroids 62:379–387
13. Shackleton CHL, Roitman E, Phillips A, Chang T (1997) Steroids 62:665–673
14. Farquhar GD, Ehleringer JR, Hubick KT (1989) Annu Rev Plant Physiol Plant Mol Biol 40:503–537
15. Hayes JM (2001) Rev Mineral Geochem 43:225–277 16. Craig H (1957) Geochim Cosmochim Acta 12:133
17. Ueki M, Okano M (1999) Rapid Commun Mass Spectrom 13:2237–2243
18. de la Torre X, Gonzáles JC, Pichini S, Pascual JA, Segura J (2001) J Pharm Biomed Anal 24:645–650
19. Piper T, Flenker U, Mareck U, Schänzer W (2009) Drug Test Anal 1:65–72
20. Platzner IT (1997) Modern isotope ratio mass spectrometry. Wiley, Chichester
21. Schoeller DA, Hayes JM (1975) Anal Chem 47:408–415 22. Sano M, Yotsui Y, Abe H, Sasaki S (1976) Biol Mass Spectrom
3:1–3
23. Matthews DE, Hayes JM (1978) Anal Chem 50:1465–1473 24. Barrie A, Bricout J, Koziet J (1984) Biol Mass Spectrom
11:583–588
25. Brand WA (1996) J Mass Spectrom 31:225–235
26. Brenna JT, Corso TN, Tobias HJ, Caimi RJ (1997) Mass Spectrom Rev 16:227–258
27. Meier-Augenstein W (1999) J Chromatogr A 842:351–371 28. Sessions AL (2006) J Sep Sci 29:1946–1961
29. Merritt DA, Freeman KH, Ricci MP, Studley SA, Hayes JM (1995) Anal Chem 67:2461–2473
30. Goodmann KJ (1999) Anal Chem 70:833–837
31. Rogerson J, Trout GJ (1999) In: Schänzer W, Geyer H, Gotzmann A, Mareck-Engelke U (eds) Recent advances in doping analysis, vol 7. Sport und Buch Strauß, Cologne, pp 223–232 32. Flenker U, Hebestreit M, Piper T, Hülsemann F, Schänzer W
(2007) Anal Chem 79:4162–4168
33. Sacks GL, Zhang Y, Brenna JT (2007) Anal Chem 79:6348– 6358
34. Santrock J, Studley AS, Hayes JM (1985) Anal Chem 57:1444– 1448
35. Goodmann KJ, Brenna JT (1994) Anal Chem 66:1294–1301 36. Ricci MP, Merritt A, Freeman KH, Hayes JM (1994) Org
Geochem 21:561–571
37. Brooks CJW, Horning EC, Young JS (1968) Lipids 3:391–402 38. Donike M, Zimmermann J (1980) J Chromatogr A 202:483–486 39. Guo ZK, Luke AH, Lee WP, Schoeller D (1993) J Mass
Spectrom 31:225–235
40. Shinebarger SR, Haisch M, Matthews DE (2002) Anal Chem 74:6244–6251
41. Tobias HJ, Brenna JT (1997) Anal Chem 69:3148–3152 42. Burgoyne TW, Hayes JM (1998) Anal Chem 70:5136–5141 43. Scrimgeour CM, Begley IS, Thomason ML (1999) Rapid
Commun Mass Spectrom 13:271–274
44. Hilkert AW, Douthitt CB, Schlüter HJ, Brandt WA (1999) Rapid Commun Mass Spectrom 13:1226–1230
45. Hall JA, Barth JAC, Kalin RM (1999) Rapid Commun Mass Spectrom 13:1231–1236
46. Férézou J, Coste T, Chevallier F (1981) Digestion 21:232–243 47. Mendelsohn D, Immelman AR, Vogel JC (1986) von La
Chevallerie G. Biomed Environ Mass Spectrom 13:21–24 48. Bosner MS, Ostlund RE, Osofisan O, Grosklos J, Fritschle C,
Lange LG (1993) J Lipid Res 34:1047–1053
49. Ostlund RE, Matthews DE (1993) J Lipid Res 34:1825–1831 50. Aguilera R, Catlin DH, Becchi M, Phillips A, Wang C,
Swerdloff RS, Pope HG, Hatton CK (1999) J Chromatogr B 727:95–105
51. Flenker U, Nolteernsting E, Geyer H, Schänzer W (1999) In: Schänzer W, Geyer H, Gotzmann A, Mareck-Engelke U (eds) Recent advances in doping analysis, vol 7. Sport und Buch Strauß, Cologne, pp 241–247
52. Aguilera R, Chapman TE, Catlin DH (2000) Rapid Commun Mass Spectrom 14:2294–2299
53. Ferry M, Mathurin JC, Becchi M, De Ceaurriz J (2000) In: Schänzer W, Geyer H, Gotzmann A, Mareck-Engelke U (eds) Recent advances in doping analysis, vol 8. Sport und Buch Strauß, Cologne, pp 209–213
54. Bourgogne E, Herrou V, Mathurin JC, Becchi M, De Ceaurriz J (2000) Rapid Commun Mass Spectrom 14:2343–2347 55. Aguilera R, Chapman TE, Starcevic B, Hatton CK, Catlin DH
(2001) Clin Chem 47:292–300
56. Aguilera R, Hatton CK, Catlin DH (2002) Clin Chem 48:629– 636
57. Maître A, Saudan C, Mangin P, Saugy M (2004) J Anal Toxicol 28:426–431
58. Saudan C, Baume N, Mangin P, Saugy M (2004) J Chromatogr B 810:157–164
59. Cawley AT, Hine ER, Trout GJ, George AV, Kazlauskas R (2004) Forensic Sci Int 143:103–114
60. Güntner U, Flenker U, Ayotte C, Ueki M, Schänzer W (2004) In: Schänzer W, Geyer H, Gotzmann A, Mareck-Engelke U (eds) Recent advances in doping analysis, vol 12. Sport und Buch Strauß, Cologne, pp 251–259
61. Wang J, Wu M, Zhang Y, Liu X, Zhang H (2004) In: Schänzer W, Geyer H, Gotzmann A, Mareck-Engelke U (eds) Recent
advances in doping analysis, vol 12. Sport und Buch Strauß, Cologne, pp 241–250
62. Cawley AT, Kazlauskas R, Trout GJ, Rogerson JH, George AV (2005) J Chromatogr Sci 43:32–38
63. Saudan C, Desmarchelier A, Sottas PE, Mangin P, Saugy M (2005) Steroids 70:179–183
64. Sephton MA, Meredith W, Sun CG, Snape CE (2005) Rapid Commun Mass Spectrom 19:3339–3342
65. Hebestreit M, Flenker U, Fußhöller G, Geyer H, Güntner U, Mareck U, Piper T, Thevis M, Ayotte C, Schänzer W (2006) Analyst 131:1021–1026
66. Baume N, Saudan C, Desmarchelier A, Strahm E, Sottas PE, Bagutti C, Cauderay M, Schumacher YO, Mangin P, Saugy M (2006) Steroids 71:364–370
67. Flenker U, von Kuk C, Güntner U, Hülsemann F, Gougoulidids V, Schänzer W (2005) In: Schänzer W, Geyer H, Gotzmann A, Mareck-Engelke U (eds) Recent advances in doping analysis, vol 13. Sport und Buch Strauß, Cologne, pp 227–233
68. Saudan C, Kamber M, Barbati G, Robinson N, Desmarchelier A, Mangin P, Saugy M (2006) J Chromatogr B 831:324–327 69. Mareck U, Geyer H, Flenker U, Piper T, Thevis M, Schänzer W
(2007) Eur J Mass Spectrom 13:419–426
70. Cawley AT, Trout GJ, Kazlauskas R, George AV (2008) Rapid Commun Mass Spectrom 22:4147–4157
71. Flenker U, Güntner U, Schänzer W (2008) Steroids 73:408–416 72. Piper T, Mareck U, Geyer H, Flenker U, Thevis M, Platen P, Schänzer W (2008) Rapid Commun Mass Spectrom 22:2161–2175 73. Saudan C, Emery C, Marclay F, Strahm E, Mangin P, Saugy M
(2009) J Chromatogr B 877:2321–2329
74. Green G, Aguilera R, Ahrens B, Starcevic B, Kurtzman F, Su J, Catlin D (2009) Clin J Sport Med 19:287–292
75. Strahm E, Emery C, Saugy M, Dvorak J, Saudan C (2009) Br J Sports Med 43:1041–1044
76. Cawley AT, Trout GJ, Kazlauskas R, Howe CJ, George AV (2009) Steroids 74:379–392
77. Brooker L, Parr MK, Cawley A, Flenker U, Howe C, Kazlauskas R, Schänzer W, George A (2009) Drug Test Anal 1:587–595 78. Buisson C, Mongongu C, Frelat C, Jean-Baptiste M, de Ceaurriz
J (2009) Steroids 74:393–397
79. Piper T, Riemann P, Opfermann G, Mareck U, Geyer H, Vajiala G, Flenker U, Schänzer W (2009) Drug Test Anal 1:576–586 80. Piper T, Thevis M, Flenker U, Schänzer W (2009) Rapid
Commun Mass Spectrom 23:1917–1926
81. Cawley A, Collins M, Kazlauskas R, Handelsman DJ, Heywood R, Longworth M, Arenas-Queralt A (2010) Drug Test Anal 11– 12:557–567
82. Piper T, Geyer H, Gougoulidids V, Flenker U, Schänzer W (2010) Drug Test Anal 2:217–224
83. Piper T, Opfermann G, Thevis M, Schänzer W (2010) Rapid Commun Mass Spectrom 24:3171–3181
84. Piper T, Geyer H, Schänzer W (2010) Drug Test Anal 11– 12:620–629
85. Cawley A, Flenker U (2008) J Mass Spectrom 43:854–864 86. Saudan C, Saugy M (2010) In: Gross ML, Caprioli RM (eds) The
encyclopedia of mass spectrometry, vol 5. Elemental and isotope ratio mass spectrometry. Elsevier, Amsterdam, pp 977–990 87. Smith BN, Epstein S (1970) Plant Physiol 46:738–742 88. Sessions AL, Burgoyne TW, Schimmelmann A, Hayes JM
(1999) Org Geochem 30:1193–1200 89. Schoell M (1984) Org Geochem 6:345–663
90. Schmidt HL, Werner RA, Eisenreich W (2003) Phytochem Rev 2:61–85
91. Bowen G. Purdue University, IN, USA. http://www.wateriso topes.org. Accessed 9 Oct 2010)
92. Schoeller DA (1999) J Archaeol Sci 26:667–673
94. Tobias HJ, Brenna JT (1996) Anal Chem 68:2281–2286 95. Sessions AL, Burgoyne TW, Hayes JM (2001) Anal Chem
73:192–199
96. Sessions AL, Burgoyne TW, Hayes JM (2001) Anal Chem 73:200–207
97. Bilke S, Mosandl A (2002) Rapid Commun Mass Spectrom 16:468–472
98. Duff RE, Bauer SH (1962) J Chem Phys 36:1754–1767 99. Armbruster W, Lehnert K, Vetter W (2006) Anal Bioanal Chem
384:237–243
100. DeNiro MJ, Epstein S (1976) Geol Soc Am Abs Prog 8:834–835 101. DeNiro MJ, Epstein S (1978) Geochim Cosmochim Acta
42:495–506
102. Schoeller DA, Klein PD, Watkins JB, Heim T, MacLean WC Jr (1980) J Am Clin Nutr 33:2375–1385
103. Nakamura K, Schoeller DA, Winkler FJ, Schmidt HL (1982) Biomed Mass Spectrom 9:390–394
104. Mareck-Engelke U, Flenker U, Schänzer W (1996) In: Schänzer W, Geyer H, Gotzmann A, Mareck-Engelke U (eds) Recent advances in doping analysis, vol 3. Sport und Buch Strauß, Cologne, pp 143–157 105. Träger L (1977) Steroidhormone. Springer, Berlin
106. Miller WL (1988) Endocr Rev 9:295–318
107. Milgrom E (1990) In: Baulieu EE, Kelly PA (eds) Hormones: from molecules to disease. Hermann, Paris, pp 385–435 108. Michal G (1999) Biochemical pathways. Spektrum, Heidelberg 109. Payne AH, Hales DB (2004) Endocrine Rev 25:947–970 110. Piper T, Schlug C, Mareck U, Schänzer W (2011) Drug Test
Anal (in press)
111. Matthews DE, Hayes JM (1976) Anal Chem 48:1375–1382 112. Merritt DA, Hayes JM (1994) Anal Chem 66:2336–2347 113. Braunsdorf R, Hener U, Przibilla G, Piecha S, Mosandl A (1993)
Z Lebensm Unters Forsch 197:24–28
114. Meier-Augenstein W, Watt PW, Langhans CD (1996) J Chroma-togr A 752:233–241
115. Leckrone KJ, Hayes JM (1998) Anal Chem 70:2737–2744 116. Filer CN (1999) J Labelled Comp Radiopharm 42:169–197 117. Schmitt J, Glaser B, Zech W (2003) Rapid Commun Mass
Spectrom 17:970–977
118. Elsig J, Leuenberger MC (2010) Rapid Commun Mass Spectrom 24:1419–1430
119. Flenker U, Horning S, Nolteernsting E, Geyer H, Schänzer W (1998) In: Schänzer W, Geyer H, Gotzmann A, Mareck-Engelke U (eds) Recent advances in doping analysis, vol 6. Sport und Buch Strauß, Cologne, pp 243–256
120. Westgard JO, Barry PL, Hunt MR (1981) Clin Chem 27:483– 501
121. IFCC (1987) J Clin Chem Clin Biochem 25:337–342 122. IFCC (1987) J Clin Chem Clin Biochem 25:639–644 123. IFCC (1987) J Clin Chem Clin Biochem 25:645–656 124. IFCC (1987) J Clin Chem Clin Biochem 25:657–662 125. IFCC (1988) J Clin Chem Clin Biochem 26:593–598 126. IFCC (1991) Eur J Clin Chem Clin Biochem 29:531–535 127. Bland JM, Altman DG (1986) Lancet 327:307–310
128. Werner RA, Brand WA (2001) Rapid Commun Mass Spectrom 15:501–519


![Fig. 8 δ 2 H values against the δ 13 C values of a RefPop of n=18 males [80]. Open diamond EpiT, black diamond PD, square 16EN, diamond T, open circle DHEA, triangle 5a, black circle OHA, grey circle 11KETO](https://thumb-eu.123doks.com/thumbv2/123doknet/14844624.626720/11.892.77.430.786.997/values-values-refpop-diamond-diamond-square-diamond-triangle.webp)
