J. Ornithol. 141,441-460 (2000)
© Deutsche Ornithologen-Gesellschafl/Blackwell Wisserlschafts-Verlag, Berlin ISSN 0021-8375
Body mass of six long-distance migrant passerine species
along the autumn migration route
Michael Schaub 1' 2, 3 and Lukas Jenni 1 ISchweizerische Vogelwarte, CH-6204 Sempach, Schweiz
2Zoologisches Institut Universitfit Ztirich, Winterthurerstr. 190, CH-8057 Ztirich, Schweiz (3Corresponding author: Email: michael.schaub@vogelwarte.ch)
S u m m a r y
We analysed body mass and moult data of six passerine species along their autumn migra- tion route from northern Europe to North Africa and derived hypothetical models of the organisation of their migration in terms of fuel store accumulation. We analysed data of 46,541 first-year birds from 34 trapping sites, sampled in a network of collaborating Euro- pean and African ringing stations. After accounting for effects of time of day and size, there were marked differences between the six species examined in the change of body mass along the migration route and in the timing of moult. Garden Warblers
(Sylvia borin)
and Pied Flycatchers
(Ficedula hypoleuca)
underwent their postjuvenile moult prior to mi- gration and increased their average body mass along the migration route. Sedge Warblers(Acrocephalus schoenobaenus)
also increased body mass towards the south, but started themigration bout without further refuelling well before the Sahara and moulted mainly in the wintering grounds, Reed Warblers
(Acrocephalus scircpaceus)
and Whitethroats(Sylvia
communis)
migrated while still moulting and did not increase average body mass towardssouth. They accumulated the energy needed to fly over the Sahara just before it. Spotted Flycatchers
(Muscicapa striata)
behaved in the same way, but contrary to Reed Warblers and Whitethroats they did not accumulate much fat stores in North Africa, which might urge them to stop and fuel up regularly in the Sahara. In the course of the season average body mass of all species increased slightly, which enabled them to migrate faster. In gener- al, average body mass of first-year birds in northern and central Europe during the migra- tion period was comparable to that of adults during breeding.Key words: Passerines, body mass, migration route, migration strategy, moult
Z u s a m m e n f a s s u n g
K6rpermassen von sechs Arten von Langstreckenziehern entlang des Herbstzugweges Wir analysierten KOrpermassen- und Mauser-
daten von sechs Singvogelarten auf dem Herbstzug entlang ihres Zugweges von Nor- deuropa bis Nordafrika. Die KOrpermassen von 46541 diesjfihrigen VOgeln, die auf 34 Beringungsstationen im Rahmen eines interna- tionalen Projektes gesammelt wurden, sind die Grundlage dieser Untersuchung. Neben der
Entwicklung der K(irpermassen entlang des Zugweges untersuchten wir den Einfluss der Mauser, des Fangdatums, der Tageszeit und der K0rpergr~ige anf die K0rpermasse. Man- sernde VOgel waren schwerer als nichtman- sernde mit der gleichen Fettmenge. Die KOrpermasse nahm im Laufe der Saison und im Verlauf des Tages zu. Grol3e VOgel (mit el-
442 Journal ftir Ornithologie 141, 2000
ner lfingeren 8. Handschwinge) waren schwe- rer als kleine. Gartengrasmticken
(Sylvia bor-
in)
und Trauerschnfipper( Ficedula hypoleuca)
wurden entlang des Zugweges kontinuierlich schwerer. Beide Arten machten die Jugendteil- manser haupts~ichlich noch im Brutgebiet durch. Schilfrohrsgnger(Acrocephalus schoe-
nobaenus)
wurden nach Stiden ebenfalls etwas schwerer, aber sie begannen mit einem Rei- seabschnitt ohne weiteren Fettaufbau schon in Mitteleuropa und mauserten ihr Kleingefieder haupts~ichlich erst in Afrika. Die KiSrper- massen von Teichrohrs~gern(Acrocephalus
scirpaceus)
und Dorngrasmticken(Sylvia com-
munis)
blieben nach Stiden weitgehend kon- stant. Beide Arten lagerten die n/3tigen Energiereserven zum Oberfliegen der Sahara erst kurz davor an. Sie trennten Jugendteilmau- ser und Zug nicht vollst~indig. ~dmlich verhiel- ten sich Grauschn/ipper(Muscicapa striata),
doch im Gegensatz zu den zwei vorherigen Ar- ten, wurden sie auch im Mittelmeergebiet nicht wesentlich fetter. Sie scheinen daher regelm~is- sig in der Wtiste zu rasten und zu fressen.Introduction
Within the European-African bird migration system, birds face two large ecological bar- tiers, the Mediterranean Sea and the Sahara de- sert. Both offer very few opportunities for refuelling (oases, islands) over a large distance. Therefore birds should have accumulated en- ough energy before starting to cross these bar- riers. Many birds seem to circumfly the Mediterranean Sea via the Iberian peninsula or via the Middle East (Bruderer & Liechti 1999) and, therefore, do not need much extra fuel for crossing this barrier. The Sahara desert, how- ever, cannot be avoided and birds should carry enough energy stores for a 2000 km flight without refuelling (but possibly with stopover; Bairlein 1985, Biebach et al. 1986). There are two main ways to accumulate the energy stores needed: (a) on the way to the northern desert edge, which would require that birds accumu- late at each stopover place more energy than
they use for the next flight bout, or (b) at one site before the desert. In the former case one would expect an increase in body mass along the migration route, but not in the latter case.
The main aim of this paper was to investigate whether the body mass of six long-distance migrant passerine species (Reed Warbler
Acro-
cephaIus scirpaceus,
Sedge WarblerA. schoe-
nobaenus,
Garden WarblerSylvia borin,
Whitettu'oat S.communis,
Pied FlycatcherFi-
cedula hypoleuca,
Spotted FlycatcherMusci-
capa striata)
changes along their autumn migration route and to derive conclusions about the organisation of their journey. We pre- sent theoretical considerations about how much and where fuel could be accumulated and used along the migration route from the breeding grounds to the southern border of the Sahara. A further aim was to identify whether body mass increased in the course of the au- tumn migration season. The speed of migra- tion, calculated from the total distance migrated and the total time used including stopovers, is often higher later in the season (Ellegren 1993), which is achieved if birds can manage longer flight bouts. This requires lar- ger amounts of stored fuel, and hence higher body mass later in the season. Other variables likely to influence body mass, such as time of capture, body size and year, were also included in the analysis.Juvenile feathers have a frail texture and are replaced shortly after fledging. Most juvenile birds therefore undergo a partial moult in an early phase of life (Jenni & Winkler 1994). Since moult (Murphy 1996) and the deposition of fat are energy demanding, the two phases cannot operate at maximum intensity when performed simultaneously. Timing of and en- ergy allocation to either phase has to be opti- raised and embedded within the annual life cycles of the birds. Therefore, the timing of moult is likely to have a direct influence on the migration strategy. We investigated the conse- quences of timing of moult on body mass de- velopment along the migration route.
M. Schaub & L. Jenni • Body mass during migration 443 Methods
Trapping sites and species
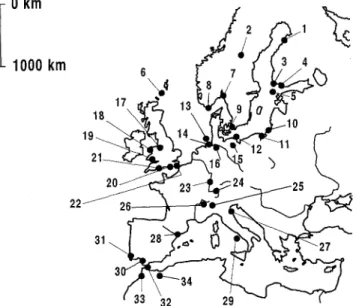
The ringing data of six species captured at 34 sites were analysed (Table 1, Fig. 1): Reed Warbler, Sedge Warbler, Garden Warbler, Whitethroat, Pied Flycatcher and Spotted Flycatcher. All species con- sidered breed over large areas in Europe and winter in Africa south of the Sahara. The trapping sites were distributed over 30.7 ° of latitude along the mi- gration route from northern Europe to North Africa. Their locations were classified as coast, island or mainland. The data were collected 1994- 1996 in a joint project of ringing stations within the European
Science Foundation Network (Bairlein 1997).
Data collection
At all ringing stations, the following data were col- lected for each bird in a standardised way (Bairlein 1995): date and time of capture (to the nearest h), age (after Svensson 1992 and Jenni & Winkler 1994), feather-length of primary 8 (to the nearest 0.5 ram, Jenni & Winkler 1989), body mass (0.1 g), fat score (9 levels, Kaiser 1993) and a score for moult intensity of body feathers (0: no body feather growing, 1: between 1 and 20 body feathers grow- ing, 2: more than 20 body feathers growing). Time of capture was defined as the time elapsed since lo- cal sunrise, calculated with procedure 'daylength' in
GENSTAT 5.3.2 (Payne et al. 1993) and used for all analyses.
To test whether the species considered moult dur- ing autumn migration, we analysed data from noc- turnal captures at Col de Bretolet, a Swiss Alpine pass, collected over 12 autumn migration seasons in the years 1980-1996. Because this trapping site is not a stopover site for these species (Jenni 1984) and because only birds caught out of nocturnal migra- tion were included, this dataset consists only of ac- tively migrating birds.
Data selection
All analyses refer to first captures of first-year birds, because very few adults were caught at many sites. As most trapping sites were also breeding places for the species investigated, a mixture of locally born and migrating birds was often present. The interest of this study was in migrating individuals and these could not be separated individually from local birds not yet on migration. With the following data selec- tion, we excluded most, but probably not all, locally born birds not yet on migration. The later in the sea- son the birds are caught the more likely they are to be actually on migration. Therefore we defined for each species and each site a threshold date (Table 1), after which the birds were considered to be mi- grants, and only those were included in the analysis. This threshold date was determined based on the on-
I
0 km
1000 km
( a
1
Fig. 1. Geographical distribution of the 34 ringing sites where birds were captured for this study. Numbers refer to Table 1. Abb. 1. Lage der 34 Fangorte. Die Nummern entsprechen den- jenigen in Tab. 1.
444
Journal fiir Omithologie 141, 2000o ~
.~, -~
~ o ~ . ~
~ . ~ . ~~ ~.~ ~
g o
~ " O . ~ ~ a oN =
~
~
~ ~
rq8 ~
o o
. ~
o ~
8
°
o ~ ot5
•
0~
~~,~<
¢xl t"q ¢-,I A A A A " ,--.i , A .~ ¢ q c q A A 0"3 ¢ q t'xl ¢¢~ t-¢3 A A A A ¢xlg
~ N
I .'z A A A A A A da ~b ~h t"q e ~ ("q~2
~2
~
~ 4
4 4
A A A A A A "N "N'N ~ " " ~ ' ~ o o. . .
~
~
~
A A A A A~ = = s g s
Z " ~ ~ ~-~k.9 oz O ~ ¢~ ~ o ~ o eq 6 q ~ d ~ ~ ,,b 6; dd 6q ~ .U 6-i 6q 4f , - , ,.-.~ ,--* ,--* ¢-,I t"q t'N ¢xl CqM. Schaub & L. Jenni • Body mass during migration 445 O ,...,
7
& /X A o6 i O ¢ q ,< I ~b <7
e q & i < c ~ /x i , < -< A A~ = ~
tt'3 & i i "~ A t"q A t'q A A ¢'1 Ig3 O O t",l O "'" O {'~/ t"q c q t'~ ~"r5 t'¢/ ¢¢3 {'e~set of migration at trapping sites where the species does not breed and based on litera- ture about the onset of migration (Cramp 1992, 1993, Glutz von Blotzheim & Bauer 1991, 1993). With these restrictions, a total number of 20,408 Reed Warblers, 10,133 Sedge Warblers, 8551 Garden Warblers, 1995 Whitethroats, 3742 Pied and 1712 Spotted Flycatchers were available for anal- ysis. As we intended to evaluate the influ- ence of moult on body mass we included moulting and non-moulting individuals.
Statistical analysis
First, we analysed, for each species sepa- rately, the effects of six variables on the body mass of the individual birds with a type I analysis of covariance. Thus, the ef- fect of a variable is evaluated only after ad- justment for the ones entered previously. We first entered (and adjusted for) the varia- bles time of capture and its square (in order to model a non-linear curve), length of pri- mary 8 and moult intensity, before testing for differences between sites. Hence, effects of sites are independent of time of capture, size of bird and moult intensity. Then, ef- fects of date and year as well as interactions between site and other variables were eval- uated. Because of the large sample sizes, al- most all variables revealed statistical signif- icance at a low alpha level (0.001), though their effect may not be biologically relevant (Yoccoz 1991). Therefore, we considered how much of the total variability was ex- plained by each variable (partial r2).
Birds from northern and eastern popula- tions often have longer and more pointed wings than those of southern and western populations (Klein et al. 1973). Because of their longer migration, they may carry more fuel stores for their size than birds from southern and western populations, and hence may show a disproportionally high body mass. As a result, the adjustment of body mass according to the length of pri- mary 8 with one single slope for all popula- tions taken together might lead to overesti- mations of the effect of size on body mass. If such an effect is present, we would expect to find a correlation between the site-specif-
446 Journal ffir Omithologie 141, 2000 ic slopes of body mass on size and latitude or longi-
tude. We derived the site-specific slopes of body mass on size from a model with body mass as the dependent variable and time of capture, its square, moult intensity, length of primary 8, site and the in- teraction length of primary 8 x site as independent variables. With one exception (Sedge Warbler: lati- tude, r = 0.488, p = 0.03; longitude, r = 0.378, p = 0.10; n = 20), all correlations between the site-spe- cific slopes of body mass on length of primary 8 and longitude or latitude were not significant (all p > 0.09). This indicates that there was no geographical change in the slopes of body mass on size along the north-south or the east-west axis and that the use of a single slope for all sites for the adjustment of body mass on size introduced no bias, except possibly in the Sedge Warbler. Size-independent body mass of this species is likely to be higher in the south and lower in the north than reported here.
Secondly, we tested whether mean values of body mass per site were correlated with their geographic position (latitude, longitude and location). For this, we first adjusted the body mass values of all birds with respect to the time of capture, its square and size (length of primary 8). The estimates for these adjustments were derived from a linear model with body mass as dependent and time of capture, its square and length of primary 8 as independent vari- ables. From the adjusted body mass values, we cal- culated the site specific means. They became the dependent variable in another analysis of covariance with location (coast, island or mainland), longitude, latitude and the interaction longitude x latitude as independent variables. All sites were given the same weight. All statistical analyses were performed with GENSTAT 5.3.2 (Payne et al. 1993).
Results
Effects of time of capture, length of primary 8, moult, date, year and site
The models explained between 29.5 %
(Spotted Flycatcher) and 39.2 % (Reed War- bler) of the total body mass variability (Table 2). Not all variables had the same expla- nation power in all species. Variables that ac- counted on average for more than 2.5 % of total variation were time of capture, length o f primary 8, moult and site.
T i m e of capture and its square together were important sources of variation. Except in the Reed Warbler, the square of time o f capture had only a marginal influence, indicating that body mass increase over the day could be ap- proximated linearly. The average body mass increases per hour (derived from a linear m o d e l with body mass as dependent variable and time of capture, its square and length of primary 8 as independent variables, calculated over a 12 h period) were 0.053 g + 0.009 s.e. (Sedge Warb- ler), 0.074 g + 0.019 (Garden Warbler), 0.102 g + 0.028 (Whitethroat), 0.043 g _+ 0.008 (Pied Flycatcher) and 0.067 g + 0.017 (Spotted Fly- catcher). In the Reed Warbler, the increase was m u c h lower (0.003 gh -1 _+ 0.006 s.e.). This low increase most likely had no biological reasons, but was due to a peculiar distribution of the capture times: most Reed Warblers were caught in the hours around sunrise.
The length of primary 8, as a correlate of body size, was an important source of variation for body mass in the Garden Warbler and even more so in the Sedge Warbler. Larger birds were heavier by 0.157 g + 0.006 s.e. (Reed Warbler), 0.206 g + 0.006 (Sedge Warbler), 0.271 g _+ 0.012 (Garden Warbler), 0.119 g _+ 0.019 (Whitethroat), 0.112 g + 0.011 (Pied Fly- catcher) and 0.109 g + 0.014 (Spotted Fly- catcher) per m m of length of primary 8. These estimates were obtained from the same m o d e l as above.
The moult of body feathers affected body mass particularly in Reed Warbler and White- throat (Table 2), and m u c h less in the other spe- cies. Moulting birds were lighter. The effect of moult was similar at all sites because the site x moult interaction explained m u c h less varia- tion than the main effect of moult. N e w t o n (1968) and Chilgren (1977) found that moult- ing birds are heavier than non-moulting birds because of a higher water content. In this study we found the opposite, but this discrepancy can be attributed to the fact that non-moulting birds often had higher fat scores, which in turn in- creased body mass (Table 3). This was espe- cially pronounced for the species with the
M. Schaub & L. Jenni - Body mass during migration 447 ce ",'~ 2 ~ o ~ ' ~ N ~ 2 ~ ~ "~ .'~ ~
~o .~o.~
L ~6 © 3: q~z
~ ¢¢3 .~- t¢3 ,~- ~'~ ¢Q M3 kl~ tt~ t¢3 tt'/ tt3 u~ ~5 e4 e,i ,4 ~ ~ e4 ~5 ~ o ,4 ~ tt~ ,...~ O t-~ ¢ ~ tt-i ¢¢3 ,--~ ,--~ ,~- ~ ¢e3 tt'l ¢¢3 ¢¢3 " 4 d ,--: d ',6 £ ,'-: ~ ,'d ¢'i d , ' ; " 4 ~ " ~ "~t" t"- ¢'q OO C~ r--- t'q tin "~" ~ ~', , A 6 M , - - ; d d d d d ~ d ~ t'Z ,.-~: ~ ~ x X x x x ~~
~ ~ - ~
largest proportion of moulting
birds, Reed Warbler and
Whitethroat. Intensely moult- ing birds (moult score 2) with fat score 1 were heavier (Reed Warbler by 0.23 g + 0.04 s.e., Whitethroat 0.47 g + 0.12, Gar- den Warbler 0.75 g + 0.09, Pied Flycatcher 0.28 g + 0.07) than non-moulting conspecifics with fat score 1 (all p < 0.001). This showed that moulting birds with low fat stores were indeed
heavier than non-moulting
conspecifics with the same fat score. However, moulting Spotted Flycatchers with fat score 1 had a similar body mass to non-moulting ones (F2, 5ss = 0.1, p = 0.877), and moulting Sedge Warblers with fat score 1 were lighter (0.26 g _+ 0.06) than non-moulting conspecifics (Fro 2196 = 11.6, p < 0.001).
After adjustment for time of capture, its square, size and moult, body mass differed be- tween sites in all species, but the amount of variability ex- plained by site varied consider- ably between species. Body mass varied substantially be- tween sites in Garden Warbler and Pied Flycatcher, but only little in Spotted Flycatcher (Ta- ble 2).
Date and the interaction date x site was another source of body mass value variation. The
interaction term often ac-
counted for more variation than date alone. Hence the change in body mass in the course of the season was not equal at the sites. We estimated the average change in body mass per day for each site with a model con-
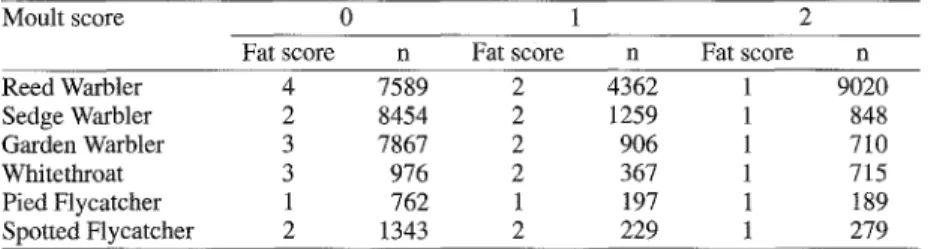
448 Journal f~ir Ornithologie 141, 2000 Table 3. Median fat scores of the 3 moult intensity classes (n = sample size). Moult scores: 0 - 2 (non-moult- ing to heavily moulting, see methods), fat scores: 1 - 4 (very little fat to furcular depression filled with fat, according to Kaiser 1993).
Tab. 3. Mediane der Fettklassen f~ir die 3 Mauserklassen (n = Stichprobengrrge). Mauserklassen: 0 - 2 (nicht mausernd his stark mausernd; siehe Methoden), Fettklassen 1 - 4 (sehr wenig Fett bis Vertiefung zwi- schen den Gabelbeinen mit Fett geffillt; nach Kaiser 1993).
Moult score 0 1 2
Fat score n Fat score n Fat score n
Reed Warbler 4 7589 2 4362 1 9020 Sedge Warbler 2 8454 2 1259 1 848 Garden Warbler 3 7867 2 906 1 710 Whitethroat 3 976 2 367 1 715 Pied Flycatcher 1 762 1 197 1 189 Spotted Flycatcher 2 1343 2 229 1 279
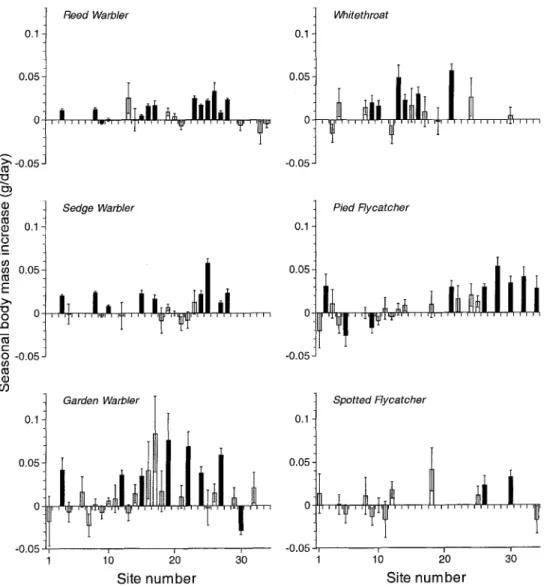
taining body mass as dependent variable and time of capture, its square, length of primary 8, moult, site, date and the date x site interaction as independent variables (Fig. 2). Although the standard errors of the estimates were often quite large, the seasonal changes at several sites were significantly different from zero. Where this was the case, the birds were heavier later in the season in 42 out of 46 species-site combinations. The seasonal increase in body mass of Pied Flycatchers was higher at the southern sites than at northern sites (F1,20 = 25.l, p < 0.001, r; = 53.4), whereas there was no geographical trend for the other species. The average seasonal body mass increases over all sites were 0.010 gday -a + 0.001 (Reed War- bler), 0.012 gday -a -+ 0.001 (Sedge Warbler), 0.010 gday -1 _+ 0.002 (Garden Warbler), 0.019 gday -~ _+ 0.003 (Whitethroat), 0.013 gday I _+ 0.002 (Pied Flycatcher) and 0.011 gday -1 _+ 0.003 (Spotted Flycatcher) when estimated with a linear model with body mass as depend- ent and time of capture, its square, length of primary 8, moult and date as independent vari- ables. Over a migration period of two months, all species were less than l g heavier at the end of the season, except the Whitethroat (1.14 g).
Body mass also differed between years, most especially in the Spotted Flycatcher. Since the interaction year x site explained a larger pro- portion of body mass variability than year alone, differences in body mass between years were not parallel at all sites. The largest differ-
ences in average body mass between the three years were found for Reed Warblers in the Coto de Dofiana (1.15 g), for Sedge Warblers in the Ebro Delta (2.57 g), for Garden Warblers at Mierzeja Wislana (3.82 g), for Whitethroats on Helgoland (2.03 g), for Pied Flycatchers on Oldeoog (2.81 g) and for Spotted Flycatchers at Mierzeja Wislana (2.61 g). These estimates were derived from the maximal models (Table 2).
From the maximal models, we estimated site-specific average body mass at sunrise of non-moulting birds in 1994 by inserting site- specific average values of date and length of primary 8 (Table 4). Hence, these values were not corrected for size and date, but for moult, year and time of capture. It appeared that aver- age body mass of first-year birds during au- tumn migration did not differ from than that of adults during the breeding season at most sites (body mass during the breeding season: Reed Warbler 1 2 . 0 - 1 3 . 0 g , Sedge Warbler 11.7- 13.4 g, Garden Warbler 17.8-19.8 g, White- throat 13.9- 15.8 g, Pied Flycatcher 11.0- 14.9 g, Spotted Flycatcher 14.8-16.2 g; Glutz von Blotzheim & Bauer 1991, 1993).
Moult of body feathers during migration The proportion of moulting birds (Table 5) de- pends both on the proportion of locally born birds not yet on migration (which generally moult body feathers) and of birds moulting on migration; hence the latter proportion is diffi-
M. Schaub & L. Jenni • Body mass during migration 449
cult to determine. However, sites with no or very few moulting birds indicate that migrating birds are not moulting. Direct information on the proportion of moulting birds on migration is provided by birds caught during night mi- gration at the Alpine pass Col de Bretolet (Table 5). There, a considerable proportion of actively migrating Reed Warblers, White- throats and Spotted Flycatchers were still moulting, whereas the proportion of moulting Garden Warblers and Pied Flycatchers was much lowe~ With this in mind, the following conclusions can be drawn.
The Pied Flycatcher migrated through wes- tern and central Europe usually after comple- tion of moult. This also applied to western and central European birds which were rarely caught during moult. Similarly, Garden War- blers generally started migration after moult or at the end of moult, as indicated by low propor- tions of moulting birds at Col de Bretolet and in southern Europe. Sedge Warblers usually delayed the postjuvenile moult until arrival in sub-Saharan Africa and only completed the ju- venile plumage (Redfern & Alker 1996). In contrast, Whitethroats often seemed to extend moult into the first leg of migration up to cen- tral Europe with an appreciable proportion of moulting night migrants at Col de Bretolet. By the time they arrived in southern Europe, moult had apparently finished. Reed Warblers often moulted during migration, as also found in Bel- gium ( 2 6 - 8 2 %, Herremans 1990), but it re- mains unclear whether the high percentage of moulting birds in southern Europe is due to lo- cally born or migrating birds. The Spotted Fly- catcher also often migrated while moulting, showing the highest proportion of moulting in- dividuals at Col de Bretolet of all species. However, it remains unclear why there was such a low proportion of moulting Spotted Fly- catchers in Britain.
Body mass change along the migration route In order to test average body mass for geogra- phical trends between sites, we estimated mean body mass at each site accounting for the time
of capture and the length of primary 8. In con- trast to the values given in Table 4, these mean values were corrected for size and the time of capture, but not for moult, date and year.
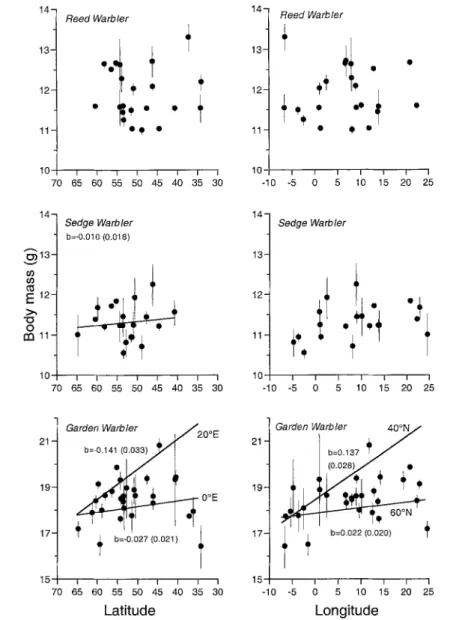
Mean size-corrected body mass increased significantly towards the south in four species, but not in Reed Warbler and Spotted Flycatcher (Fig. 3, Table 6). The slope for the Sedge War- bler was quite flat (0.10 g +_ 0.18 s.e. per 10 ° of latitude) and the total increase in body mass from the northernmost to the southernmost site of this study was only 0.24 g. Mean body mass increased more markedly along the north-south axis in Pied Flycatcher (0.41 g +_ 0.12 per 10 ° of latitude; 1.26 g over the entire range) and in Whitethroat (0.44 g _+ 0.23 per t0 ° of latitude; 1.07 g over the entire range). Garden Warblers increased in body mass towards the south, but also towards the east. Furthermore, the in- crease along the north-south axis was larger in eastern Europe than in western Europe, as indi- cated by the significant interaction term lati- tude x longitude (Table 6). For example, the increase in mean body mass was 0.27 g _+ 0.21 per 10 ° of latitude at 0 ° E, while it was 1.41 g +_ 0.33 per 10 ° of latitude at 20 ° E (Fig. 3). For the other species there was no east-west gra- dient in average body mass (Table 6). Average body mass did not differ significantly between coastal, island and mainland sites. However, location was just significant in the Pied Fly- catcher (heaviest on coasts, 0.32 g lighter on is- lands and 0.08 g lighter on the mainland).
Discussion
Limits of interpretation
The way the data have been collected results in two main limitations in interpretation. First, the variation in mean body mass along the mi- gration axis does not necessarily reflect the change in body mass of an average individual during its migration. All species considered in this study breed over wide areas of Europe. Therefore, the potential recruiting area of the birds caught at a given site increases along the migration route: towards the south, pro-
450 Journal fiJr Ornithologie 14I, 2000 0.1 0.05 ~>" -0.05 Reed Warbler
, ,. i T.ii,+,,, liii,,i
. . . " . . . .1
. . . tp . . . ? ' ' 'l'+'I
Sedge Warbler ffl 0 ¢ -i
0.05 Ei
i
i i
!i ,i
• .<, 0 0 "'I
+ . . . , t T . . . i,+,,,~,,p ... c - O -0.05 if) co Garden Warbler oi,I i i
I
~ ' ~'",'"~ . . . . ' . . . I ... t . . .
-o.o5
1'o
~o
3'o
S i t e n u m b e r Whitethroet 0,1
o
o I ~ii
i,li! i i
~ ... ~
. . . i i i i i i i J i t i~l i i~l i ~ ~ i - 0 . 0 5 0.1 0.05 -0.05 Pied Flycatcher,,,~!, ,!,~,,+ ...
0.1 0.05 -0.05 Spotted Flycatcher,,t, 1 .... ~,I' I ...
... ti .... i .... T
1;
2o
3;
S i t e n u m b e rFig.
2. Average body mass increase during the season for each species and site. The site numbers refer to Table 1. Lines represent standard error. Open bars: no significant body mass change during the season, black bars: significant body mass change during the season (p < 0.05). Sites with less than 20 captures were omitted. 'Abb. 2. Durchschnittliche saisonale K6rpermassen~nderung (g/Tag) ftir alle Arten und Fangorte. Die Num- mern sind identisch mit denjenigen in Tab. 1. Die Linien bezeichnen den Standardfehler. Weige S~iulen: keine signifikante ,~nderung wfihrend der Saison. Schwarze S~ulen: signifikante Anderung w~hrend der Sai- son (p < 0.05). Fangorte mit weniger als 20 F~inglingen wurden weggelassen.
gressively m o r e southern populations are a d d e d to the samples, b u t possibly also popu- lations w i t h a m o r e w e s t e r n or eastern origin w h e n m i g r a t i o n routes c o n v e r g e (e.g. towards Iberia). Hence, it is likely that an increase in
m e a n b o d y m a s s along the m i g r a t i o n route o f a n o r t h e r n p o p u l a t i o n was u n d e r e s t i m a t e d with our data, b e c a u s e p r o g r e s s i v e l y m o r e southern individuals w i t h p r o b a b l y l o w e r b o d y mass m i x in. O n the other hand, popula-
M. Schaub & L. Jenni - Body mass during migration 451 Table 4. Mean body mass (standard error) of non-moulting birds in 1994 at sunrise with site specific average length of primary 8 and median date of passage, estimated from the models presented in Table 2.* calculated for 1995, as no data were available for 1994.
Tab. 4. Mittlere K6rpermasse (Standardfehler) von nicht-mausemden V6geln im Jahre 1994 bei Sonnenauf- gang. Diese Werte wurden mit den in Tabelle 2 aufgeftthrten Modellen geschfitzt unter Berticksichtigung der ortsspezifischen mittleren Langen der 8. Handschwinge und des Durchzugsmedians.* ftir 1995 errech- net, da ftir 1994 keine Daten vorlagen.
Site Reed Sedge Garden Whitethroat Pied Spotted
Warbler Warbler Warbler Flycatcher Flycatcher
1: Tauvo (SF) - 10.6 (0.68)* 17.6 (0.82) - 12.2 (1.15)* 15.3 (0.70)* 2: Annsj6n (S) - - 18.7 (2.50) - 12.6 (0.60) - 3: Rauvola(SF) 12.5 (0.12) 11.8 (0.05) 18.7 (0.37) 15.0 (0.44) 12.9 (0.46) 13.8 (0.98) 4: Hanko (SF) - 11.2 (0.28) 19.0 (0.24) 14.9 (0.67) 12.0 (0.22) 15.2 (0.33) 5: Jurrno (SF) . . . . 11.7 (0.20) 14.9 (0.29) 6: Fair Isle (GB) - - 18.8 (1.57) - - - 7: Jomfruland (N) - - 20.4 (1.58) 14.1 (0.94)* 13.1 (0.99)* - 8: Lista (N) 12.3 (0.06) 10.8 (0.06) 18.9 (0.19) 14.8 (0.32) 12.1 (0.20) 14.6 (0.58) 9: Falsterbo (S) 12.4 (0.03) 11.5 (0.04) 18.5 (0.21) 14.7 (0.26) 11.8 (0.15) 14.3 (0.22) 10: Rybachy (RU) 12.6 (0.08) 11.7 (0.06) 19.5 (0.13) 15.1 (0.24) 12.1 (0.11) 15.1 (0.25) 11: MierzejaWislana - - 17.5 (1.54) 14.3 (1.16)* 11.7 (1.03) 16.1 (0.41)* (PO) 12: Greifwalder Oie (D) 11.8 (0.71) 11.6 (0.26)* 18.4 (0.16)* 15.0 (0.24)* 12.1 (0.08)* 15.4 (0.20)* 13: Helgoland (D) 11.8 (0.83) - 18.9 (0.33) 14.9 (0.60) 12.4 (0.27) 14.8 (1.74)* 14: Oldeoog (D) 12.5 (0.35) - 19.3 (0.23) 15.8 (0.28) 12.0 (0.15) 13.3 (1.42) 15: Galenbecker See (D) 11.5 (0.13) 11.5 (0.19) 18.1 (0.37) 14.0 (0.61)* 11.8 (0.68) - 16: Reit (D) 12.1 (0.13) 10.9 (0.85) 17.9 (1.09) 15.3 (0.34) - - 17: Woolston (GB) 11.2 (0.30) 10.4 (0.17) 19.4 (0.89) 13.4 (0.66) - - 18: Bardsey (GB) - 10.1 (0.75) 18.4 (0.82) 14.1 (1.73) 12.2 (0.41) 13.8 (0.92) 19: Kenfig (GB) 11.9 (0.24) 11.2 (0.16) 18.4 (1.54) 13.7 (0.54) - - 20: Stodmarsh (GB) 11.8 (0.12) 9.4 (1.18) . . . . 21: Dungeness (GB) 12.3 (0.21) 10.8 (0.23)* 18.8 (1.55) 15.8 (0.26) 12.7 (0.60) - 22: Portland (GB) - 11.7 (0.26) 18.2 (0.55) 15.4 (0.60) 12.3 (0.32) 13.7 (1.17) 23: Mtinchhausen (F) 12.5 (0.62) 10.6 (0.41)* . . . . 24: Mettnau (D) 11.8 (0.08) 11.2 (0.29) 19.0 (0.32) 13.5 (1.36) 12.8 (0.85) 14.9 (0.99) 25: Bolle di Magadino 12.3 (0.08) 11.7 (0.23) 19.2 (0.46) - 12.7 (0.19) 14.9 (0.33) (CH) 26: C o l d e Bretolet (CH) 12.2 (0.23) - 18.8 (0.22) 16.1 (0.58) 12.2 (0.07) 14.8 (0.34) 27: Campotto (I) 11.0 (0.10) 11.1 (0.08) 22.0 (0.23) - 14.4 (0.40) 17.3 (0.58) 28: Ebro Delta (ES) 11.4 (0.10) 12.4 (0.22)* 21.1 (1.94) 13.5 (0.84)* 15.3 (0.58) -
29: Capri (I) - - 19.6 (0.19) - - -
30: Coto de Dofiana (ES) 12.8 (0.18) - 17.1 (0.14) 14.0 (0.30) 12.3 (0.12) 14.1 (0.32)
31: A Rocha (P) - - - 19.0 (1.26)* - -
32: Gibraltar (GI) - - 18.8 (1.69) 12.8 (0.95)* 13.1 (0.25)* -
33: Bou Rhaba (MO) 11.9 (0.21) - 17.1 (1.39) - 11.9 (0.42) -
34: M o u l a y a ( M O ) 11.3 (0.12) - - - 13.4 (0.31) 17.2 (0.83) t i o n s w i t h m i g r a t i o n r o u t e s d i v e r g i n g f r o m o r o v e r f l y i n g t h e sites s a m p l e d m a y n o t b e re- p r e s e n t e d a n y m o r e . I n o u r data, this p r o b a b l y w a s t h e c a s e in e a s t e r n p o p u l a t i o n s o f S e d g e W a r b l e r s , G a r d e n W a r b l e r s , W h i t e t h r o a t s a n d S p o t t e d F l y c a t c h e r s w h i c h m i g r a t e t o w a r d s s o u t h - e a s t e r n E u r o p e ( Z i n k 1973, 1981) w h e r e n o sites w e r e s a m p l e d . H o w e v e r , f o r t h e s e f o u r s p e c i e s t h e p o p u l a t i o n s w e s t o f 1 0 ° E m i g r a t e a l o n g a n o r t h - e a s t e r n - s o u t h - w e s t e r n axis w h i c h g e n e r a l l y c o i n c i d e s w i t h t h e m a i n axis o f sites (Fig. 1). O n a f i n e r scale, d i f f e r e n t p o p u l a t i o n s m a y h a v e e v o l v e d d i f f e r e n t m i g r a t i o n s t r a t e g i e s w i t h r e s p e c t to
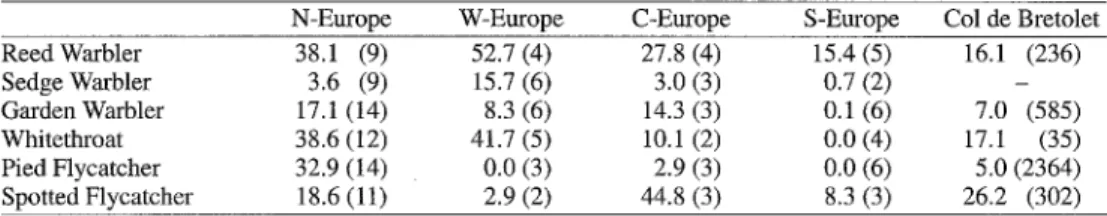
452 Journal for Ornithologie 141, 2000 Table 5. Percentage of moulting birds (moult score 2) in Northern Europe (sites north of 53.5°N), Western Europe (sites on the British Isles), Central Europe (between 49.0°N and 46.2°N), southern Europe (south of 46.2°N), and on the Alpine pass Col de Bretolet. Mean values were calculated from the site-specific propor- tions of moulting birds (number of sites in parentheses), except for the Col de Bretolet for which the percen- tage of moulting individuals (number of individuals in parentheses) caught during nocturnal migration is given.
Tab. 5. Prozentualer Anteil mansernder V6gel (Mauserldasse 2) in Nordeuropa (Fangorte n6rdlich von 53.5°N), Westeuropa (Fangorte anf den Britischen Inseln), Zentraleuropa (Fangorte zwischen 49.0°N und 46.2°N) und Stideuropa (Fangorte stidlich 46.2°N). Die Werte wurden berechnet als Mittelwerte des ortsspe- zifischen Anteils (Anzahl Fangorte in Klammern), ausser f'tir den Col de Bretolet, ftir den der Anteil man- sernder Individuen (Anzahl Fgnglinge in Klammern) auf dem Nachtzug angegeben ist.
N-Europe W-Europe C - E u r o p e S-Europe Col de Bretolet
Reed Warbler 38.1 (9) 52.7 (4) 27.8 (4) 15.4 (5) 16.1 (236) Sedge Warbler 3.6 (9) 15.7 (6) 3.0 (3) 0.7 (2) - Garden Warbler 17.1 (14) 8.3 (6) 14.3 (3) 0.1 (6) 7.0 (585) Whitethroat 38.6 (12) 41.7 (5) 10.1 (2) 0.0 (4) 17.1 (35) Pied Flycatcher 32.9 (14) 0.0 (3) 2.9 (3) 0.0 (6) 5.0 (2364) Spotted Flycatcher 18.6 (11) 2.9 (2) 44.8 (3) 8.3 (3) 26.2 (302)
where and when to fatten up. Since we can- not distinguish between different populations, the geographic body mass changes of single populations may be masked. Furthermore, territorial birds (e.g. Pied Flycatchers in Spain, Bibby & Green 1980; Reed Warblers in Sweden, Walinder et al. unpubl, data) are possibly less likely to be caught than non-ter- ritorial (subordinates, new arrivals) conspeci- fics and, hence, the samples may be biased towards lower body mass values. A prerequi- site for the accurate interpretation of geogra- phical patterns in body mass along the migration route is also that the average qual- ity of the sites sampled is similar along the migration route, e.g. that the location has no effect on body mass. We cannot evaluate the quality of the sites, but mean body mass was not significantly different between the loca- tions (island, coast, mainland). Hence, latitu- dinal or longitudinal effects were therefore not masked or caused by the location of the sites.
Secondly, because body mass generally in- creases during stopover, our analysis should ideally be based on body mass either at arrival or at departure from each site. But our analysis was performed with body mass data of birds
captured for the first time at a site. Most of those birds are not captured just after arrival, but on average several days later (Schaub et al. in press). Body mass recorded in our samples is dependent not only on body mass at arrival, but also on fuel deposition rate at the site and on the time the birds have spent at the site before first capture. However, stopover duration esti- mated at several sites along the migration route for Reed, Sedge and Garden Warblers was quite similar between sites and usually the first capture of an individual occurred in the middle of the stopover period (Schaub & Jenni in prep.). Fuel deposition rates of a species varied between sites, but only those of the Reed War- bler increased along the migration route (Schaub & Jenni 2000). If the analysis had been made with body masses at departure, we would not expect to find markedly different results from those presented here for Sedge and Garden Warbler, but probably a slight increase of average body mass towards the south for the Reed Warbler. In summary, there are more reasons to suppose that the body mass data ana- lysed here underestimated, rather than overes- timated, an increase in the body mass of individual birds along the migration route.
M. Schaub & L. Jenni. Body mass during migration
453
14- 13- 12- 11- Reed Warbler+
I
.:!
• + g o •10
L
70 65 6; 55 50 4; 40 35 3;
14-
Reed Warbler+
13-
~
•
12-
~J'
+ ' , "
" ~
11
• O •10
I
i
I
/
i
II
-10 -5 0
5 10 15 20 25
14-
Sedge Warblerb=-O.010 (0.018)
"~13-
v
E 12-
-
11-
10
i
~
i
70 65 60 5; 56 ~ 4; ~ 30
14-
13.
12.
11.
Sedge Warbleri + .
+.
10'
'
'
' 0 '
'
;
-10 -5 6
5 1 15 20 2
21 t
Garden Warbler.1. /
20°E
21.
b=-0.141 (0.033)/~/" I
19]
~
~
O°E
19'
15171
+ b=-0.027 (0.021)
~
17'
7 0 & 6 0 & s o 4 ' 6 2 0 3 ; 3 0
Latitude
Garden Warbler
40ON
l
+,
~ - ~ ' - ~ ?
I~ O 60°N+
b=0.022
(0.020)
+
'~
-10 -5 0
. . . .
5 10 1 2 25
; ' 0 '
Longitude
Fig. 3. Mean standardised body mass (dots) with 95 % confidence interval (lines) for each species and each site plotted against longitude and latitude. Standardisations were calculated with respect to time of capture and length of primary 8. If the relationship between body mass and latitude or longitude, respectively, was significant (see Table 6), the regression line is drawn and the slope (b) and its s.e. is shown. For the Garden Warbler, two regression lines are given in order to depict the effect of the interaction between latitude and longitude.
Abb. 3. Mittlere standardisierte K6rpermasse (nach Fangzeit und L~inge der 8. Handschwinge) und 95 % Vertranensintervall aller Arten und Fangorte anfgetragen gegen L~ingen- und Breitengrad der Fangorte. War die Beziehung zwischen K6rpermasse und Langen- oder Breitengrad signifikant (siehe Tabelle 6), so ist die Regressionsgerade eingezeichnet sowie die Steigung (b) und deren Standardfehler angegeben. Ftir die Gar- tengrasmticke wurden je zwei Regressionsgeraden eingezeichnet, um die Interkation zwischen Lfingen- und Breitengrad zu verdeutlichen.
454 Journal ftir Ornithologie 141, 2000 18- 16' 14" Whitethroat b=-0.044 (0.023) 12 70
6; 6; 5; 5;
454;
353;
16-
133
v
14- ¢.f) E23 12-
O
m
Pied Flycatcher b=-0.041 (0.012) 1 0 i i70 6; 6; 5;
504; 4; 3; 30
1 7 - 15' Spotted Flycatcher+
l
, 370 6 60 55
; ' ' ~'045 4 35 3
' o ' '0Latitude
Fig. 3, (continued) Abb. 3. (Fortsetzung) 18- 16 14'+ t ~
12
i -10 -5 16- 14- 12- 10 i -10 -5 17- 15 ¸ Whitethroat I I I o ~1; 1; 2o 2~
Pied Flycatcher++
i i l i i i 0 5 10 15 20 25 Spotted Flycatcher 13 -10 -5,, ,+,+
. . . . ' 0 ; 0 5 10 15 2 2Longitude
Effects of time of capture, size, date and year Regressing the time of capture on the body mass at first capture can give an indication of body mass increase of individual birds within a day. As pointed out earlier, most Reed War- blers were caught during the first hours after
sunrise, which resulted in an unreliable esti- mate of daily body mass increase, but this has only small effects on the adjustment of body mass on the time of capture. Estimates of body mass increase during the day from individual birds can be obtained from retraps. The weighted average increase obtained from the
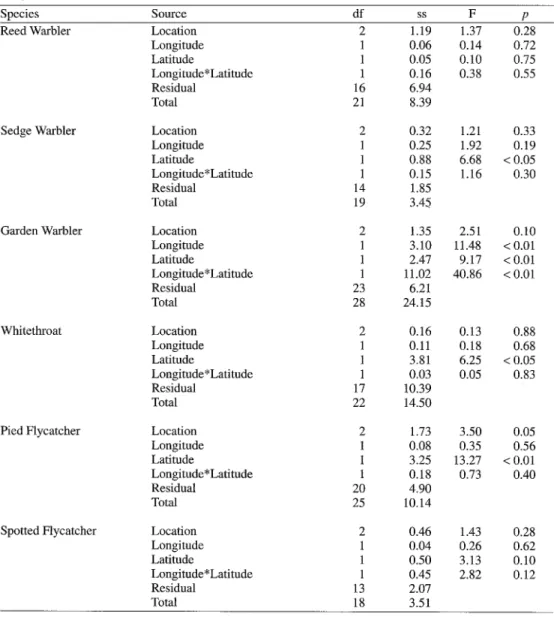
M. Schaub & L. Jenni • Body mass during migration 455 Table 6. Effects of longitude, latitude and location (island, coast, mainland) on adjusted (with respect to time of capture and length of primary 8) site-specific mean body mass values (ANCOVA).
Tab. 6. Effekt yon L~ingen- und Breitengrad, sowie vonder Lage des Fangortes (Insel, Ktiste, Inland) auf standardisierte (nach Fangzeit und L~inge der 8. Handschwinge) ortsspezifische K6rpermassen (Kovarianz- analyse).
Species Source df ss F p
Reed Warbler Location 2 1.19 1.37 0.28
Longitude 1 0.06 0.14 0.72
Latitude 1 0.05 0.10 0.75
Longitude*Latitude 1 0.16 0.38 0.55
Residual 16 6.94
Total 21 8.39
Sedge Warbler Location 2 0.32 1.21 0.33
Longitude 1 0.25 1.92 0.19
Latitude 1 0.88 6.68 < 0.05
Longitude*Latitude 1 0.15 1.16 0.30
Residual 14 1.85
Total 19 3.45
Garden Warbler Location 2 1.35 2.51 0.10
Longitude 1 3.10 11.48 < 0.01 Latitude 1 2.47 9.17 < 0.01 Longitude*Latitude 1 11.02 40.86 < 0.01 Residual 23 6.21 Total 28 24.15 Whitethroat Location 2 0.16 0.13 0.88 Longitude 1 0.11 0.18 0.68 Latitude 1 3.81 6.25 < 0.05 Longitude*Latitude 1 0.03 0.05 0.83 Residual 17 10.39 Total 22 14.50
Pied Flycatcher Location 2 1.73 3.50 0.05
Longitude 1 0.08 0.35 0.56
Latitude 1 3.25 13.27 < 0.01
Longitude*Latitude 1 0.18 0.73 0.40
Residual 20 4.90
Total 25 10.14
Spotted Flycatcher Location 2 0.46 1.43 0.28
Longitude 1 0.04 0.26 0.62
Latitude 1 0.50 3.13 0.10
Longitude*Latitude 1 0.45 2.82 0.12
Residual 13 2.07
Total 18 3.51
retraps of some of the sites combined was 0.061 gh -1 (Reed Warbler), 0.065 gh -1 (Sedge Warbler) and 0.079 gh -1 (Garden Warbler) (from Schaub & Jenni 2000). Hence, the esti- mates obtained in the present study were simi- lar to the values derived f r o m retraps of Sedge and Garden Warblers.
The speed of migration increases in the course of the season (Ellegren 1993, Fransson 1995), which is possible if the fuel deposition rates increase, as found by Schaub and Jenni (2000). The speed increase could then either be achieved by seasonally decreasing stopover durations but maintaining constant lengths of
456 Journal fttr Ornithologie 141, 2000
flight bouts or by constant stopover durations but seasonally increasing lengths of flight bouts. In the former case, departure body mass would remain constant during the season, whereas in the latter case it would increase. Our findings suggest the latter. However, the seasonal body mass increase was quite small, and possibly the seasonal increase in migration speed is achieved by a combination of season- ally decreasing stopover duration and season- ally increasing lengths of flight bouts. The seasonal body mass increase was higher at southern sites in the Pied Flycatcher. This pat- tern is likely to occur if birds increase body mass along the migration route and if migration speed increases in the course of the season.
There are many possible reasons for varia- tion in mean body mass between years. Food availability might change between years, weather might influence the decision of when to land or to embark, which affects the sample caught, and migration of different populations might be delayed or might follow a slightly dif- ferent route in different years. Since yearly mean body mass did not vary in the same direc- tion at all sites, it is not likely that factors gov- erning body mass on a large scale are in operation, such as large-scale weather situa- tions during migration or a generally late breeding season.
At most sites the average body mass of first- year non-moulting birds as predicted by the models (Table 4) were not higher than the body mass reported during breeding. Although the average values reported here might be biased downwards (see above) the species studied show on average no marked general increase in body mass over much of their migration leg in Europe. Nevertheless, birds during the migra- tion season might have more energy reserves than during the breeding season because the body composition might have changed. Furthermore, the body masses reported here are those at first capture. The departure body mass can be much higher depending on stop- over duration after capture and fuel deposition rate at the particular site.
Body mass variation between sites and timing of moult
Moult was one of the major factors affecting body mass (Table 2). Moult may energetically or physiologically compete with migration and the accumulation of energy stores (Lindstrrm et al. 1994). Therefore, the seasonal timing of moult in relation to migration may influence the pattern of energy accumulation and, hence, body mass along the migration route.
Sedge Warbler, Garden Warbler and Pied Flycatcher separate moult and migration al- most entirely (Table 5). Garden Warbler and Pied Flycatcher moult prior to migration (Jenni & WinNer 1994), whereas Sedge Warblers de- lay moult until they arrive in the wintering quarters (Redfern & Alker 1996).
Sedge Warblers only slightly increased body mass along the migration route. Individuals which have accumulated large energy stores usually start a non-refuelling flight from as far back as western and central Europe or the northern Mediterranean region to sub-Saharan Africa (Bibby & Green 1981). Therefore, the only birds are likely to be caught are those which have not attained the level of body mass required for embarking on such long flights. The body mass of Pied Flycatchers remained constant over northern and central Europe and increased rapidly south of 45 ° N (south of the Alps).
As shown earlier by Bairlein (1991), the body mass of Garden Warblers during autumn migration increased from the breeding grounds in Europe to North Africa, i.e. along the north- east - south-west migration axis. Compared with Bairlein's (1991) data, our estimates were lower for both east of 10 ° E (1.1 versus 1.7 g/ 10 °latitude) and west of 10°E (0.0 versus 1.0 g/10 ° latitude; analysed in the same way as in Bairlein 1991). The three southernmost sites sampled in our study (all west of 10 ° E) pro- vided particularly low body mass values (Fig. 2) and, if omitted, there is a significant in- crease of 0.8 g/10 ° latitude for the remaining sites west of 10 ° E. These three sites (Coto de Dofiana, Gibraltar and Capri) were also in-
M. Schaub & L. Jenni - Body mass during migration 457
cluded by Bairlein (1991), but he found aver- age body masses at least 2 g higher than in our study. It is not known why body mass collected during the three study years was so low at these three sites; the fact that B airlein (1991 ) also in- cluded adult birds with generally slightly high- er body mass and that he did not adjust body mass according to size and time of capture can only explain part of the difference. Bairlein (1991) had data available from more sites in SW-Europe which showed high average body mass. Despite these discrepancies, both studies found basically the same pattern, i.e. a more pronounced increase in body mass in eastern than in western birds. Western populations of Garden Warblers which migrate towards the Iberian peninsula have to cross only a small stretch of the Mediterranean Sea, find suitable stopover areas in North Africa and cross the western part of the Sahara with more oases and a shorter extension than those further east. In contrast, Garden Warblers migrating more to the east have to cross the Mediterranean Sea, find less suitable stopover sites in North Africa and cross the most inhospitable part of the Sa- hara (Biebach et al. 1986). Hence, the latter need larger energy stores.
Reed Warbler, Spotted Flycatcher and Whitethroat are in still moult at the onset of mi- gration (Table 5; see also Herremans 1990 for Reed Warbler, Norman 1990 for Whitethroat). Reed Warbler and Spotted Flycatcher did not increase body mass along the migration route, and this was also true when only non-moulting birds were considered. In Whitethroats, body mass increase towards the south was signifi- cant, but not when only non-moulting birds were considered. Since the proportion of moulting Whitethroats decreased from north to south and because moulting birds were lighter than non-moulting birds, the observed body mass increase towards the south was mainly due to a decrease in the proportion of moulting birds.
In conclusion, the timing of moult appears to have profound effects on energy accumulation and body mass along the migration route. The
fuel deposition rate of moulting birds is re- duced (Schaub & Jenni 2000) which allows only a migration in short hops. Indeed, the mi- gration speed of species moulting during mi- gration in northern and central Europe is lower than that of the next related species not moult- ing during migration: in Sedge Warblers migra- tion speed is higher than in Reed Warblers (Bensch & Nielsen 1999), in Garden Warblers it is higher than in Whitethroats (Fransson 1995, Ellegen 1993), and in Pied Flycatchers it is higher than in Spotted Flycatchers (Hildrn & Saurola 1982). When moult is completed (or suspended) somewhere on the migration route, fuel deposition rate (Reed Warblers; Schaub & Jenni 2000) or body mass (Whitethroats) in- creases. In species which do not moult during migration, the accumulated energy at stopover places can be used entirely for migration which allows birds to build up more energy stores than are necessary to reach the next stopover sites. This makes the birds independent of high quality stopover sites before large ecological barriers nor do they need to stop for a long time at these sites.
Migration strategies
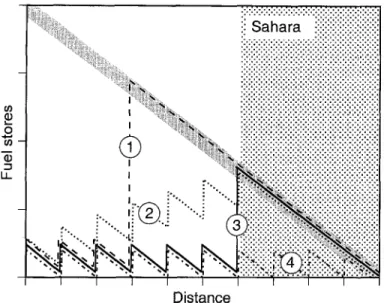
From the findings of this and earlier studies, four theoretical strategies about where and how much to fuel up emerge (Fig. 4). Birds may already start to accumulate large fuel stores well before the northern edge of the Sa- hara (e.g. at the first high-quality site encoun- tered) and fly to sub-Saharan Africa without refuelling (strategy 1). This strategy is adopted by western populations of the Sedge Warblers (Bibby & Green 1981, Schaub & Jenni 2000) and possibly also by some individuals of other species. A few individuals of all species exam- ined were very heavy and fat. The highest body mass of single birds north of the Alps exceeded the average mass of their conspecifics by 33 % (Spotted Flycatcher) to 78 % (Sedge Warbler; highest body mass: 20.0 g for Reed Warbler, 20.2 g for Sedge Warbler, 28.8 g for Garden Warbler, 21.8 g for Whitethroat, 19.4 g for Pied Flycatcher, 19.9g for Spotted Flycatcher).
Journal ftir Ornithologie 141, 2000 ffJ o 19 " I Ii 458
Distance
Fig. 4. Possible strategies for the migration from the breeding grounds in Europe to sub-Saharan Africa in terms of fuel stores. The diagonal grey bar-line indicates the fuel load needed for flying to the southern border of the Sahara without refuelling. The different strategies are: (1) start of non-refuelling migration well before the Sahara; (2) steadily increasing fuel load along the migration route; (3) large fuel deposition just before the Sahara; (4) refuelling in the Sahara (strippled area). Note that the relationship between fuel store and dis- tance should be slightly curved, but is drawn as a straight line for the sake of simplicity.
Abb. 4. MOgliche Strategien ffir den Zug von den Brntgebieten zu den Oberwintersgebieten sfidlich der Sahara dargestellt als Beziehung zwischen Energiereserven und Distanz. Der diagonale graue Balken zeigt an, wieviel Energie nrtig w~e, um das Ziel ohne weiteres Auftanken zu erreichen. Die unterschiedlichen Strategien sind: (1) Beginn eines Fluges ohne weiteren Fettaufbau schon weir vor der Nordgrenze der Saha- ra; (2) Kontinuierliche Zunahme der Energiereserven entlang des Zugweges; (3) Energiereserven bleiben entlang des Zugweges konstant, erst kurz vor der Sahara werden sie markant gesteigert; (4) Energiereserven bleiben immer gleich, was Rast und Fettaufbau in der Sahara bedingt. Der Einfachheit halber wurde die Be- ziehung zwischen Energiereserven und Distanz linear dargestellt, in Wirklichkeit ist sie leicht konkav ge- krfimmt.
These individuals might have reached sub-Sa- haran Africa with a non-refuelling flight.
Another strategy (2 in Fig. 4) is to accumu- late more energy during each stopover than is needed to fly to the next one. This results in a steady increase of body mass towards the south. In contrast to strategy 3, this avoids the accumulation of large energy stores in the southern Mediterranean region. Garden War- blers and Pied Flycatchers are likely to have adopted such a strategy. Fuel deposition rates derived from retraps (Schaub & Jenni 2000) and stopover durations (Schaub & Jenni in prep.) of Garden Warblers at sites just before the Sahara were not higher than those reported
from north and central European stopover sites, which confirms that they do not rely entirely on stopover sites just before the desert. Be- cause eastern populations have to cover a long- er distance across inhospitable area (see above), they gain larger fat stores than western populations.
With strategy 3, birds would just accumulate at each stopover site the amount of energy which is needed to fly safely to the next one. As the distance over the Sahara is longer than a one-night flight bout over continental Europe, birds are urged to fuel-up extensively just be- fore reaching this barrier. This strategy prob- ably involves finding high-quality stopover
M. Schaub & L. Jenni • Body mass during migration 459 sites in the southern Mediterranean region.
Hence, a high body mass is probably often at- tained a t specific places and only a few days before departure and, hence, is not easily de- tected. Reed Warblers and perhaps also White- throats adopt this strategy. Fuel deposition rates of Reed Warblers derived from retraps in- creased towards the south and were highest in Northern Morocco (Schaub & Jenni 2000), which is in good accordance with strategy 3. However, our data do not reflect these postu- lated high body masses before crossing the Sa- hara because the sites sampled for this study were probably not the best refueling places for each species and because we reported body mass at first capture and not body mass at de- parture.
The last strategy (4) is again to accumulate at each stopover site just the amount of energy needed to fly safely to the next one. But in con- trast to strategy 3, refuelling sites in the Sahara are used and hence no extensive fuel-up just before the Sahara is necessary. M a n y passerine long-distance migrants have been found refuel- ling in oases (e.g. Bairlein 1985, Biebach et al. 1986, Bairlein 1992, Biebach 1995,), but it is not clear whether this is the result of an evolved strategy or whether the observed birds origin- ally pursued another strategy but failed to carry it through. For example they might have in- tended to fly without refuelling over the Sahara but failed because they had not accumulated enough fuel before the Sahara. There are indi- cations that Spotted Flycatchers adopt such a strategy but they m a y not rely entirely on oases. Spotted Flycatchers can be seen hunting insects in the middle of the desert (Bairlein
1992, pers. obs.), probably hoverflies
Syrphi-
dae,
which also migrate (Garter & Schmid 1990). The average fat score of Spotted Fly- catcher (1.95) is lower than that of the other species (Reed Warbler 2.59; Sedge Warbler 2.35; Garden Warbler 2.83; Whitethroat 2.59; Pied Flycatcher 2.15) and it did not increase to- wards the south. Spotted Flycatchers did not accumulate much energy before the Sahara which might urge them to refuel from time totime in the desert. The body masses of Spotted Flycatchers captured in oases and in the desert are about the same or slightly higher than the ones from Europe and they have only little fat stores on average (Moreau 1969, Bairlein et al. 1983, Bairlein 1985, Bairlein 1992). Other bird species that stop in the desert outside oases nor- mally do not refuel (Bairlein 1985, Biebach et al. 1986) and are not included in strategy 4.
Assigning one of the four migration strate- gies to each of the six species is to some extent preliminary because certain data are lacking for some species. In particular, fuel deposition rates and stopover durations over a wider geo- graphical area are not k n o w n for the two fly- catcher species and the Whitethroat, but would be important information for deriving the mi- gration strategy. Populations or individuals of a species might differ in their migration strategy. Furthermore, it is an open question how flex- ible individual birds are in switching to another
strategy when environmental conditions
change. W h e n there are enough stopover sites of high quality before the Sahara (southern Mediterranean region), it might not be of cru- cial importance which strategy to adopt in terms of the success of the j o u r n e y (survive or not). But if stopover sites before the Sahara be- come scarce, there will be a strong selective pressure against strategy 3 and against moult- ing during migration across Europe.
Acknowledgements
This study is part of the analysis of data collected within the European Science Foundation Network ,,Spatio-temporal course, ecology and energetics of Western Palaeartic-Afri- can songbird migration" under the aegis of EURING, Euro- pean Union for Bird Ringing. We are greatly indebted to 34 ringing stations, their leaders and the many volunteers who collaborated in this Network and made it possible to analyse data collected in a coordinated manner across Europe and West Africa; to the chairman of the Network, Franz Bair- lein, who initiated and co-ordinated the Network and col- lected the data in a central data base; to the members of the co-ordination committee for their constant support of the Network; to Herbert Biebach, Marc K6ry, Heinz-Ulrich Reyer and many colleagues at the Swiss Ornithological In- stitute for critically reviewing earlier drafts of the manu- script. This study was supported by the Swiss National Science Foundation, grant no 3100-40568.94.
460 Journal ftir Ornithologie 141, 2000
References
Bairlein, E (1985): Body weights and fat deposition of Pa- laearctic passerine migrants in the central Sahara. Oeco- logia 66: 141-146.
Bairlein, E (1991): Body mass of Garden Warbler (Sylvia borin) on migration: a review of field data. Die Vogel-
warte 36: 48-61.
Bairlein, E (1992): Recent prospects on trans-Saharan mi- gration of songbirds. Ibis 134 suppl, 1: 41-46. Bairlein, E (1995): Manual of Field Methods. European-
African songbird migration network. Wilhelmshaven: Institut fiir Vogelforschung.
Bairlein, E (1997): Spatio-temporal course, ecology and energetics of Western Palaeamtic-African songbird mi- gration. Summary report. Wilhelmshaven: Institut fiir Vogelforschung.
Bairlein, E, Beck, E, Feiler, W. & Quemer, U. (1983): Au- tumn weights of some Palaearctic passerine migrants in the Sahara. Ibis 125: 404-407.
Bensch, S. & Nielsen, B. (1999): Autumn migration speed of juvenile Reed and Sedge Warblers in relation to date and fat loads. Condor 101:153 -156.
Bibby, C. J. & Green, R. E. (1980): Foraging behaviour of migrant Pied Flycatchers, Ficedula hypoleuca, on tem-
porary territories. J. Anim. Ecol. 49:507 -521. Bibby, C. J. & Green, R. E. (1981): Autumn migration
strategies of Reed and Sedge Warblers. Ornis Scand. 12: 1-12.
Biebach, H. (1995): Stopover of migrants flying across the Mediterranean Sea and the Sahara. Israel J. Zool. 41: 387-392.
Biebach, H., Friedrich, W. & Heine, G. (1986): Interaction of body-mass, fat, foraging and stopover period in trans- Sahara migrating passerine birds. Oecologia 69: 370-379.
Bruderer, B. & Liechti, E (1999): Bird migration across the Mediterranean. In: Adams, N. J. & Slotow, R. H, (Eds.): Proc. 22. Int. Ornithol. Congr., Durban: 1983-1999. Jo- hannesburg.
Chilgren, J. D. (1977): Body composition of captive white- crowned Sparrows during postnuptial molt. Auk 94: 677- 688.
Cramp, S. (Ed., 1992): The birds of the Western Palaearctic Vol. VI. Warblers. Oxford.
Cramp, S. (Ed., 1993): The birds of the Western Palaearctic Vol. VII. Flycatchers to Shrikes. Oxford.
Ellegren, H. (1993): Speed of migration and migratory flight lengths of passerine birds ringed during autumn migration in Sweden. Omis Scand. 24: 220- 228. Fransson, T. (1995): Timing and speed of migration in
North and West European populations of Sylvia War-
blers. J. Avian Biol. 26: 39-48.
Gatter, W. & Schmid, U. (1990): Hoverfly migration (Dip- tera Syrphidae) at Randecker Maar southwest Germany. Spixiana Supplement 15:1 - 100.
Glutz yon Blotzheim, U. & Bauer, K. M. (1991): Handbuch der V6gel Mitteleuropas. Band 12. Passeriformes 3. Teil. Wiesbaden.
Glutz von Blotzheim, U. & Bauer, K. M. (1993): Handbuch der V6gel Mitteleuropas. Band 13. Passeriformes 4. Teil. Wiesbaden.
Herremans, M. (1990): Body-moult and migration overlap in Reed Warblers (Acrocephalus seirpaceus) trapped
during nocturnal migration. Le Gerfant 80: 149-158. Hild~n, O. & Sanrola, P. (1982): Speed of autumn migration
of birds ringed in Finland. Ornis Fennica 59:140 143. Jenni, L. (1984): Herbstzugmuster von VOgeln auf dem
Col de Bretolet unter besonderer Berficksichtigung nachbrutzeitlicher Bewegungen. Ornithol. Beob. 81: 183-213.
Jenni, L. & Winlder, R. (1989): The feather-length of small passerines: a measurement for wing-length in live birds and museum skins. Bird Study 36:1-15.
Jenni, L. & Winkler, R. (1994): Moult and Ageing of Euro- pean Passerines. London.
Kaiser, A. (1993): A new multi-category classification of subcutaneous fat deposits of songbirds. J. Field. Orni- thol. 64: 246-255.
Klein, H., Berthold, R & Gwinner, E. (1973): Der Zug euro- paischer Garten- und M~Snchsgrasmticken (Sylvia borin
und S. atricapilla). Vogelwarte 27:73 - 134
Lindstr6m, A., Daan, S. & Visser, G. H. (1994): The con- flict between moult and migratory fat deposition: a pho- toperiodic experiment with bluethroats. Anim. Behav. 48:1173-1181.
Moreau, R. E. (1969): Comparative weights of some trans- saharan migrants at intermediate points, ibis 111: 621 - 624.
Murphy, M. E. (1996): Energetics and nutrition of molt. In: Carey, C. (Ed.): Avian energetics and nutritional ecol- ogy. New York, pp 158-198.
Newton, 1. (1968): The temperatures, weights, and body components of molting Bullfinches. Condor 70: 323-332.
Norman, S. C. (1990): A comparative study of post-juvenile moult in four species of Sylvia warbler. Ringing & Mi-
gration 11: 12-22.
Payne, R. W., Lane, R W., Digby, E G. N., Harding, S. A., Leech, E K., Morgan, G. W., Todd, A. D., Thompson, R., Tunnicliffe Wilson, G., Welham, S. J. & White, R. R (1993): Genstat 5 Release 3. Reference Manual. Oxford. Redfern, C. R E & Alker, P. J. (1996): Plumage development and post-juvenile moult in the Sedge Warbler Acroce- phalus sehoenobaenus. J. Avian Biol. 27: 157-163.
Schaub, M. & Jenni, L. (2000): Fuel deposition of three passerine bird species along migration route. Oecologia
122: 306-317.
Schanb, M., Pradel, R., Jenni, L. & Lebreton, J.-D.: Migrat- ing birds stop over longer than usually thought: an im- proved capture-recapture analysis. Ecology (in press). Svensson, L. (1992): Identification guide to European Pass-
erines. 4. ed. Stockholm.
Yoccoz, N. G. (1991): Use, overuse, and misuse of signifi- cance tests in evolutionary biology and ecology. Bull. Ecol. Soc. Am. 72: 106-111.
Zink, G. (1973): Der Zug europfiischer SingvOgel ein At- las der Wiederfunde beringter V6gel (1.Lieferung). M6ggingen.
Zink, G. (1981): Der Zug europ~iischer Singv6gel - ein At- las der Wiederfunde beringter V6gel (2. Lieferung). M6ggingen.