ULTRASOUND
Heritability, determinants and reference values of renal
length: a family-based population study
Menno Pruijm&Belen Ponte&Daniel Ackermann&Philippe Vuistiner&
Fred Paccaud&Idris Guessous&Georg Ehret&Ute Eisenberger&
Markus Mohaupt&Michel Burnier&Pierre-Yves Martin&Murielle Bochud
Received: 8 February 2013 / Revised: 8 April 2013 / Accepted: 25 April 2013 / Published online: 28 May 2013 # European Society of Radiology 2013
Abstract
Objectives In this population-based study, reference values were generated for renal length, and the heritability and factors associated with kidney length were assessed. Methods Anthropometric parameters and renal ultrasound measurements were assessed in randomly selected nuclear families of European ancestry (Switzerland). The adjusted narrow sense heritability of kidney size parameters was estimated by maximum likelihood assuming multivariate normality after power transformation. Gender-specific ref-erence centiles were generated for renal length according to body height in the subset of non-diabetic non-obese partic-ipants with normal renal function.
Results We included 374 men and 419 women (mean ± SD, age 47 ± 18 and 48 ± 17 years, BMI 26.2 ±4 and
24.5 ± 5 kg/m2, respectively) from 205 families. Renal length was 11.4 ± 0.8 cm in men and 10.7 ± 0.8 cm in women; there was no difference between right and left renal length. Body height, weight and estimated glomer-ular filtration rate (eGFR) were positively associated with renal length, kidney function negatively, age qua-dratically, whereas gender and hypertension were not. The adjusted heritability estimates of renal length and volume were 47.3 ± 8.5 % and 45.5 ± 8.8 %, respectively (P< 0.001).
Conclusion The significant heritability of renal length and volume highlights the familial aggregation of this trait, independently of age and body size. Population-based ref-erences for renal length provide a useful guide for clinicians.
Electronic supplementary material The online version of this article (doi:10.1007/s00330-013-2900-4) contains supplementary material, which is available to authorized users.
M. Pruijm
:
M. BurnierDepartment of Nephrology, Lausanne University Hospital (CHUV), Lausanne, Switzerland
B. Ponte
:
P.<Y. MartinDepartment of Nephrology, University Hospital of Geneva (HUG), Geneva, Switzerland
D. Ackermann
:
M. MohauptDepartment of Nephrology and Hypertension, University Hospital of Bern,
Bern, Switzerland
P. Vuistiner
:
F. Paccaud:
I. Guessous:
M. Bochud (*) Institute of Social and Preventive Medicine (IUMSP), Lausanne University Hospital (CHUV),Route de la Corniche 10, 1010 Lausanne, Switzerland e-mail: [email protected]
I. Guessous
Unit of Population Epidemiology, Division of Primary Care Medicine, Department of Community Medicine and Primary Care
and Emergency Medicine, Geneva University Hospital, Geneva, Switzerland
G. Ehret
Cardiology, Department of Specialties of Internal Medicine, Geneva University Hospital,
Rue Gabrielle-Perret-Gentil 4, 1211 Geneva 14, Switzerland
U. Eisenberger
Department of Nephrology, University Hospital Essen-Duisburg, Essen-Duisburg, Germany
Key Points
• Renal length and volume are heritable traits, independent of age and size.
• Based on a European population, gender-specific reference values/percentiles are provided for renal length.
• Renal length correlates positively with body length and weight.
• There was no difference between right and left renal lengths in this study.
• This negates general teaching that the left kidney is larger and longer.
Keywords Renal length . Kidney volume . Renal ultrasound . General population . Heritability
Introduction
Renal length is an important clinical parameter, as it pro-vides information on the underlying disease process and the potential reversibility of kidney damage [1]. Over the last 30 years, renal ultrasound has remained the imaging technique of choice to measure renal length in patients presenting with acute and chronic kidney dysfunction, even though alternative techniques such as magnetic resonance imaging (MRI) and computed tomography (CT) have been developed. Renal ultrasound is widely available, provides reliable anatomical information in experienced hands, is highly reproducible and has no side effects. However, kidney volume estimations are generally considered less reliable owing to the two-dimensional nature of ultrasound [2,3].
A number of previous studies—mainly performed in the 1980s and 1990s—have reported reference values for renal length in adults [4–6]. None of these studies were population-based; one recent population-based study was performed on Asian subjects, and the reported reference values cannot be used for Caucasians [7]. Other studies have reported that the main determinants of renal length are gender, age, body height, body weight, blood pressure (BP), kidney function and the presence of diabetes [1, 8–11]. However, anthropomorphic characteristics of the population have changed in the mean time, which might have influenced reference values and determinants. To the best of our knowledge, the familial aggregation of kidney size has never been assessed previously.
Therefore, the aims of this family-based population study were to assess reference values for renal length in today’s European population, to assess its heritability and to deter-mine its associations with anthropomorphic factors. In a secondary analysis, we assessed the heritability and factors associated with kidney volume.
Materials and methods Participants and anthropometry
SKIPOGH (Swiss Kidney Project on Genes in Hypertension) is a family-based cross-sectional study exploring the role of genes and kidney haemodynamics in blood pressure (BP) regulation and hypertension.
Participants were recruited in the cantons of Bern and Geneva, and the city of Lausanne. Recruitment of partici-pants started in December 2009 and is still ongoing. A simple, non-stratified random sample of subjects was drawn from lists of inhabitants provided by the population regis-tries of the three cities. A letter inviting the addressee to participate was sent, and subjects were contacted within 14 days by one of the staff members. Inclusion criteria were: (1) written informed consent; (2) minimum age of 18 years; (3) Caucasian origin, defined as having both parents and grandparents born in a restricted list of countries (available from the authors); (4) at least one, and preferably three, first-degree family members also willing to participate. The family members were contacted in a similar way, and an appointment for a study visit was set individually with each family member. The SKIPOGH study was approved by the institutional ethics committees of the participating universi-ty hospitals. As of April 2012, the study population included 854 participants coming from 212 nuclear families. The participation rate was 22.3 %. Participants with a unilateral kidney, polycystic kidneys, the presence of cysts on the superior or inferior pole, hydronephrosis, partial nephrecto-my, horseshoe kidney, missing data or insufficient ultra-sound quality were excluded, leaving 793 participants com-ing from 205 families for the purpose of this analysis.
The study visit was performed in the morning after an overnight fast. BP was measured with a non-mercury man-ual auscultatory sphygmomanometer (A&D UM-101; A&D Company, Toshima Ku, Tokyo, Japan) [12,13]. Each sub-ject’s conventional office BP was the mean of the five consecutive readings, and hypertension was defined as a mean office BP ≥140/90 mmHg [14]. Body weight was measured in kilograms to the nearest 100 g using a Seca scale. Height was measured to the nearest 5 mm using a Seca height gauge. Body surface area (BSA) was calculated using the Dubois formula [15], and body mass index (BMI) was calculated as weight (kilograms) divided by squared height (square metres).
Renal ultrasound and blood samples
Renal grey-scale B mode ultrasound was performed according to a standard procedure. The longitudinal dimen-sions of each kidney were measured in a sagittal plane visually estimated to represent the largest longitudinal
diameter, and length was assessed with participants in the supine position, or in the case of insufficient image quality, the participant was examined in the left or right decubitus position. The mean of three optimal longitudinal measure-ments was reported. The width and transverse diameter were measured in a transverse plane perpendicular to the longitu-dinal axis of the kidney. The level of the transverse section was at the vascular hilum of the kidney. The mean of three separate measurements of each parameter was reported. Renal volume was calculated as 0.523 × length × width × transverse diameter [16]. In each study centre, all ultrasound examinations were performed by the same experienced op-erator. The Aplio XG device (Toshiba Medical Systems, Volketswil, Switzerland) was used for imaging in Geneva and Lausanne, and the Acuson S2000 device (Siemens Healthcare, Erlangen, Germany) was used in Bern.
Venous blood samples were drawn from an antecubital vein. Glycaemia and kidney function tests were dosed in the local university laboratories using standard clinical labora-tory methods. The CKD-EPI formula was used to calculate the estimated glomerular filtration rate (eGFR) [17]. CKD was defined as an eGFR <60 ml/min/1.73 m2[18]. Statistical analysis
To obtain the gender-specific reference centile curves for renal length according to body height, we applied the LMS method [19]. The model that best fitted the data was selected based on the Akaike information criterion (AIC). The Box– Cox transformation parameter was constant throughout all body height values (0.37 for men and 0.58 for women) and the relationship between kidney length and body height was assumed to be linear. These analyses were performed with R 2.15.1 (R Core Team, 2012, Vienna, Austria) using the gamlss package [20]. Persons with CKD (eGFR <60 ml/min/1.73 m2), obesity (BMI >30 kg/m2) and/or diabetes were excluded from these analyses.
In order to account for centre and family, we used two-level multivariable linear regression, adjusting for age, gen-der, smoking, body height and weight, diabetes, hyperten-sion and kidney function (eGFR, CKD-EPI) to determine the independent association of each independent variable of interest with the dependent variables of renal length and volume. Results of all linear multivariate analyses are presented as beta-coefficients (β) and their 95 % confidence intervals. P values were derived from maximum likelihood ratio tests. Statistical significance was considered for a two-sided P<0.05. This statistical analysis was conducted using STATA 11.0 (StataCorp, College Station, TX, USA).
Heritability was assessed as described previously [21]. In brief, heritability is a measure of familial resemblance that relies on the assumption that the total phenotypic variance of a quantitative trait can be partitioned into independent
genetic and environmental components. In turn, the genetic variance can be divided into an additive genetic variance, a dominance variance and an epistatic variance. Additive variance represents the average effects of individual alleles on the trait and reflects transmissible resemblance between relatives. Heritability in the narrow sense is defined as the ratio of the additive genetic variance to the total phenotypic variance. In this paper we refer to“heritability in the narrow sense” simply as heritability. To estimate heritability we used a linear regression model in which the total residual variance is partitioned, after regressing on covariates, into the sum of an additive polygenic component, a sibling component and an individual-specific random component. Heritability was estimated as the polygenic component di-vided by the total residual variance. We estimated the heri-tability of kidney length and kidney volume. Age, gender, body length, body weight and eGFR were used as covari-ates. We used the ASSOC program in Statistical Analysis for Genetic Epidemiology (S.A.G.E.) for both the compo-nents of variance and covariate coefficients, as described previously [22].
Results
Family structure
The participants came from 205 distinct families, most of which included two generations. The mean family size (± SD) was 4.7±2.0, with the largest nuclear families including 10 members. These family structures led to 519 parent– offspring pairs, 266 sibling pairs, 119 uncle–nephew pairs, 43 grandparents–grandchildren pairs and 24 cousin pairs. Reproducibility and accuracy of ultrasound measurements As different operators performed the ultrasound examina-tions, a concordance study of 20 participants was undertak-en in which two operators examined the kidneys blinded to the other’s results. The following results were found for the reproducibility of the ultrasound data: Lin’s correlation co-efficients for right and left renal length were 0.90 and 0.82 respectively, and intra-class correlation coefficients were 0.91 and 0.82 (all, P<0.005).
The accuracy of ultrasound kidney volume measurement was assessed in 20 subjects in Lausanne who underwent on the same day renal MRI and renal ultrasound in an affiliated study. Renal MRI-based dimensions were assessed by an independent, experienced radiologist who was blinded to the ultrasound results. MRI-based kidney volume was cal-culated using the same formula as renal ultrasound-measured kidney volume. Lin’s correlation coefficients be-tween renal MRI and ultrasound for right and left kidney
volume were and 0.79 and 0.79 (both, P<0.005). Lin’s correlation coefficients between MRI and ultrasound for right and left renal length were 0.86 and 0.89, respectively (both, P<0.005).
Baseline characteristics and kidney dimensions
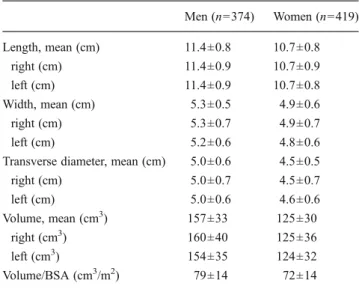
Baseline characteristics of the 793 participants are shown in Table1. Kidney dimensions by gender and individually for the right and left kidneys are shown in Table2. All kidney dimensions were larger in men than in women (all, P< 0.001). Kidney volume remained significantly larger in men than women after correction for BSA (P<0.001). There was no difference between the length of the right and left kidneys (P=0.58) or between kidney volumes, except in men in whom the volume of the right kidney was larger than that of the left kidney (P=0.002).
Reference values for renal length according to body height Reference values expressed as percentiles of renal length according to gender over a large range of body heights are shown in Fig.1. Subjects with eGFR <60 ml/min/1.73 m2, obesity, and/or diabetes were excluded, leaving 570 subjects for this analysis.
Relationship between mean renal length and phenotypic characteristics of participants
In multilevel, multivariable linear regression analysis in-cluding all participants (n=793), mean renal length was positively associated with body height, weight and kidney function (eGFR), yet not with diabetes, hypertension or active smoking (Table3). There was a quadratic relationship between renal length and age (β age per year2
,−0.004; 95 %
CI, −0.005 to −0.002; P<0.001), with a maximum renal length reached at 42.5 years.
Similar trends were found between kidney volume and phenotypic characteristics. Kidney volume was positively associated with body height, body weight and eGFR. Kidney volume was also positively associated with hyper-tension, and slightly negatively with gender (female vs male), but not with diabetes (see Supplementary TableA).
Heritability of kidney dimensions
Age- and gender-adjusted heritability of the mean renal length and volume, and of each kidney individually, are shown in Table 4 (left column). Both renal length and
Table 1 Baseline characteristics according to gender
All variables (except age and eGFR <60 ml/min/1.73 m2) P<0.001, men vs women History of cardiovascular dis-ease based on self-reporting Chronic kidney disease defined as eGFR <60 ml/min/1.73 m2 Hypertension defined as mean office BP≥140/90 mmHg Men (n=374) Women (n=419) Age (years) 47±18 48±17 Body weight (kg) 82±13 66±14 Body height (cm) 177±7 165±6 BMI (kg/m2) 26.2±4 24.5±5
Body surface area (m2) 2.0±0.2 1.7±0.2
Hypertension (%) 27.8 23.5
Treated hypertension (%) 61.1 48.4
Diabetes (%) 5.6 3
Smoking (%) 30.2 21.1
History of cardiovascular disease (%) 11.6 12
Serum creatinine (μmol/l) 81±13 67±11
eGFR (ml/min/1.73 m2) 98±18 95±17
eGFR <60 ml/min/1.73 m2(%) 2.1 3.1
Table 2 Renal dimensions, according to gender
Men (n=374) Women (n=419) Length, mean (cm) 11.4±0.8 10.7±0.8 right (cm) 11.4±0.9 10.7±0.9 left (cm) 11.4±0.9 10.7±0.8 Width, mean (cm) 5.3±0.5 4.9±0.6 right (cm) 5.3±0.7 4.9±0.7 left (cm) 5.2±0.6 4.8±0.6
Transverse diameter, mean (cm) 5.0±0.6 4.5±0.5
right (cm) 5.0±0.7 4.5±0.7 left (cm) 5.0±0.6 4.6±0.6 Volume, mean (cm3) 157±33 125±30 right (cm3) 160±40 125±36 left (cm3) 154±35 124±32 Volume/BSA (cm3/m2) 79±14 72±14 Data are mean ± SD
Men versus women, P<0.001 for all values BSA body surface area
volume were significantly heritable traits. Further adjust-ment for body height, weight and eGFR (Table 4, right column) hardly modified heritability estimates, which remained between 35 and 47 %.
Discussion
This study shows that renal length is a heritable trait, even when adjusting for body length and weight, two anthropo-morphic parameters with high heritability. Second, the main independent determinants of kidney length in this population-based family study were body length, weight, age and kidney function, whereas gender was not. Similar associations were found for kidney volume. Third, based on a subgroup of non-CKD, non-obese and non-diabetic par-ticipants, reference values are provided for renal length as measured by ultrasound per gender and body length.
To the best of our knowledge, this is the first study to demonstrate significant heritability estimates for renal length and volume. Kidney size strongly aggregated in families, some families having relatively large, other rela-tively small kidneys, independent of body length, kidney function and weight. As such, this study illustrates that kidney size is at least partly genetically determined, and justifies further analyses aimed at discovering genetic de-terminants of kidney size. However, the clinical utility of the heritability of kidney size is uncertain, as this trait is likely of polygenic nature (i.e. a large number of genes each have a small effect on kidney size). One might hypothesise that families with relatively larger kidneys could be genetically ‘protected’ against kidney function deterioration with ageing. Indeed, it has been shown that kidney size correlates positively with the number of glo-meruli per kidney and the number of gloglo-meruli correlates with kidney function [8, 23, 24]. Clearly, this hypothesis merits further study.
160 170 180 190 200 90 100 110 120 130 Body Height [cm] Kidne y Length [mm] Men 50% 25−75% 10−90% 3−97% 150 155 160 165 170 175 180 90 100 110 120 130 Body Height [cm] Kidne y Length [mm] Women 50% 25−75% 10−90% 3−97%
Fig. 1 Percentiles of renal length according to gender over a large range of body heights. Median values, 3th, 10th, 25th, 75th, 90th and 97th percentiles are shown for diabetic non-obese men and women (n=269 and 301, respectively) with eGFR >60 ml/min/1.73 m2
Table 3 Factors associated with renal length (in mm)
Age, gender adjusted Fully adjusteda
Β 95 % CI P Βa 95 % CI P
Gender (female vs male) −6.4 −7.4 −5.4 <0.001 0.48 −0.93 1.89 0.50 Age (per year) −0.04 −0.07 −0.15 <0.001 0.11 0.06 0.16 <0.001 Age (per year2) −0.006 −0.007 −0.004 <0.001 −0.004 −0.005 −0.002 <0.001 Body height (per cm) 0.41 0.32 0.49 <0.001 0.32 0.23 0.41 <0.001 Body weight (per kg) 0.23 0.19 0.27 <0.001 0.18 0.14 0.22 <0.001
eGFR (CKD-EPI) 0.17 0.12 0.21 <0.001 0.20 0.16 0.24 <0.001
Smoking (yes vs no) −0.20 −1.49 1.09 0.76 0.44 −0.68 1.56 0.44
Hypertension (yes vs no) 1.71 0.28 3.14 0.02 1.06 −0.20 2.31 0.10
Diabetes (yes vs no) 1.75 −1.05 4.54 0.22 1.32 −1.05 3.70 0.27
Data are regression coefficientβ and 95 % confidence interval (95 % CI) assessed by multilevel (centre and family) multivariable linear regression a
Previous ultrasound studies have reported that mean renal length varies between 10.1 and 11.2 cm [9, 11, 25, 26], which is smaller than the values reported in this study. However, many of these studies were not based on random-ly recruited individuals, but on individuals with a non-renal indication to undergo abdominal imaging, or on those requesting a health check-up, which might have biased re-sults. Besides, as stated in the introduction, many studies were performed in the 1980s and 1990s. Population demo-graphics and physical characteristics have changed, which might have influenced kidney dimensions.
In clinical practice, physicians can be faced with the question whether renal length is appropriate for a given body height. For example, one can wonder if a renal length of 14 cm in a male subject with a body length of 190 cm is larger than expected or not; the same question might apply to a renal length of 8.5 cm in a female subject measuring 155 cm. Renal length above the 95th percentile for a given body length could refer to underlying disease processes such as diabetes, obesity-induced glomerular hyperfiltration, am-yloidosis or other metabolic storage diseases [27–29]. Renal length below the 5th percentile might indicate irreversible kidney damage. Besides, as stated above, larger or smaller than expected renal length could also be genetically deter-mined. With a few exceptions [9,30], data reported in the medical literature are not gender- or body length-specific, which limits their clinical usefulness. The reference values and percentiles reported in this study are intended to help the physician to determine in a more objective manner whether kidneys are small, normal or large for a given body height. This study did not confirm the general paradigm that renal length and volume are larger on the left than on the right hand side [4,9,10]. This difference has generally been attributed to the fact that the left kidney is less hampered in its growth by the spleen than the right kidney by the liver [10]. We did not find any difference in renal length, and found a slightly larger volume of the right kidney compared with the left kidney. MRI is generally considered the most reliable way to measure renal length and volume. In line
with our findings, the largest study based on nuclear MRI so far, including 150 patients, did not find a significant differ-ence in length or volume between the right and left kidneys [31]; another MRI study performed in 240 human fetuses without urogenital anomalies also did not show any differ-ence in size between the right and left kidney [32].
As published previously by other authors, the main de-terminants of renal length in our population were body length, weight and kidney function [9, 26]. On the other hand, we did not find an independent association between gender and renal length. In fact, the smaller kidney length in women was largely explained by their smaller body height and weight compared with men. Age correlated quadratical-ly and not negativequadratical-ly with renal length in fulquadratical-ly adjusted models. This is contrary to most previous studies [9, 29–31]. However, most previous studies did not take into account kidney function as a possible confounder, which might partly explain this divergence. Several mechanisms such as a change in kidney shape due to a progressive increase in the central fat mass and weakening of the perirenal capsule by the mid-40s, followed by loss of kidney parenchyma and loss of abdominal muscular mass with less applanation of the kidneys thereafter, could underlie the quadratic association between age and kidney length. This is, however, somewhat speculative and further studies would be needed to confirm these hypotheses.
Similar associations were found between kidney volume and phenotypic characteristics such as body length and weight, and the heritability of kidney volume was to the same order of the heritability as that found for renal length. However, the results reported for kidney volume should be interpreted with caution, as the concordance between ultra-sound and MRI-assessed kidney volume was weaker than for renal length in our study. This finding is in line with previous studies that demonstrated the superiority of CT- or MRI-based methods to assess kidney volume [3,26].
This study should be interpreted within the context of its strengths and limitations. The major strengths are the population-based design, the large sample size and the use of the same standardised protocol across centres, with good inter-observer reproducibility. The high heritability esti-mates for kidney size is a good indicator of the data quality in this study: measurement error tends to reduce heritability estimates as it increases the total phenotypic variance (i.e. the denominator) without affecting the additive genetic var-iance (i.e. the numerator). Among the limitations, the cross-sectional nature limits causal inferences regarding the de-terminants of kidney size. Second, assessment of kidney volume by renal ultrasound is less reproducible than renal length, and the associations described for kidney volume should be interpreted with caution. Despite these limitations, similar trends were found for renal length and for kidney volume. Finally, several caveats about the concept of
Table 4 Heritability for renal length and volume Age, gender, centre adjusted h2 a Fully adjusted h2 Length, mean (cm) 45.5±8.3 47.3±8.5 right (cm) 36.8±8.8 35.6±9.0 left (cm) 41.1±8.7 39.1±8.9 Volume, mean (cm3) 45.6±7.9 45.5±8.8 right (cm3) 39.1±8.4 34.5±8.6 left (cm3) 36.0±8.5 35.3±9.2 Data are narrow sense h2 estimates in percentage ± SD a
heritability deserve mention. Heritability being a population-specific concept, our estimates only apply to the Swiss popu-lation examined. Yet, it is unlikely that kidney size would not be heritable in other populations as well. Besides, although we cannot exclude genotype–environment interactions, their ef-fects are minimised by the choice of an appropriate scale of measurement, which we achieved by simultaneously estimat-ing that scale (the power transformation) under a model that assumed no such interactions.
In conclusion, this study shows that kidney size is highly heritable. This justifies looking for genes involved in the deter-mination of kidney size. This family-based population study also reports reference values and percentiles for kidney size in a European, healthy, unselected adult population, thus providing a useful guide for clinicians. Finally, this study shows that the main independent determinants of renal length are body height, weight, kidney function and age but not gender.
Acknowledgments M.P., B.P., D.A., G.E. and I.G. and the study were supported by a grant from the Swiss National Science Foundation (FN 33CM30-124087). Some of the results of this paper were obtained by using the program package S.A.G.E., which was supported by a U.S. Public Health Service Resource Grant (RR03655) from the National Center for Research Resources.
Conflicts of interest None.
References
1. Soldo D, Brkljacic B, Bozikov V, Drinkovic I, Hauser M (1997) Diabetic nephropathy. Comparison of conventional and duplex Doppler ultrasonographic findings. Acta Radiol 38:296–302 2. Emamian SA, Nielsen MB, Pedersen JF (1995) Intraobserver and
interobserver variations in sonographic measurements of kidney size in adult volunteers. A comparison of linear measurements and volumetric estimates. Acta Radiol 36:399–401
3. Bakker J, Olree M, Kaatee R et al (1999) Renal volume measure-ments: accuracy and repeatability of US compared with that of MR imaging. Radiology 211:623–628
4. Brandt TD, Neiman HL, Dragowski MJ, Bulawa W, Claykamp G (1982) Ultrasound assessment of normal renal dimensions. J Ultrasound Med 1:49–52
5. Emamian SA, Nielsen MB, Pedersen JF (1994) Tenth percentiles of kidney length in adult volunteers. AJR Am J Roentgenol 163:748 6. Rivolta R, Cardinale L, Lovaria A, Di Palo FQ (2000) Variability
of renal echo-Doppler measurements in healthy adults. J Nephrol 13:110–115
7. Raza M, Hameed A, Khan MI (2011) Ultrasonographic assessment of renal size and its correlation with body mass index in adults without known renal disease. J Ayub Med Coll Abbottabad 23:64–68 8. Singh GR, Hoy WE (2004) Kidney volume, blood pressure, and albuminuria: findings in an Australian aboriginal community. Am J Kidney Dis 43:254–259
9. Emamian SA, Nielsen MB, Pedersen JF, Ytte L (1993) Sonographic evaluation of renal appearance in 665 adult volun-teers. Correlation with age and obesity. Acta Radiol 34:482–485 10. Emamian SA, Nielsen MB, Pedersen JF, Ytte L (1993) Kidney
dimensions at sonography: correlation with age, sex, and habitus in 665 adult volunteers. AJR Am J Roentgenol 160:83–86
11. Raman GV, Clark A, Campbell S, Watkins L, Osmond C (1998) Is blood pressure related to kidney size and shape? Nephrol Dial Transplant 13:728–730
12. Stergiou GS, Giovas PP, Gkinos CP, Tzamouranis DG (2008) Validation of the A&D UM-101 professional hybrid device for office blood pressure measurement according to the International Protocol. Blood Press Monit 13:37–42
13. Pruijm MT, Wuerzner G, Glatz N et al (2010) A new technique for simultaneous validation of two manual nonmercury auscultatory sphygmomanometers (A&D UM-101 and Accoson Greenlight 300) based on the International protocol. Blood Press Monit 15:322–325
14. O’Brien E, Asmar R, Beilin L et al (2003) European Society of Hypertension recommendations for conventional, ambulatory and home blood pressure measurement. J Hypertens 21:821–848 15. Genuth S, Alberti KG, Bennett P et al (2003) Follow-up report on
the diagnosis of diabetes mellitus. Diabetes Care 26:3160–3167 16. Jones TB, Riddick LR, Harpen MD, Dubuisson RL, Samuels D
(1983) Ultrasonographic determination of renal mass and renal volume. J Ultrasound Med 2:151–154
17. Levey AS, Stevens LA, Schmid CH et al (2009) A new equation to estimate glomerular filtration rate. Ann Intern Med 150:604–612 18. Keller C, Katz R, Cushman M, Fried LF, Shlipak M (2008)
Association of kidney function with inflammatory and procoagulant markers in a diverse cohort: a cross-sectional analy-sis from the Multi-Ethnic Study of Atheroscleroanaly-sis (MESA). BMC Nephrol 9:9
19. Cole TJ, Green PJ (1992) Smoothing reference centile curves: the LMS method and penalized likelihood. Stat Med 11:1305–1319 20. Rigby RA, Stasinopoulos DM (2004) Smooth centile curves for
skew and kurtotic data modelled using the Box-Cox power expo-nential distribution. Stat Med 23:3053–3076
21. Bochud M, Elston RC, Maillard M et al (2005) Heritability of renal function in hypertensive families of African descent in the Seychelles (Indian Ocean). Kidney Int 67:61–69
22. Bochud M, Bovet P, Elston RC et al (2005) High heritability of ambulatory blood pressure in families of East African descent. Hypertension 45:445–450
23. Hoy WE, Douglas-Denton RN, Hughson MD, Cass A, Johnson K, Bertram JF (2003) A stereological study of glomerular number and volume: preliminary findings in a multiracial study of kidneys at autopsy. Kidney Int Suppl S31–S37
24. Keijzer-Veen MG, Devos AS, Meradji M, Dekker FW, Nauta J, van der Heijden BJ (2010) Reduced renal length and volume 20 years after very preterm birth. Pediatr Nephrol 25:499–507 25. Oyuela-Carrasco J, Rodriguez-Castellanos F, Kimura E,
Delgado-Hernandez R, Herrera-Felix JP (2009) Renal length measured by ultrasound in adult mexican population. Nefrologia 29:30–34 26. Glodny B, Unterholzner V, Taferner B et al (2009) Normal kidney
size and its influencing factors—a 64-slice MDCT study of 1.040 asymptomatic patients. BMC Urol 9:19
27. Paivansalo M, Huttunen K, Suramo I (1985) Ultrasonographic findings in renal parenchymal diseases. Scand J Urol Nephrol 19:119–123 28. Tuma J, Heynemann H (2006) [Ultrasound differential diagnosis in
renal parenchymal disease]. Praxis (Bern 1994) 95:721–727 29. O’Neill WC (2000) Sonographic evaluation of renal failure. Am J
Kidney Dis 35:1021–1038
30. Miletic D, Fuckar Z, Sustic A, Mozetic V, Stimac D, Zauhar G (1998) Sonographic measurement of absolute and relative renal length in adults. J Clin Ultrasound 26:185–189
31. Cheong B, Muthupillai R, Rubin MF, Flamm SD (2007) Normal values for renal length and volume as measured by magnetic resonance imaging. Clin J Am Soc Nephrol 2:38–45
32. Michielsen K, Meersschaert J, De Keyzer F, Cannie M, Deprest J, Claus F (2010) MR volumetry of the normal fetal kidney: refer-ence values. Prenat Diagn 30:1044–1048