1
Supplementary Material for
Labelling strategy and membrane characterization of marine
bacteria Vibrio splendidus by in vivo
2H solid-state NMR
Zeineb Bouhlel1, 2, Alexandre A. Arnold2, Dror E. Warschawski2,3, Karine Lemarchand1, Réjean
Tremblay1 and Isabelle Marcotte2*
1Institut des Sciences de la Mer de Rimouski, Université du Québec à Rimouski, 310 allée des Ursulines, Rimouski, Canada G5L 3A1
2Department of Chemistry, Université du Québec à Montréal, P.O. Box 8888, Downtown Station, Montreal, Canada, H3C 3P8
3UMR 7099, CNRS - Université Paris Diderot, IBPC, 13 rue Pierre et Marie Curie, F-75005 Paris, France
*Corresponding author Tel: 1-514-987-3000 #5015 Fax: 1-514-987-4054
2
(i) Effect of labelling on bacterial growth
Growth curves were acquired by periodic measurements of optical density (OD) at 600 nm for cultures enriched with exogenous fatty acids. Figure SI1 shows that supplementing the culture medium with either d31-PA or the combination of d31-PA and OA in the presence of Tween-20 did not induce major shifts in the delimitations of the growth phases. The transition between exponential and stationary phases was smooth, making delimitations hard to define. Typically, we define the mid-log phase occurring 15h to 16h after inoculation, if we consider stationary phase beginning around 25h and fully established after 30h of growth. Specific growth rates (µ) (see Materials & Methods) were calculated and showed no significant differences in the various labelling regimes of the cell growth (Fig. SI1). Similarly, whilst maximum optical densities in the enriched medium were slightly below those of the control, log phases durations were exactly the same (about 3 hours), indicating a good bacterial adaptation and no particular stress or toxic effect on growing bacteria in the 2H enriched medium.
Figure SI1: Representative growth patterns of V. splendidus in culture medium (A), culture
medium enriched with d31-PA (B), with d31-PA and OA (C) in presence of Tween-20. Cells were inoculated from cultures that had previously grown for 2 days. Specific growth rate (µ) was deduced from the first 25 hours of culture.
3 (ii) Fatty acids contents
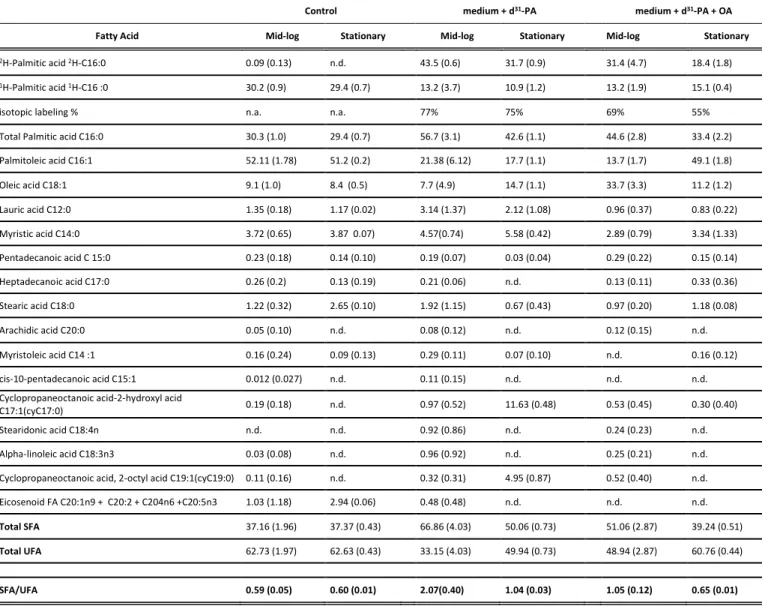
Table SI1: FAs content in V. splendidus expressed in molar % per total FA content, deuterium fatty acid expressed in % per total palmitic acid and SFA/UFA ratio with cell growth phases under different labelling regimes: V. splendidus grown in contol LB-medium, in medium enriched with d31-palmitic acid, and in
medium enriched with d31-palmitic acid and oleic acid. Bacteria were sampled during the exponential
(Mid-log) and early stationary phase. Growth temperature was 25°C for all cultures.
Control medium + d31-PA medium + d31-PA + OA
Fatty Acid Mid-log Stationary Mid-log Stationary Mid-log Stationary
2H-Palmitic acid 2H-C16:0 0.09 (0.13) n.d. 43.5 (0.6) 31.7 (0.9) 31.4 (4.7) 18.4 (1.8)
1H-Palmitic acid 1H-C16 :0 30.2 (0.9) 29.4 (0.7) 13.2 (3.7) 10.9 (1.2) 13.2 (1.9) 15.1 (0.4)
isotopic labeling % n.a. n.a. 77% 75% 69% 55%
Total Palmitic acid C16:0 30.3 (1.0) 29.4 (0.7) 56.7 (3.1) 42.6 (1.1) 44.6 (2.8) 33.4 (2.2)
Palmitoleic acid C16:1 52.11 (1.78) 51.2 (0.2) 21.38 (6.12) 17.7 (1.1) 13.7 (1.7) 49.1 (1.8) Oleic acid C18:1 9.1 (1.0) 8.4 (0.5) 7.7 (4.9) 14.7 (1.1) 33.7 (3.3) 11.2 (1.2) Lauric acid C12:0 1.35 (0.18) 1.17 (0.02) 3.14 (1.37) 2.12 (1.08) 0.96 (0.37) 0.83 (0.22) Myristic acid C14:0 3.72 (0.65) 3.87 0.07) 4.57(0.74) 5.58 (0.42) 2.89 (0.79) 3.34 (1.33) Pentadecanoic acid C 15:0 0.23 (0.18) 0.14 (0.10) 0.19 (0.07) 0.03 (0.04) 0.29 (0.22) 0.15 (0.14) Heptadecanoic acid C17:0 0.26 (0.2) 0.13 (0.19) 0.21 (0.06) n.d. 0.13 (0.11) 0.33 (0.36) Stearic acid C18:0 1.22 (0.32) 2.65 (0.10) 1.92 (1.15) 0.67 (0.43) 0.97 (0.20) 1.18 (0.08) Arachidic acid C20:0 0.05 (0.10) n.d. 0.08 (0.12) n.d. 0.12 (0.15) n.d. Myristoleic acid C14 :1 0.16 (0.24) 0.09 (0.13) 0.29 (0.11) 0.07 (0.10) n.d. 0.16 (0.12) cis-10-pentadecanoic acid C15:1 0.012 (0.027) n.d. 0.11 (0.15) n.d. n.d. n.d.
Cyclopropaneoctanoic acid-2-hydroxyl acid
C17:1(cyC17:0) 0.19 (0.18) n.d. 0.97 (0.52) 11.63 (0.48) 0.53 (0.45) 0.30 (0.40)
Stearidonic acid C18:4n n.d. n.d. 0.92 (0.86) n.d. 0.24 (0.23) n.d.
Alpha-linoleic acid C18:3n3 0.03 (0.08) n.d. 0.96 (0.92) n.d. 0.25 (0.21) n.d.
Cyclopropaneoctanoic acid, 2-octyl acid C19:1(cyC19:0) 0.11 (0.16) n.d. 0.32 (0.31) 4.95 (0.87) 0.52 (0.40) n.d.
Eicosenoid FA C20:1n9 + C20:2 + C204n6 +C20:5n3 1.03 (1.18) 2.94 (0.06) 0.48 (0.48) n.d. n.d. n.d.
Total SFA 37.16 (1.96) 37.37 (0.43) 66.86 (4.03) 50.06 (0.73) 51.06 (2.87) 39.24 (0.51)
Total UFA 62.73 (1.97) 62.63 (0.43) 33.15 (4.03) 49.94 (0.73) 48.94 (2.87) 60.76 (0.44)
SFA/UFA 0.59 (0.05) 0.60 (0.01) 2.07(0.40) 1.04 (0.03) 1.05 (0.12) 0.65 (0.01)
Values corresponds to means and respective standard deviations "n.d."indicates that these measurements could not be detected
4
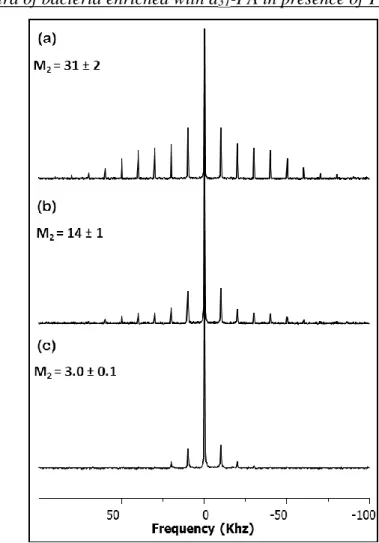
(iii) NMR spectra of bacteria enriched with d31-PA in presence of Tween-20
Figure SI2: 2H MAS (10 kHz) SS-NMR spectra of intact V. splendidus harvested at three different
cell growth times: (a) after 15 h in the mid-log phase (OD600nm ≈ 0.3), (b) after 22 h (±2h) at the beginning of the stationary stage (OD600nm ≈0.5), and (c) after 30 h at advanced stationary phase (OD600nm ≈ 0.5). Average second spectral moments M2 are indicated (109 s-2).