HAL Id: hal-02422042
https://hal.inria.fr/hal-02422042
Submitted on 20 Dec 2019HAL is a multi-disciplinary open access
archive for the deposit and dissemination of sci-entific research documents, whether they are pub-lished or not. The documents may come from teaching and research institutions in France or abroad, or from public or private research centers.
L’archive ouverte pluridisciplinaire HAL, est destinée au dépôt et à la diffusion de documents scientifiques de niveau recherche, publiés ou non, émanant des établissements d’enseignement et de recherche français ou étrangers, des laboratoires publics ou privés.
Distributed under a Creative Commons Attribution| 4.0 International License
The architecture of monospecific microalgae biofilms 2
Andrea Fanesi, Armelle Paule, Olivier Bernard, Romain Briandet, Filipa
Lopes
To cite this version:
Andrea Fanesi, Armelle Paule, Olivier Bernard, Romain Briandet, Filipa Lopes. The architecture of monospecific microalgae biofilms 2. Microorganisms, MDPI, 2019, 7 (9), pp.352. �10.3390/microor-ganisms7090352�. �hal-02422042�
Microorganisms 2019, 7, x; doi: FOR PEER REVIEW www.mdpi.com/journal/microorganisms
Article
1
The architecture of monospecific microalgae biofilms
2
Andrea Fanesi 1, Armelle Paule 1, Olivier Bernard 2, Romain Briandet3 and Filipa Lopes1,*
3
1 Laboratoire Génie des Procédés et Matériaux (LGPM), CentraleSupélec, Université Paris-Saclay, 91190
Gif-4
sur-Yvette, France
5
2 Université Côte d'Azur, Inria, BIOCORE, BP 93, 06902 Sophia Antipolis Cedex, France
6
3 Micalis Institute, INRA, AgroParisTech, Université Paris-Saclay, 78350 Jouy-en-Josas, France
7
* Correspondence: [email protected]; Tel.: +33175316112
8
Received: date; Accepted: date; Published: date
9
Abstract: Microalgae biofilms have been proposed as an alternative to suspended cultures in
10
commercial and biotechnological fields. However, little is known about their architecture which
11
may strongly impact biofilm behavior, bioprocess stability and productivity. In order to unravel the
12
architecture of microalgae biofilms, four species of commercial interest were cultivated in
13
microplates and characterized using a combination of confocal laser scanning microscopy and
FTIR-14
spectroscopy. In all the species, the biofilm biovolume and thickness increased over time and
15
reached a plateau after 7 days, the final biomass reached was very different though. The roughness
16
decreased during maturation, reflecting cell division and voids filling. The extracellular polymeric
17
substances content of the matrix remained constant in some species and increased over time in some
18
others. Vertical profiles showed that young biofilms presented a maximum cell density at 20 µm
19
above the substratum co-localized with matrix components. In mature biofilms, the maximum
20
density of cells moved at a greater distance from the substratum (30-40 µm) whereas the maximum
21
coverage of matrix components remained in deeper layer. Carbohydrates and lipids were the main
22
macromolecules changing during biofilm maturation. Our results revealed that the architecture of
23
microalgae biofilms is species-specific. However, time is similarly affecting the structural and
24
biochemical parameters.
25
Keywords: biofilm; microalgae; architecture, confocal laser scanning microscopy,
FTIR-26
spectroscopy
27
1. Introduction
28
In the last decades microalgae have been recognized as a valuable source of bio-products such
29
as pigments, anti-oxidants and food supplements and they have gained popularity in a wide range
30
of commercial activities. In conventional photobioreactors (PBRs), microalgae present low biomass
31
concentrations (1-3 g · L-1; [1,2]) and 12 to 2000 L of liquid medium are required for the production of
32
1 Kg of microalgae dry mass [3]. This high water fraction requires energetic expenses for culture
33
agitation (up to 385.71 MJ · Kg-1; [2]) and for biomass harvesting, dewatering and drying (up to 82 MJ
34
· Kg-1; [2]). Biomass production in typical PBRs is therefore constrained by high energy and operating
35
costs [4].
36
Biofilm-based cultivation systems are promising technologies overcoming the drawbacks of
37
conventional PBRs. Such systems can reach high productivities (up to 35 g DW · m-2 · day-1) and
38
biomass concentration (up to 96 g · L-1; [2]). Furthermore, harvesting is simply carried out by scraping
39
the attached biomass with minimal energy demand [3]. Finally, there is an increasing interest from
40
the industrial sector about the great variety of molecules excreted by microalgae when developing
41
biofilms [5]. Biofilm-based systems seem therefore to address most of the challenges of suspended
42
cultures.
43
In a biofilm, microbial cells are associated with a surface and enclosed in a matrix, which is
44
mainly composed of water, polysaccharides, proteins and nucleic acids [6]. The spatial arrangement
45
of microorganisms and matrix components define the size and quantity of voids and channels,
altering in turn the transport of nutrients and gases [7]. The biofilm architecture induces therefore
47
marked gradients of nutrients, gases and light along depth, inducing the cells to acclimate or displace
48
in order to maintain an optimal growth [8,9]. Therefore, structural data are of major importance to
49
better understand the complex behavior of biofilms (i.e. development and activity) and to improve
50
productivity of biofilm-based technologies.
51
Structural changes in bacteria biofilms have been well characterized experimentally under
52
several growth conditions, and it has been shown that the architecture is strongly species and strain
53
dependent [10–13]. From a compositional point of view, it has been shown that changes of structural
54
parameters in bacterial biofilms are strongly correlated to the biochemical composition of
55
exopolymers [14–17]. Phototrophic biofilms, especially microalgae biofilms, have been far less
56
studied [8,18–22]. In particular, little is known about the link between architecture and extracellular
57
polymeric substances production for different species. In addition, the role played by the matrix in
58
biofilm development has been only addressed in studies regarding mixed communities (i.e. bacteria,
59
microalgae etc.) [8,23,24], even though microalgae are known to excrete exopolymers with specific
60
carbohydrates:proteins:lipids:nucleic acids ratios [25,26].
61
In this work, we aimed therefore at better understanding how various microalgae monospecific
62
biofilms differ in their architecture and composition depending on the species. Four biofilm-forming
63
microalgae species of actual or potential biotechnological interest were selected, including two green
64
algae, a red algae and a diatom. Biofilm structural dynamics and macromolecular composition were
65
characterized by a combination of non-destructive techniques including confocal laser scanning
66
microscopy (CLSM, which allows to characterize several structural parameters such as biovolume,
67
thickness, roughness and diffusion distance) and vibrational spectroscopy (ATR-FTIR spectroscopy).
68
2. Materials and Methods
69
2.1. Microalgae strains and planktonic culture maintenance
70
Chlorella vulgaris SAG 211-11b (Göttingen, Germany) was grown in 3N-Bristol [27], the marine
71
strain Chlorella autothrophica CCMP 243 (Bigelow, Maine, USA) was grown in Artificial Sea Water
72
[28], whereas the diatom Cylidrotheca closterium AC170 (Caen, France) and Porphyridium purpureum
73
SAG 1380-1e (Göttingen, Germany) were cultivated in filtered natural seawater. The marine media
74
were supplemented with Walne‘s medium [29]; 1mL · L-1). All biofilms were inoculated from
75
suspended stock cultures grown in a PSI MC1000 multicultivator (Photon systems instruments,
76
Czech Republic) in borosilicate tubes filled with 70 mL of growth medium. The cultures were bubbled
77
and maintained semi-continuously at 25°C under a continuous photon flux density of 80 µmol
78
photons · m-2 · s-1. Cells from the stock cultures were harvested during the exponential phase (cell
79
density of 2-3 · 106 cell · mL-1).
80
2.2. Biofilms cultivation: inoculum, initial adhesion and growth
81
Biofilms were grown in polystyrene µClear ® 96-well microplates (Grenier Bio-one, France). The
82
inoculum was prepared by diluting a volume of suspended cells (see above) to a final concentration
83
of 1 · 106 cell · mL-1 (1 · 105 cell · mL-1 for C. closterium) and by transferring 250 µL of such suspension
84
in the wells. This cell concentration corresponded to similar starting biovolume for all the species (~5
85
µm3 · µm-2). The cells were then left for 24 hours adhering to the surface of the wells and subsequently
86
200 µL of the medium were removed in order to eliminate any unattached cell. After the first 24
87
hours, 80 µL of medium were removed and replaced with new medium every two days to
88
compensate for evaporation and to buffer nutrient and CO2 limitations. A continuous photon flux
89
density of 100 µmol photons · m-2 · s-1 was used. Light (PAR 400-700 nm) was homogeneously
90
provided by two sets of light emitting diode (Alpheus LED, Montgeron, France). Biofilms growth
91
was monitored for 11 days and each day the biofilms were scanned using CLSM to detect cells signal.
92
At day 2, 7 and 11 the biofilms were also stained to characterize the matrix and samples were
93
harvested for ATR-FTIR spectroscopy.
2.3. Confocal laser scanning microscopy (CLSM): cells and matrix characterization
95
Images (512 · 512 pixels) were acquired using an inverted Zeiss LSM700 confocal microscope
96
(Carl Zeiss microscopy GmbH, Germany) controlled using the Zen 10.0 software black edition (Carl
97
Zeiss microscopy GmbH, Germany). All biofilms were scanned with a LD Plan-Neofluar 20x/0.4 Korr
98
M27 objective with a 0.4 N.A. (numerical aperture). Each image was 638 · 638 µm in size with a z-step
99
of 3.94 µm. The settings of the confocal microscope are reported in Table S1. After preliminary trials,
100
a low magnification lens was preferred to a higher one (e.g. 63x), because allowing to scan wider
101
biofilm areas (essential to properly capture microalgae cell patterns) and to acquire z-stacks over the
102
whole biofilm depth. However, we have to point out that this choice comes with side effects, such as
103
a greater point spread function and a lower resolution of the images.
104
Two laser lines were used to respectively detect microalgae and the matrix surrounding them.
105
Microalgae cells were observed by detecting chlorophyll a auto-fluorescence. Lectins and dextran
106
(3kDa), both labelled with fluorescein (FITC), were added at day 2, 7 and 11 to detect glycoconjugates
107
and to visualize non-specifically the matrix, respectively [30–33]. The pool of extracellular
108
glycoconjugates (i.e. exopolysaccharides, glycoproteins etc.) specifically detected by the lectins will
109
be identified here as EPS (extracellular polymeric substances). Dextran on the other hand is supposed
110
to diffuse into the channels, voids and to get finally non-specifically trapped into the matrix [30–33].
111
A fresh cocktail of 20 lectins (Kit I, II and III, Vector Laboratories, Peterborough, UK) or dextran were
112
supplied at a final concentration of 13 µg · mL-1. The microplates were then incubated in the dark for
113
30 minutes. Afterwards, the excess of dyes present in the wells was removed by carefully removing
114
140 µL of the medium and by adding other 140 µL of fresh medium (specific for each species) in each
115
well. This process was repeated one time for the dextran and two times for the lectins. We have to
116
point out that since a mixture of lectins was used to detect the matrix, it is possible that the interaction
117
among the single lectins and the competition for similar targets may have occurred.
118
Chlorophyll a was excited with the 639 nm line of a 5 mW solid state diode laser and the emission
119
of chlorophyll a auto-fluorescence was observed using the long pass (LP) filter 615 nm. Lectins and
120
dextran were excited with the 488 nm laser line of a 10 mW solid state diode laser and their
121
fluorescence detected using the band pass (BP) filter 490-530 nm. Unlabeled organisms and wells
122
filled with growth media but not inoculated with microalgae were used as a staining control. Each
123
well was scanned on at least three random positions (three z-stacks) resulting in a total surface area
124
of at least 1.2 mm2.
125
2.4. Image analysis
126
The plug-in COMSTAT 2.1 (Technical University of Denmark; [11]) running in ImageJ 1.48v [34]
127
was used to extract from the images the quantitative parameters typically used to characterize biofilm
128
structures. The complete list of parameters is reported in Table S2. Images binarization was
129
automatically computed in the plug-in by selecting a threshold value using the Otsu algorithm [35]
130
and the function “connected volume filtering” was unchecked.
131
Since the auto-fluorescence of the cells comes from the chlorophyll within the chloroplasts, we
132
have to point out that the structural parameter calculated from the images reflect such organelle
133
rather than the whole cell, even though the overlapping of fluorescence and transmission images
134
revealed good matching of the two acquisition mode (data not shown). However, to be consistent
135
with the terminology present in most of the literature, we considered that the auto-fluorescence of
136
the chlorophyll quantifies the cells.
137
138
2.5. ATR-FTIR spectroscopy
139
At day 2, 7 and 11, the biofilms were scrapped from four wells for each species. The samples
140
were centrifuged at 8000 · g for 5 minutes and the supernatant removed. After that, 1 mL of distilled
141
water in the case of C. vulgaris and 1 mL of a solution of NaCl (35 g · L -1) for the marine species were
142
used to wash the biofilm suspensions from salts that would otherwise interfere with the cell and
matrix spectral signature. Afterward, the pellet was re-suspended in 5-10 µL of distilled water or
144
NaCl and 1.5 µL were transferred on a 45° ZeSe flat crystal of an ATR-FTIR PerkinElmer
Spectrum-145
two spectrometer (PerkinElmer, Waltham, USA) and the sample was dried at room temperature for
146
20 minutes. Spectra were acquired in the range 4000 and 400 cm-1 using 32 accumulations at a spectral
147
resolution of 4 cm-1. Before each measurement, the empty crystal was measured using the same
148
instrumental setting and used as a blank.
149
Spectra were baselined using the rubberband algorithm and the ratios between the main
150
macromolecular pool (proteins, lipids and carbohydrates) were calculated as the ratios between the
151
maximum absorption values for the spectral ranges corresponding to each macromolecular pool:
152
proteins (Amide I; 1700-1630 cm-1), lipids (C=O; 1750-1700 cm-1) and carbohydrates (C-O-C, C-C and
153
Si-O-Si in diatoms; 1200-950 cm-1). Since no separation between cells and matrix components was
154
performed, the spectra reflected both the physiological changes occurring in the cells and those
155
related to EPS.
156
2.6. Statistics
157
Statistics was performed using GraphPad prism 5.0 (San Diego, CA, USA) and R [36]. One-way
158
and two-way ANOVA were used to test the statistical significance of mean differences among
159
different species and over time. The level of significance was always set at 5%. The logistic function
160
[37,38] was fit to the biovolume vs. time curves and the maximal cell biovolume (i.e. the biovolume
161
at the plateau) and the specific growth rate (µ) were obtained in order to make quantitative
162
comparisons between the species.
163
Correlation matrices, using the Pearson’s coefficient, were computed using the package
164
“corrplot” [39] present in R to investigate the relationship among structural parameters (obtained
165
from CLSM) and biofilms macromolecular composition (FTIR ratios).
166
All results are reported as mean and standard deviations of several independent biological
167
replicates. Biofilm dynamics were repeated on at least four independent microplates. In each
168
microplate, for each species and for each time point, at least three separate wells were analyzed by
169
CLSM. In each well, at least three randomly chosen biofilm areas were scanned.
170
3. Results
171
3.1. Biofilm development over time: structural characteristics
172
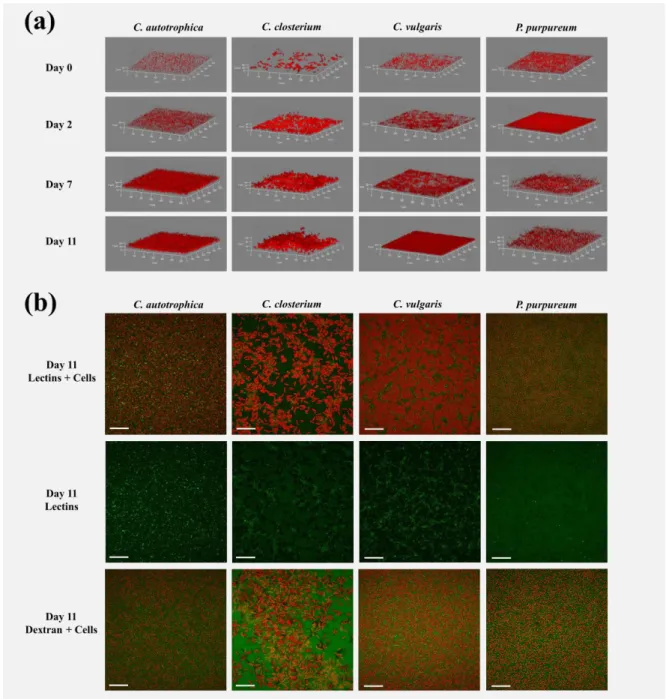
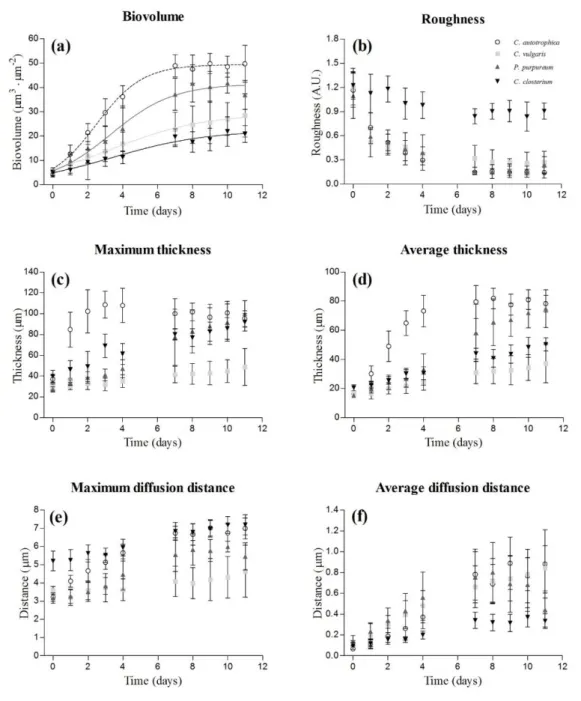
Examples of 3D biofilm reconstructions are reported in Figure 1a. The biovolume of the cells
173
within the biofilm increased over time and after seven days the plateau was reached for all the species
174
(Figure 2a). C. autotrophica and P. purpureum exhibited the highest biovolume, whereas C. vulgaris and
175
C. closterium presented almost 50% lower biovolume. C. autotrophica also exhibited the highest growth
176
rate whereas no significant difference was found among the other microalgae (Table 1 and Figure 2a;
177
p> 0.05).
179
Figure 1. Representative three-dimensional reconstructions of the microalgae biofilms (a) and maximum
180
intensity projection (b) of cells (red signal), lectins (green signal) and dextran (green signal) signals of the biofilms
181
at day 11. In panel (a), day 0 represents the inoculum, day 2, 7 and 11 are the days at which the biofilms were
182
stained and analyzed by ATR-FTIR spectroscopy. The brightness of the images was adjusted for better
183
visualization. Images size in (a) and (b) is 638 · 638 µm. The XY ticks interval in (a) is 100 µm and the scale bar
184
in (b) is 100 µm.185
186
187
188
189
190
191
192
193
194
195
196
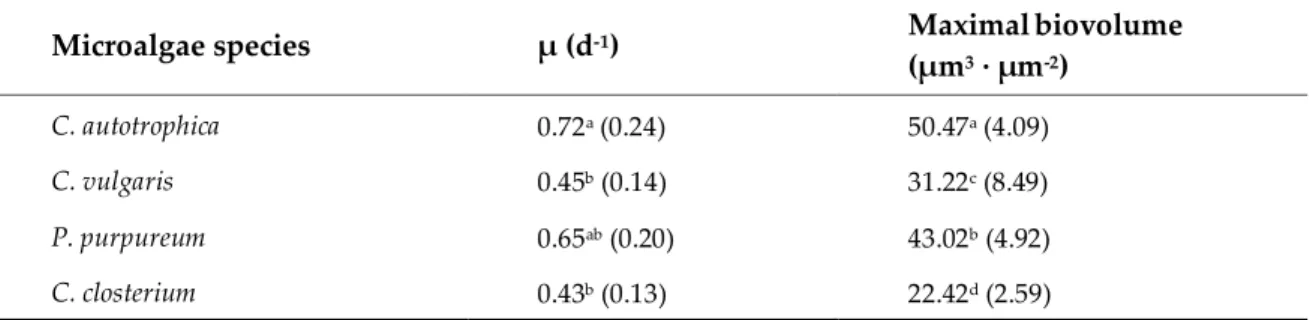
Table 1. Growth parameters (growth rate and maximal biovolume) obtained by fitting the logistic
197
regression to the biovolume vs. time curves. Data are reported as the mean and standard deviation of at least
198
nine independent biological replicates. Different letters represent statistically different means (p<0.05) as
199
determined by pair-wise comparisons after one-way ANOVA.
200
Microalgae species µ (d-1) Maximalbiovolume
(µm3 · µm-2) C. autotrophica 0.72a (0.24) 50.47a (4.09) C. vulgaris 0.45b (0.14) 31.22c (8.49) P. purpureum 0.65ab (0.20) 43.02b (4.92) C. closterium 0.43b (0.13) 22.42d (2.59)
201
Roughness presented an opposite trend to biovolume and decreased (from 1.2 to 0.2 a.u.) over
202
time in C. autotrophica, C. vulgaris and P. purpureum. The roughness coefficient of C. closterium instead,
203
remained stable at values around one (Figure 2b).
204
Over time, the increase in biomass resulted in a thickening of the biofilms (Figure 2c,d). C.
205
autotrophica developed the thickest biofilms (~100 µm) and its maximum thickness remained stable
206
over time. P. purpureum and C. closterium presented a similar increase of the maximum thickness
207
reaching values like those of C. autotrophica. C. vulgaris presented thinner biofilms with a maximum
208
thickness around 30-40 µm. The average thickness of C. autotrophica increased rapidly during the first
209
four days and then levelled off around 80 µm at day 7. P. purpureum, C. closterium and C. vulgaris
210
exhibited a more linear increase of the average thickness. P. purpureum reached a similar thickness to
211
that of C. autotrophica whereas C. closterium and C. vulgaris at the end presented 40-50% lower
212
thicknesses with respect to C. autotrophica.
213
The maximum diffusion distance increased over time in all the species but C. vulgaris (Figure
214
2e). At the end of the assay C. autotrophica and C. closterium presented similar values and reached the
215
highest values among all species, followed by P. purpureum and C. vulgaris. The average diffusion
216
distance followed a similar pattern to biovolume: it increased rapidly the first four days and then
217
leveled off from day 7 (Figure 2f). C. autotrophica, C. vulgaris and P. purpureum presented comparable
218
average diffusion distance (0.6-0.9 µm) whereas C. closterium exhibited the lowest (0.1-0.3 µm; p<0.05).
220
Figure 2. Dynamics of the structural parameters obtained from the z-stacks acquired at the CLSM:
221
biovolume (a), roughness (b), maximum thickness (c), average thickness (d), maximum diffusion
222
distance (e) and average diffusion distance (f). The results are reported as the mean and standard
223
deviation of 12 independent biological replicates. The fitting of the logistic model is also presented
224
for the biovolume.
225
3.2. Matrix characterization: lectins and dextran volumes
226
In order to characterize the matrix of the biofilms, the volume of binding lectins and of dextran
227
was quantified. The volume of lectins reflected the fraction of glycoconjugates (EPS) in the matrix
228
and dextran was used to quantify voids, water channels and non-specifically the whole matrix
229
(Figure 1b).
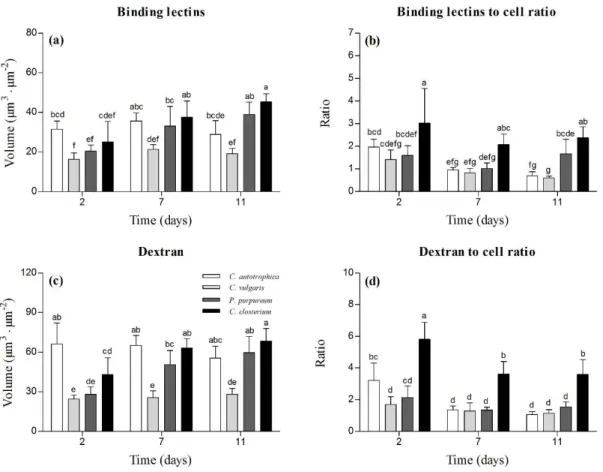
230
C. vulgaris presented the lowest amount of EPS (Figure 3a), whereas it increased over time in P.
231
purpureum and C. closterium biofilms, which volume of EPS doubled from day 2 to day 7. No temporal
232
change was observed for C. autotrophica and C. vulgaris (p>0.05). C. closterium presented the highest
233
lectins to cells ratio (Figure 3b). Over time, C. autotrophica exhibited a decrease over time in the lectins
234
to cells ratio (p<0.05) whereas in the other species the ratio remained stable.
236
Figure 3. Structural parameters characterizing the biofilm matrix at day 2, 7 and 11. Volume of
237
binding lectins ((a); specifically binding to glycoconjugates), lectins to cells ratio (b), volume of
238
dextran ((c); used to stain non-specifically the matrix), and dextran to cell ratio (d). The results are
239
reported as the mean and standard deviation of at least four independent biological replicates. Bars
240
with different letters represent statistically different means (p<0.05) as determined by pair-wise
241
comparisons after two-way ANOVA.
242
At day 2, the volume of dextran was the highest in C. autotrophica biofilms (~65 µm3 · µm-2). P.
243
purpureum and C. closterium presented 50% and 30% lower volume of dextran in their matrix, but at
244
day 7 and 11, they approached the values of C. autotrophica (Figure 3c). C. vulgaris always presented
245
the lowest volume of dextran in the matrix (~30 µm3 · µm-2). In C. autotrophica and C. vulgaris, no
246
significant change was observed over time (Figure 3c). Similarly to lectins, the dextran to cells ratio
247
was always the highest in C. closterium and it decreased from day 2 to 7 and then levelled off. A
248
similar ratio was found for C. autotrophica C. vulgaris and P. purpureum. C. autotrophica presented a
249
decreasing trend from day 2 to day 7 similar to C. closterium. C. vulgaris and P. purpureum biofilms
250
did not show any significant change over time of the dextran to cells ratio (Figure 3d).
251
3.3. Areal coverage over depth: cells vs. matrix vertical profiles
252
Regardless of the species, the maximum of cell density was reached at day 2, at a distance from
253
the substratum of 10 µm, where the cells were already covering almost 50% of the area, except for C.
254
closterium that only covered 30% of the area (Figure 4g). On the other hand, during maturation, the
255
maximal percentage of cell coverage moved at a greater distance (30-40 µm) above the substratum
256
and the depth at which it was reached and the percentage of coverage were species-specific (ranging
257
from 40 to 90% of covered area; Figure 4).
259
Figure 4. Vertical profiles of cells (a, c, e, g) and EPS (b, d, f, h) coverage of four different monospecific
260
microalgae biofilms after 2, 7 and 11 days of maturation. The vertical profiles are reported as the
261
percentage of coverage of cells or of EPS obtained from the z-stacks acquired at the CLSM. The vertical
262
profiles are reported as the mean and standard deviation of at least four independent biological
263
replicates.
264
Dextran and lectins presented comparable distributions over depth (Figure 4b,d,f,h and Figure
265
S1). Interestingly, although the cells profile over depth changed as a function of time, the highest
266
density of EPS and voids seemed to be positioned close to the substratum (20-30 µm) at all time points
267
and for all the species.
268
In addition, the depth of maximum cells density presented a positive correlation with the
269
average biofilm thickness (R2 = 0.78, p=0.0001). On the other hand, for the EPS the regression slope
270
was not significantly different from zero (Figure S2; R2 = 0.005, p=0.81).
271
3.4. Biofilm biochemical characterization by ATR-FTIR spectroscopy and correlation analysis with structural
272
data
273
The average FTIR spectra of the biofilms at the different sampling times (day 2, 7 and 11) are
274
reported in Figure S3. C. autotrophica and P. purpureum were the species that presented the greatest
275
macromolecular changes along time.
276
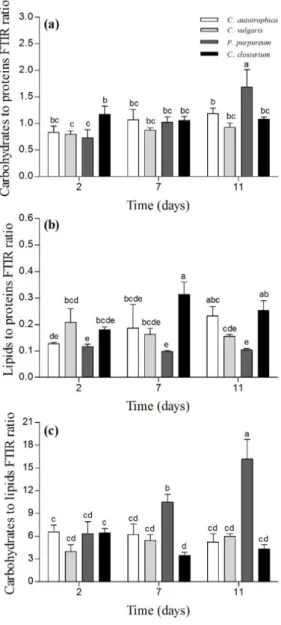
Similar carbohydrates to proteins ratios were observed for all the samples and the ratio did not
277
change in C. vulgaris, C. closterium and C. autotrophica (Figure 5a; p>0.05). In contrast for P. purpureum,
278
the carbohydrates to proteins ratio was 50% higher at day 11 than that at day 2 (Figure 5a; p<0.05). P.
279
purpureum and C. vulgaris biofilms did not exhibit any change in the lipids to proteins ratio (Figure
5b; p>0.05). For C. autotrophica biofilms, the lipids to proteins ratio increased by 50% at day 11
281
compared to day 2 (Figure 5b; p<0.05) and for C. closterium it increased by 30% at day 7 compared to
282
day 2.
283
284
Figure 5. Macromolecular composition of the biofilms after 2, 7 and 11 days of maturation. The panel
285
(a) depicts the carbohydrates to proteins ratio, the panel (b) depicts the lipids to proteins to ratio and
286
the panel (c) represents the carbohydrates to lipids ratio. The results are reported as the m ean and
287
standard deviation of at least four independent biological replicates. Bars with different letters
288
represent statistically different means (p<0.05) as determined by pair-wise comparisons after the
two-289
way ANOVA.
290
In C. autotrophica and C. vulgaris biofilms, the carbohydrates to lipids ratio did not change over
291
time (p>0.05). For P. purpureum it tripled between day 2 and day 11. In C. closterium, the ratio was
292
lower at day 7 compared to day 2 (almost 50%), but no difference was found between day 11 and day
293
2 (Figure 5c).
294
A correlation analysis was carried out to identify the possible correlations among the
295
macromolecular ratios and the matrix of structural data (Figure S4). In P. purpureum, the EPS and
296
dextran volumes were positively correlated to the carbohydrates to proteins and to the carbohydrates
297
to lipids ratios whereas they were negatively correlated to the lipids to proteins ratio. In all the other
species, only minor correlations were found between matrix components and the macromolecular
299
pools (Figure S4). In contrast, for these species the macromolecular ratios were correlated to the
300
structural parameters obtained from cells autofluorescence such as thickness, biovolume, diffusion
301
distance and roughness (Figure S4).
302
4. Discussion
303
Our results show that the architecture of microalgae biofilms is species dependent. But the
304
structure evolution over time seemed to follow some general common rules that resemble those
305
described for bacteria and fungi [11,40–42].
306
During the first stages of substrate colonization the biofilms were irregular in their surfaces (i.e.
307
high roughness), thin and for some of the species the volume of EPS was higher than that of the cells
308
(Figure 2 and 3). As the biofilms matured, the biovolume increased reflecting active cell division,
309
similarly to what was reported for phototrophic biofilms by Mueller et al. [8] and Kernan et al. [20].
310
Mueller et al. [8] reported a linear increase whereas our growth curves and those from Kernan et al.
311
[20] reached a plateau (Figure 2a). Mueller et al. [8] focused on a natural mixed community including
312
bacteria and different species of microalgae. Therefore, the species succession over time with different
313
physiological requirements may have led to a continuous growth. In our case and for Kernan et al.
314
[20], the biofilms were composed by a single species that may have experienced over time energy or
315
nutrients limitation leading to a slowdown of the growth. Since nutrients were replenished every two
316
days, light was probably the limiting factor. Barranguet et al. [23] reported for instance that light was
317
attenuated up to 90% in mature phototrophic biofilms [23], whereas Schnurr et al. [43] reported that
318
the transmitted light for a biofilm with a thickness of 100 µm (similar to the ones reported in this
319
study) was only 12% of the incident light. This means that for a photon flux density of 100 µmol · m
-320
2 · s-1 the cells in the deeper layers of the biofilm would receive only 12 µmol · m-2 · s-1, an intensity far
321
below the light compensation point measured for example in C. vulgaris biofilm (30-60 µmol photons
322
· m-2 · s-1; [44]).
323
The roughness of the biofilms decreased over time along with the progressive filling of the initial
324
voids by new daughter cells (Figure 2b). A similar behavior has been described for natural
multi-325
specific river biofilms [45] and for bacteria biofilms [10,41]. Mueller et al. [8] on the other hand,
326
reported a positive correlation between biovolume and roughness and a parallel increase of diatoms
327
over time. This is in agreement with the biofilm of the diatom C. closterium that exhibited only minor
328
changes of roughness over time (Figure 2b). The progression from rough to smoother surfaces as a
329
biofilm mature has been proposed to be dependent either on cells metabolic rate or on the maximum
330
internal transport rate of nutrients [46,47]. In the case of cells with low metabolic activity (and
331
therefore high nutrient availability) the valley between the biofilm peaks grow and merge with
332
adjacent peaks decreasing the roughness of a biofilm. Cells with high metabolic rate might become
333
nutrient limited and division will proceeds only at the biofilm peaks (i.e. along the vertical nutrient
334
gradients; [46,47]), inducing the formation of finger-like structures. Based on these observations, the
335
development of smoother biofilms along time, in P. purpureum, C. vulgaris and C. autotrophica, as
336
compared to the rougher structured biofilms in C. closterium, may reflect different cell metabolic rates.
337
Further metabolic investigations, such as intracellular measurements or O2 evolution, will be
338
necessary to validate these conclusions.
339
As the majority of studies on photosynthetic biofilms focused on natural mixed communities
340
(i.e. formed by bacteria and microalgae), little is known about EPS dynamics in microalgae biofilms.
341
Here, we report the ability of microalgae to set up a supporting matrix and the dynamics of EPS
342
during biofilm development. Interestingly, whereas the dynamics of cells were similar among all the
343
species (Figure 2), those of EPS were more species-specific (Figure 3a): the two green algae did not
344
show any quantitative change of the EPS whereas P. purpureum and C. closterium presented a greater
345
volume of EPS over time. These different trends are in agreement with the great variety of dynamics
346
reported elsewhere as a function of the community composition. Trends of EPS production in
347
photosynthetic biofilms present in the literature are indeed very disparate [8,23,24]. Ratios of matrix
348
components (either considering lectins or dextran) to cells were not significantly different over time
for all species, which may indicate a stable physiological state of the cells within the biofilm.
350
Interestingly, they were positively correlated to the biofilm roughness coefficient, indicating that
351
irregular surfaces were associated with high EPS content and low cell biovolume. Similar ratios of
352
EPS to cells have been reported for stream mixed biofilms by Battin et al. [45], which proposed that
353
high EPS content may be advantageous for the attachment of the cells and first colonization of the
354
substratum.
355
During biofilm development, several processes such as cell growth, EPS excretion or
356
consumption [48], as well as the establishment of chemical and physical gradients may be responsible
357
for the vertical distribution of cells and matrix components [9]. The few literature data about
z-358
profiles in photosynthetic biofilms indicate that the distribution of cells and EPS is very much
359
dependent on the culture conditions and on the biofilm nature (bacteria, algae or mixed
360
communities), nevertheless some patterns can be drawn [8,18,20,23]. The maximal coverage for
361
photosynthetic organisms seems to occur within the first 40 µm from the substratum, whereas EPS
362
seem to match the cells position in young biofilms and to be mostly placed in layers above the cells
363
in older biofilms. In our work, at day 2 the cell z-profile was consistent with the patterns described
364
in the literature: maximal areal coverage of the cells positioned at 20 µm from the substratum (Figure
365
4) and greatest coverage of EPS typically co-localized with the cells in proximity of the substratum
366
(~20 µm). This means that the matrix components were mostly interspersed between the cells [49].
367
Along time, the maximal areal coverage of the cells moved at greater distances from the substratum
368
as described in Cole et al. [18] but the location of the maximum EPS density remained stable over
369
time (Figure 4). It is therefore likely that the production of EPS in deep layers may have been
370
responsible for the upward growth of the biofilm by global advection [48,50] This is also supported
371
by the fact that the maximum cell coverage moved upward as a function of the biofilm thickness
372
whereas the EPS maximal coverage remained stable (Figure S2).
373
In bacteria, changes in biofilms structures have been reported to be strongly related to qualitative
374
shift in the macromolecular composition of the EPS, which in turn may alter biofilms functions and
375
properties [14,15,17,51]. In order to evaluate the relationships among macromolecules and structures
376
in microalgae biofilms, a correlation analysis using the CLSM and FTIR results was performed. Lipids
377
and/or carbohydrates changed in concentration as the biofilms matured and their architecture
378
became more complex (Figure 5 and S3). The lack of correlation between the macromolecular changes
379
and the EPS and dextran volumes (except for P. purpureum) might indicate a reallocation of carbon in
380
the cells rather than changes in matrix components. P. purpureum behaved differently, and such
381
changes were positively correlated to the EPS and dextran volumes (Figure S4), suggesting an
382
increase in glycoconjugates in the matrix as the biofilm matured [52].
383
Concluding, the development, architecture and macromolecular composition of monospecific
384
microalgae biofilms seem to be strongly species-dependent. The selection of a microalgae strain for
385
further cultivation in biofilm-based systems is therefore a crucial step for the whole process as specific
386
structural features maybe more or less advantageous under a certain set of culture conditions. Future
387
studies will be required to address how hydrodynamics and the fluctuating light conditions,
388
characteristic of outdoor cultivation systems, influence the structures and composition of algal
389
biofilms. The data recorded in this study may be used to feed and calibrate photosynthetic growth
390
models to better understand the mechanisms behind biofilm development under different conditions
391
[53]. Extension of these models for large-scale production can be used for optimal process design or
392
to guide the process operations. Furthermore, microfluidic tools or larger flow-cells are promising
393
tools for completing the picture and eventually providing an overview of the advantages and pitfalls
394
of using microalgae biofilm-based system [22]
395
Supplementary Materials: The following are available online at www.mdpi.com/xxx/s1, Figure S1: Vertical
396
profiles of cells and dextran, Figure S2: Dependency of the depth of maximal coverage of cells and
397
glycoconjugates (EPS) as a function of the average biofilm thickness, Figure S3: ATR-FTIR spectra of microalgae
398
biofilms, Figure S4: Correlation plot, Table S1: Instrumental settings of the confocal microscope, Table S2: Biofilm
399
structural parameters calculated using COMSTAT 2.1.
400
Author Contributions: Conceptualization, Andrea Fanesi, Armelle Paule, Olivier Bernard, Romain Briandet and
401
Filipa Lopes; Data curation, Andrea Fanesi and Armelle Paule; Formal analysis, Andrea Fanesi and Armelle
402
Paule; Funding acquisition, Olivier Bernard, Romain Briandet and Filipa Lopes; Methodology, Andrea Fanesi
403
and Armelle Paule; Supervision, Olivier Bernard, Romain Briandet and Filipa Lopes; Writing – original draft,
404
Andrea Fanesi and Armelle Paule; Writing – review & editing, Andrea Fanesi, Olivier Bernard, Romain Briandet
405
and Filipa Lopes.
406
Funding: This work has benefited from the financial support of the LabeX LaSIPS project AlgaeBiofilm and
407
Greenbelt managed by the French National Research Agency (ANR).
408
Acknowledgments: The authors acknowledge Cyril Breton and Thierry Martin for the technical support
409
regarding confocal microscopy, image analysis and light systems.
410
Conflicts of Interest: The authors declare no conflict of interest. The funders had no role in the design of the
411
study; in the collection, analyses, or interpretation of data; in the writing of the manuscript, or in the decision to
412
publish the results.
413
References
414
1. Jorquera, O.; Kiperstok, A.; Sales, E.A.; Embiruçu, M.; Ghirardi, M.L. Comparative energy life-cycle
415
analyses of microalgal biomass production in open ponds and photobioreactors. Bioresour. Technol. 2010,
416
101, 1406–1413.
417
2. Ozkan, A.; Kinney, K.; Katz, L.; Berberoglu, H. Reduction of water and energy requirement of algae
418
cultivation using an algae biofilm photobioreactor. Bioresour. Technol. 2012, 114, 542–548.
419
3. Berner, F.; Heimann, K.; Sheehan, M. Microalgal biofilms for biomass production. J. Appl. Phycol. 2015, 27,
420
1793–1804.
421
4. Slade, R.; Bauen, A. Micro-algae cultivation for biofuels: Cost, energy balance, environmental impacts and
422
future prospects. Biomass and Bioenerg. 2013, 53, 29–38.
423
5. Di Pippo, F.; Ellwood, N.T.W.; Gismondi, A.; Bruno, L.; Rossi, F.; Magni, P.; De Philippis, R.
424
Characterization of exopolysaccharides produced by seven biofilm-forming cyanobacterial strains for
425
biotechnological applications. J. Appl. Phycol. 2013, 25, 1697–1708.
426
6. Sutherland, I.W. The biofilm matrix – an immobilized but dynamic microbial environment. Trends
427
Microbiol. 2001, 9, 222–227.
428
7. Beer, D. de; Stoodley, P.; Roe, F.; Lewandowski, Z. Effects of biofilm structures on oxygen distribution and
429
mass transport. Biotechnol. Bioeng. 1994, 43, 1131–1138.
430
8. Mueller, L.N.; de Brouwer, J.F.; Almeida, J.S.; Stal, L.J.; Xavier, J.B. Analysis of a marine phototrophic
431
biofilm by confocal laser scanning microscopy using the new image quantification software PHLIP. BMC
432
Ecol. 2006, 6, 1.
433
9. Stewart, P.S.; Franklin, M.J. Physiological heterogeneity in biofilms. Nat. Rev. Microbiol. 2008, 6, 199–210.
434
10. Bridier, A.; Dubois-Brissonnet, F.; Boubetra, A.; Thomas, V.; Briandet, R. The biofilm architecture of sixty
435
opportunistic pathogens deciphered using a high throughput CLSM method. J. Microbiol. Methods 2010, 82,
436
64–70.
437
11. Heydorn, A.; Nielsen, A.T.; Hentzer, M.; Sternberg, C.; Givskov, M.; Ersbøll, B.K.; Molin, S. Quantification
438
of biofilm structures by the novel computer program COMSTAT. Microbiology 2000, 146, 2395–2407.
439
12. Srinandan, C.S.; Jadav, V.; Cecilia, D.; Nerurkar, A.S. Nutrients determine the spatial architecture of
440
Paracoccus sp. biofilm. Biofouling 2010, 26, 449–459.
441
13. Staudt, C.; Horn, H.; Hempel, D.C.; Neu, T.R. Volumetric measurements of bacterial cells and extracellular
442
polymeric substance glycoconjugates in biofilms. Biotechnol. Bioeng. 2004, 88, 585–592.
443
14. Desmond, P.; Best, J.P.; Morgenroth, E.; Derlon, N. Linking composition of extracellular polymeric
444
substances (EPS) to the physical structure and hydraulic resistance of membrane biofilms. Water Res. 2018,
445
132, 211–221.
446
15. Garny, K.; Neu, T.R.; Horn, H.; Volke, F.; Manz, B. Combined application of 13C NMR spectroscopy and
447
confocal laser scanning microscopy—Investigation on biofilm structure and physico-chemical properties.
448
Chem. Eng. Sci. 2010, 65, 4691–4700.
449
16. Kawaguchi, T.; Decho, A.W. Biochemical characterization of cyanobacterial extracellular polymers (EPS)
450
from modern marine stromatolites (Bahamas). Prep. Biochem. Biotechnol. 2000, 30, 321–330.
451
17. Tan, L.; Zhao, F.; Han, Q.; Zhao, A.; Malakar, P.K.; Liu, H.; Pan, Y.; Zhao, Y. High correlation between
452
structure development and chemical variation during biofilm formation by Vibrio parahaemolyticus. Front.
453
Microbiol. 2018, 9.
454
18. Cole, J.K.; Hutchison, J.R.; Renslow, R.S.; Kim, Y.-M.; Chrisler, W.B.; Engelmann, H.E.; Dohnalkova, A.C.;
455
Hu, D.; Metz, T.O.; Fredrickson, J.K.; et al. Phototrophic biofilm assembly in microbial-mat-derived
456
unicyanobacterial consortia: model systems for the study of autotroph-heterotroph interactions. Front.
457
Microbiol. 2014, 5.
458
19. David, C.; Bühler, K.; Schmid, A. Stabilization of single species Synechocystis biofilms by cultivation under
459
segmented flow. J Ind Microbiol Biotechnol 2015, 42, 1083–1089.
460
20. Kernan, C.; Chow, P.P.; Christianson, R.J.; Huang, J. Experimental and computational investigation of
461
biofilm formation by Rhodopseudomonas palustris growth under Two Metabolic Modes. PLOS ONE 2015, 10,
462
e0129354.
463
21. Norcy, T.L.; Niemann, H.; Proksch, P.; Linossier, I.; Vallée-Réhel, K.; Hellio, C.; Faÿ, F. Anti-biofilm effect
464
of biodegradable coatings based on Hemibastadin derivative in marine environment. Int. J. Mol. Sci. 2017,
465
18, 1520.
466
22. Le Norcy, T.; Faÿ, F.; Obando, C.Z.; Hellio, C.; Réhel, K.; Linossier, I. A new method for evaluation of
467
antifouling activity of molecules against microalgal biofilms using confocal laser scanning
microscopy-468
microfluidic flow-cells. Int. Biodet. Biodegr. 2019, 139, 54–61.
469
23. Barranguet, C.; Beusekom, S.A.M. van; Veuger, B.; Neu, T.R.; Manders, E.M.M.; Sinke, J.J.; Admiraal, W.
470
Studying undisturbed autotrophic biofilms: still a technical challenge. Aquat. Microb. Ecol. 2004, 34, 1–9.
471
24. Neu, T.R.; Swerhone, G.D.W.; Böckelmann, U.; Lawrence, J.R. Effect of CNP on composition and structure
472
of lotic biofilms as detected with lectin-specific glycoconjugates. Aquat. Microb. Ecol. 2005, 38, 283–294.
473
25. de Jesus Raposo, M.F.; de Morais, A.M.M.B.; de Morais, R.M.S.C. Bioactivity and applications of
474
polysaccharides from marine microalgae. In Polysaccharides: Bioactivity and Biotechnology; Ramawat, K.G.,
475
Mérillon, J.-M., Eds.; Springer International Publishing: Cham, 2015; pp. 1683–1727 ISBN
978-3-319-16298-476
0.
477
26. Xiao, R.; Zheng, Y. Overview of microalgal extracellular polymeric substances (EPS) and their applications.
478
Biotechnol. Adv. 2016, 34, 1225–1244.
479
27. Bischoff, H.W.; Bold, H.C. Phycological Studies IV. Some soil algae from enchanted rock and related algal
480
species. University of Texas publication 1963, 6318, 95.
481
28. Lyman, J.; Fleming, R.H. Composition of sea water. J. Mar. Res. 1940, 134–146.
482
29. Walne, P.R. Studies on the food value of nineteen genera of algae to juvenile bivalves of the genera Ostrea,
483
Crassostrea, Mercenaria and Mytilus. Fish. Invest. Ser. 1970, 2 26.
484
30. Assaf, D.; Steinberg, D.; Shemesh, M. Lactose triggers biofilm formation by Streptococcus mutans. Int. Dairy
485
J. 2015, 42, 51–57.
31. Klein, M.I.; Duarte, S.; Xiao, J.; Mitra, S.; Foster, T.H.; Koo, H. Structural and molecular basis of the role of
487
starch and sucrose in Streptococcus mutans biofilm development. Appl. Environ. Microbiol. 2009, 75, 837–841.
488
32. Koo, H.; Xiao, J.; Klein, M.I.; Jeon, J.G. Exopolysaccharides produced by Streptococcus mutans
489
glucosyltransferases modulate the establishment of microcolonies within multispecies biofilms. J. Bacteriol.
490
2010, 192, 3024–3032.
491
33. Lawrence, J.R.; Wolfaardt, G.M.; Korber, D.R. Determination of diffusion coefficients in biofilms by
492
Confocal Laser Microscopy. Appl. Environ. Microbiol. 1994, 60, 1166–1173.
493
34. Schneider, C.A.; Rasband, W.S.; Eliceiri, K.W. NIH Image to ImageJ: 25 years of image analysis. Nat.
494
Methods 2012, 9, 671–675.
495
35. Otsu, N. A treshold selection method from gray-level histograms. 5.
496
36. R Core Team R: A language and environment for statistical computing. 2014, Foundation for Statistical
497
Computing, Vienna, Austria. URL http://www.R-project.org/.
498
37. Tsai, Y.-P. Impact of flow velocity on the dynamic behaviour of biofilm bacteria. Biofouling 2005, 21, 267–
499
277.
500
38. Wang, C.; Miao, L.; Hou, J.; Wang, P.; Qian, J.; Dai, S. The effect of flow velocity on the distribution and
501
composition of extracellular polymeric substances in biofilms and the detachment mechanism of biofilms.
502
Water Sci. Technol. 2014, 69, 825–832.
503
39. Wei, T.; Simko, V. R package “corrplot”: Visualization of a correlation matrix (Version 0.84). 2017, Available
504
from https://github.com/taiyun/corrplot.
505
40. Kolderman, E.; Bettampadi, D.; Samarian, D.; Dowd, S.E.; Foxman, B.; Jakubovics, N.S.; Rickard, A.H.
L-506
Arginine destabilizes oral multi-species biofilm communities developed in human saliva. PLOS ONE 2015,
507
10, e0121835.
508
41. Li, L.; Jeon, Y.; Lee, S.-H.; Ryu, H.; Santo Domingo, J.W.; Seo, Y. Dynamics of the physiochemical and
509
community structures of biofilms under the influence of algal organic matter and humic substances. Water
510
Res. 2019, 158, 136–145.
511
42. Seneviratne, C.J.; Silva, W.J.; Jin, L.J.; Samaranayake, Y.H.; Samaranayake, L.P. Architectural analysis,
512
viability assessment and growth kinetics of Candida albicans and Candida glabrata biofilms. Arch. Oral Biol.
513
2009, 54, 1052–1060.
514
43. Schnurr, P.J.; Espie, G.S.; Allen, D.G. The effect of light direction and suspended cell concentrations on algal
515
biofilm growth rates. Appl. Microbiol. Biotechnol. 2014, 98, 8553–8562.
516
44. Rincon, S.M.; Urrego, N.F.; Avila, K.J.; Romero, H.M.; Beyenal, H. Photosynthetic activity assessment in
517
mixotrophically cultured Chlorella vulgaris biofilms at various developmental stages. Algal Res. 2019, 38,
518
101408.
519
45. Battin, T.J.; Kaplan, L.A.; Newbold, J.D.; Cheng, X.; Hansen, C. Effects of current velocity on the nascent
520
architecture of stream microbial biofilms. Appl. Environ. Microbiol. 2003, 69, 5443–5452.
521
46. Picioreanu, C.; Loosdrecht, M.C.M. van; Heijnen, J.J. A theoretical study on the effect of surface roughness
522
on mass transport and transformation in biofilms. Biotechnol. Bioeng. 2000, 68, 355–369.
523
47. Picioreanu, C.; Loosdrecht, M.C.M.V.; Heijnen, J.J. Effect of diffusive and convective substrate transport on
524
biofilm structure formation: A two-dimensional modeling study. Biotechnol. Bioeng. 2000, 69, 504–515.
525
48. Alpkvist, E.; Picioreanu, C.; Loosdrecht, M.C.M. van; Heyden, A. Three-dimensional biofilm model with
526
individual cells and continuum EPS matrix. Biotechnol. Bioeng. 2006, 94, 961–979.
527
49. Freires, I.A.; Bueno-Silva, B.; Galvão, L.C. de C.; Duarte, M.C.T.; Sartoratto, A.; Figueira, G.M.; Alencar,
528
S.M. de; Rosalen, P.L. The effect of essential oils and bioactive fractions on Streptococcus mutans and Candida
529
albicans biofilms: A confocal analysis available online:
530
https://www.hindawi.com/journals/ecam/2015/871316/ (accessed on Feb 11, 2019).
531
50. Rodriguez, D.; Einarsson, B.; Carpio, A. Biofilm growth on rugose surfaces. Phys. Rev. E 2012, 86, 061914.
532
51. Wagner, M.; Ivleva, N.P.; Haisch, C.; Niessner, R.; Horn, H. Combined use of confocal laser scanning
533
microscopy (CLSM) and Raman microscopy (RM): Investigations on EPS – Matrix. Water Res. 2009, 43, 63–
534
76.
535
52. Fang, F.; Lu, W.-T.; Shan, Q.; Cao, J.-S. Characteristics of extracellular polymeric substances of phototrophic
536
biofilms at different aquatic habitats. Carbohydr. Polym. 2014, 106, 1–6.
537
53. Polizzi, B.; Bernard, O.; Ribot, M. A time-space model for the growth of microalgae biofilms for biofuel
538
production. J. Theor. Biol. 2017, 432, 55–79.
539
540
© 2019 by the authors. Submitted for possible open access publication under the terms and conditions of the Creative Commons Attribution (CC BY) license (http://creativecommons.org/licenses/by/4.0/).