HAL Id: tel-01881352
https://hal.archives-ouvertes.fr/tel-01881352
Submitted on 25 Sep 2018HAL is a multi-disciplinary open access archive for the deposit and dissemination of sci-entific research documents, whether they are pub-lished or not. The documents may come from
L’archive ouverte pluridisciplinaire HAL, est destinée au dépôt et à la diffusion de documents scientifiques de niveau recherche, publiés ou non, émanant des établissements d’enseignement et de
Spectral analysis of the cerebral cortex complexity
Hamed Rabiei
To cite this version:
Hamed Rabiei. Spectral analysis of the cerebral cortex complexity. Numerical Analysis [math.NA]. Aix-Marseille Universite, 2017. English. �tel-01881352�
Aix-Marseille University
Doctoral School of Mathematics and Informatics of
Marseille (ED184)
UFR Science
Institute of Neuroscience of la Timone (INT) Institute of Mathematics of Marseille (I2M)
Laboratory of Information Science and Systems (LSIS)
Thesis presented to obtain the PhD degree of Mathematics and Informatics
Hamed Rabiei
Spectral analysis of the cerebral cortex complexity
To be defended at 26/09/2017 in front of the jury :
Pierre Borgnat ENS of Lyon Rapporteur Umberto Castellani University of Verona Rapporteur Isabelle Bloch LTCI, Telecom ParisTech Examiner Bruno Torresani I2M, Aix-Marseille University Examiner Roberto Toro Institut Pasteur, Paris Examiner Julien Lefèvre LSIS, Aix-Marseille University Supervisor Frédéric Richard I2M, Aix-Marseille University Supervisor Olivier Coulon LSIS, Aix-Marseille University Supervisor
Aix-Marseille Université
École Doctorale en Mathématiques et Informatique de
Marseille (ED184)
UFR Science
Institut de Neurosciences de la Timone (INT) Institut de Mathématiques de Marseille (I2M)
Laboratoire des Sciences de l’Information et des Systèms (LSIS)
Thèse présentée pour obtenir le grade universitaire de docteur en Mathématiques et Informatique
Hamed Rabiei
Analyse spectrale de la complexité du cortex cérébral
Soutenue le 26/09/2017 devant le jury :
Pierre BORGNAT ENS de Lyon Rapporteur Umberto CASTELLANI University of Verona Rapporteur Isabelle BLOCH LTCI, Telecom ParisTech Examinateur Bruno TORRESANI I2M, Aix-Marseille Université Examinateur Roberto TORO Institut Pasteur, Paris Examinateur Julien LEFÈVRE LSIS, Aix-Marseille Université Directeur de thèse Frédéric RICHARD I2M, Aix-Marseille Université Directeur de thèse Olivier COULON LSIS, Aix-Marseille Université Directeur de thèse
Abstract
Surface shape complexity is a morphological characteristic of folded surfaces like the cerebral cortex. There is, however, no universal agreement on the notion of surface complexity and various measures in the literature evaluate different aspects of it. Most of these measures are not based on a clear definition of the surface complexity and are likely to be biased by other geometrical features of a surface e.g. depth of folds or size of surfaces. Moreover, it is not possible to justify what those methods really measure. Consequently, inconsistent results from different measures can be found in the literature.
To address this issue, by investigating advantages and disadvantages of exis-ting measures in the literature, we propose some properties that a standard mea-sure of surface complexity should possess. We then develop methods with two approaches to introduce surface complexity measures that satisfy the proposed properties. The proposed methods are based on the spectral analysis of surfaces which has been shown to be useful to capture relevant shape features.
In the first approach, we propose two clear definitions of the surface com-plexity based on surface bending properties. To quantify these definitions, the recently introduced graph windowed Fourier transform is extended to mesh mo-del of surfaces. Through this local spectral method, we introduce two new local measures of complexity that satisfy most of the suggested standard properties. Especially, they quantify the surface complexity in multi-spatial scales and take into account the inter-subject size variability.
Through some experiments on synthetic surfaces, we show that surface area-based measures of surface complexity may not distinguish deep folds from os-cillating ones with equal area. Furthermore, the proposed method is applied to a database of 124 healthy adult subjects. Our proposed measures appropriately assign low values to deep regular folds such as the insula and the central sulcus and high values to regions consisting of sharp or oscillating folds such as the prefrontal cortex. The effect of the brain volume on the global and local cortical complexity is also studied.
In the second approach, we define the surface complexity by the Hölder re-gularity of fractional Brownian motions defined on manifolds. Then, for the first time, we develop a spectral-regression algorithm to quantify the Hölder regula-rity of a given fractional Brownian surface by estimating its Hurst parameter H. Moreover, we discuss that the estimated H has many properties of a standard
measure of the surface complexity. Inspiring by the fractional Brownian motions in 1D, we give a conjecture on the relationship between H and the fractal di-mension.
The proposed method is evaluated on a set of simulated fractional Brownian spheres. Moreover, by assuming the cerebral cortex to be a fractional Brownian surface, the proposed algorithm is applied to estimate the Hurst parameters of a set of 14 fetal cerebral cortices. The results show consistently the progress of the brain gyrification process in fetal ages. Last but not least, regarding the proposed conjecture, the estimated Hurst parameters are in a good accordance with the fractal dimension of the cerebral cortex, given in the literature.
Keywords : Computational geometry, Shape analysis, Mesh processing,
Sur-face shape complexity, Spectral analysis, Windowed Fourier transform, Gyrifica-tion index, FracGyrifica-tional Brownian surface, Hurst parameter, Cerebral cortex
Table of contents
Abstract 1
List of figures 4
List of tables 4
Introduction 5
1 Gyrification process and measurements 11
1.1 Theories of gyrification 11
1.2 Gyrification measurement : Applications 13
1.2.1 Development and aging 15
1.2.2 Pathologies 16
1.2.3 Miscellaneous factors 17
1.3 Gyrification measurement : Methods 18
1.3.1 Surface area/perimeter-based GIs 19
1.3.2 Curvature-based GIs 23
1.3.3 Fractal dimension-based GIs 25
1.4 Discussion 26
2 Spectral gyrification indices 29
2.1 Spectral surface analysis 30
2.1.1 Laplacian eigenvalues 32
2.1.2 Laplacian eigenvectors 33
2.2 Fourier transform on mesh 37
2.3 Windowed Fourier Transform 42
2.3.1 Extension to graphs 46
2.4 Mesh windowed Fourier transform 49
2.4.1 Discretization of Laplace-Beltrami operator 49
2.4.2 Window function and translation operator 53
2.4.3 Adaptive window function 56
2.4.4 Mesh windowed Fourier transform coefficients 58
2.5 The proposed gyrification indices 61
2.5.2 New gyrification indices 62
2.5.3 Properties of new gyrification indices 66
2.6 Summary 67
3 Results 70
3.1 Synthetic data 70
3.1.1 Wavy surface with varying fold frequency and depth 71
3.1.2 Wavy surfaces with one source of variation 76
3.2 Real data 79
3.2.1 Data and preprocessing 79
3.2.2 Gyrification maps 79
3.2.3 Scaling analysis 83
3.3 Summary and discussion 86
4 Fractional Brownian gyrification index 89
4.1 Fractional Brownian motion 90
4.1.1 Fractional Brownian motion indexed on R 90
4.1.2 Fractional Brownian surfaces 92
4.1.3 Estimation of Hurst parameter for fBm’s indexed on R 96
4.2 The proposed spectral H estimator for fractional Brownian surfaces 97
4.2.1 Scale invariance 112
4.3 Results 113
4.3.1 Synthetic data 113
4.3.2 Fetal data 117
4.4 Discussion and perspective 122
4.4.1 H as a global GI 123
4.4.2 Comparison to fractal dimension 125
4.4.3 Multi-fractional Brownian surfaces and local Hurst parameter127
4.4.4 Limitations of the proposed method 131
Conclusion 132
A Precision of the proposed Hurst parameter estimator 137
List of figures
1.1 Gyrification process from fetal to adult ages 12
1.2 A cross-section of the human head 12
1.3 Three major gyrification hypotheses 14
1.4 Zilles’ GI : a surface perimeter-based GI 19
1.5 Schaer’s and Toro’s GIs : surface area-based GIs 21
1.6 Deep folds versus oscillating folds 22
1.7 Similarity of Schaer’s and Toro’s GI maps 22
1.8 Locality of Schaer’s GI map 23
2.1 Laplacian eigenvectors of a brain surface 34
2.2 Fourier transform of a function defined on a brain surface 38
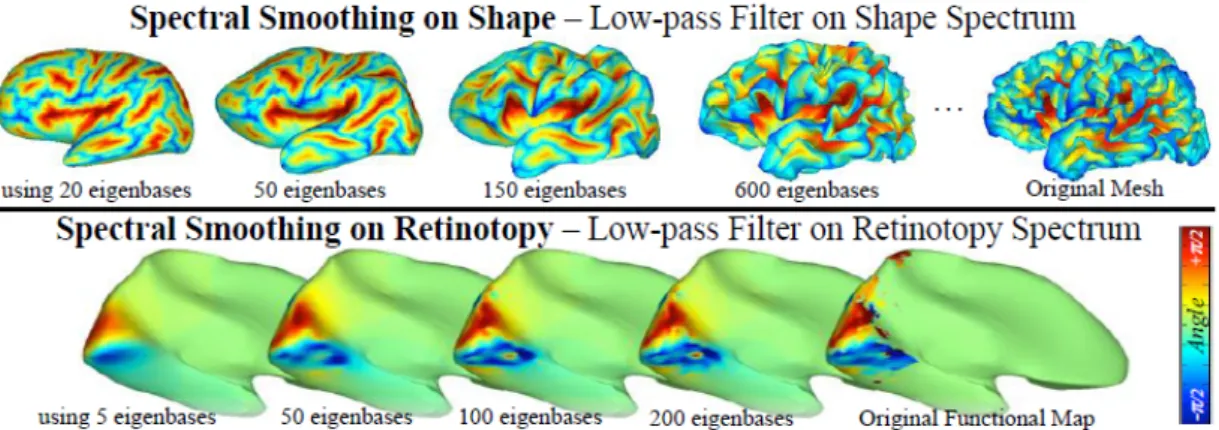
2.3 Spectral smoothing of surfaces and surface maps 39
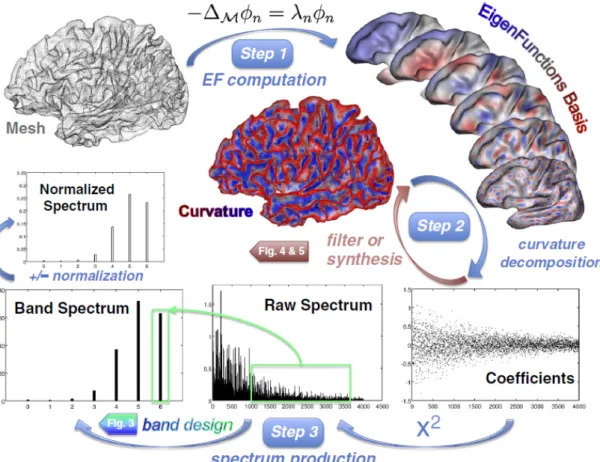
2.4 A scheme of SPANGY method 40
2.5 Spectral parcellation of sulcal regions by SPANGY method 41
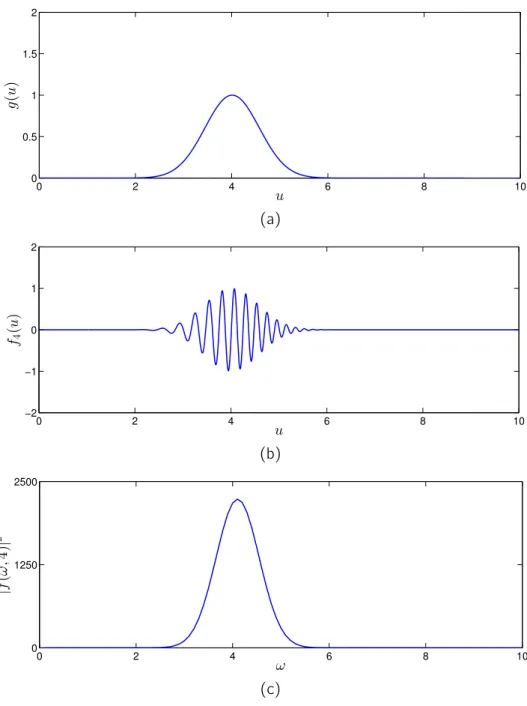
2.6 Fourier transform of a 1D chirp signal 44
2.7 Windowed Fourier transform of a 1D chirp signal 45
2.8 Spectrogram of the windowed Fourier transform of a 1D chirp signal 46
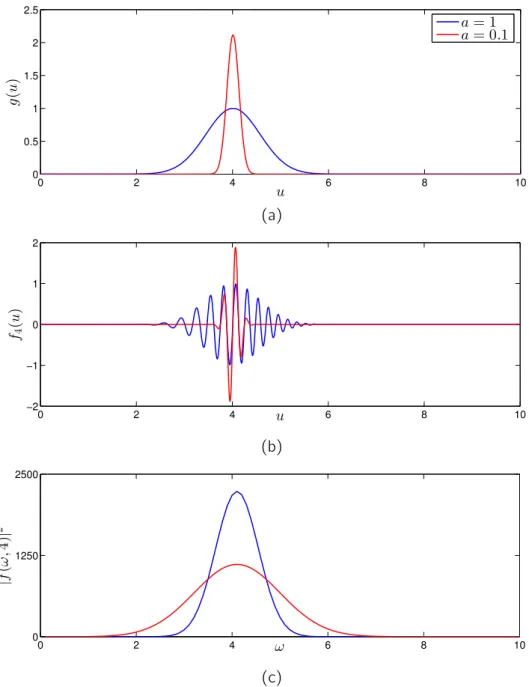
2.9 The effect of window size 47
2.10 Geometry of mesh involved in FE Laplacian 51
2.11 Classic versus adaptive window function 56
2.12 Translation operator 57
2.13 The spread of the adaptive window function in spatial domain 58
2.14 The spread of the adaptive window function in spectral domain 59
2.15 Adaptive window function resembles a Gaussian function 59
2.16 Localization of a function 60
2.17 Local frequency distributions of a function 60
2.18 The mean curvature for a 1D curve and a 2D surface 62
2.19 Two features of surface bending that define the surface complexity 63
2.20 Effect of surface sampling on sGI and wGI 68
3.1 A wavy surface together with its sGI, wGI and Toro’s GI plots 72
3.2 Spectrogram of the wavy surface 75
3.3 A wavy surface with varying fold frequency with its sGI, wGI and
3.4 A wavy surface with varying fold depth with its sGI, wGI and Toro’s
GI plots 78
3.5 Maps of sGI and wGI of an individual cerebral cortex 80
3.6 sGI, wGI and frequency of folds visualized by depth plots 81
3.7 Zoom on mean curvature, sGI and wGI maps of an individual cerebral
cortex 82
3.8 Average maps of sGI, wGI and Toro’s GI across all subjects 84
3.9 Global scaling analysis of sGI and wGI versus hemispheric volume 85
3.10 Local scaling analysis of sGI and wGI versus hemispheric volume 87
4.1 Examples of an fBm defined on a 1D space 92
4.2 Examples of an fBm defined on a sphere surface 95
4.3 A scheme of our proposed Algorithm for estimating the Hurst parameter 98
4.4 A scheme of the mean curvature flow smoothing procedure 100
4.5 A scheme of checking the relative positions of two surfaces 101
4.6 A scheme explaining the proposed approximation of an fBm 104
4.7 Smoothing and dilation of a fetal cerebral cortex 105
4.8 The proposed iterative dilation with mesh surgery 107
4.9 Mesh fairing process of a dilated smoothed fetal cerebral cortex 108
4.10 Approximation of an fBm defined on a sphere surface 114
4.11 Local error of approximation of an fBm defined on a sphere surface 114
4.12 Linear regression analysis of Fourier coefficients of approximated fBm of a fractional Brownian sphere 115
4.13 mBias and rMSE of estimations of H and C of 1000 fractional
Brow-nian spheres 117
4.14 Approximated smoothed and dilated surfaces and fBm of a fetal ce-rebral hemisphere 119
4.15 Segmented regression analysis of Fourier coefficients of approxima-ted fBm of a fetal cerebral hemisphere 120
4.16 200th Laplacian eigenvector of the smallest fetal reference surface 121
4.17 H versus age and hemispheric volume of fetal subjects 122
4.18 Comparison between 3 fetal cerebral left hemispheres with the same
age 124
4.19 A multifractional Brownian motion defined on a 1D space 128
4.20 A multifractional Brownian motion defined on a sphere 129
4.21 Regression analysis of local Fourier coefficients of approximated mul-tifractional Brownian motion defined on a sphere 130
List of tables
2.1 A categorization of mesh operators 30
3.1 Different GIs for vertices Pm and Pnof the wavy rectangle depicted in
Fig. 3.1b 74
4.1 Statistics of estimating H and C of a fractional Brownian sphere 116
4.2 Statistics of estimating H and C of 1000 fractional Brownian spheres 116
4.3 Comparison between the fractal dimension of cerebral cortex repor-ted in the literature and that obtained from H 126
Introduction
The human brain has 100 billion neurons, each neuron connected to ten thousand other neurons. Sitting on your shoulders is the most complicated object in the known universe.
– Michio Kaku
Michio Kaku’s statement reflects the brain complexity in the microscopic scale which is also true in the macroscopic scale. Indeed, the human cerebral cortex in the macroscopic scale is very smooth in the middle of fetal stage. At this time, the primary folds appear on the cortex, they wrinkle more and develop side branches which form secondary and tertiary folds. The process of cortical folding, known as gyrification, proceeds until few months after the birth when the cortical sur-face is highly folded and resembles an adult one in terms of sursur-face complexity.
Surface complexity is a morphological characteristic of any surface which des-cribes its degree of folding. In the case of the cerebral cortex, the surface com-plexity changes a lot along the brain development. It looks highly variable across an individual cortex and also humans. This variety roots in genetic factors as well as mechanical factors and is also affected by environmental conditions. Quanti-fication of this characteristic helps us to better understand the effect of these factors on the process of brain development and aging. It also provides valuable information to investigate the interplay between psychiatric or neurodegenera-tive disorders and the organization of cortical folds which may help for early diagnosis, prevention and treatment of such pathologies.
To quantify the surface complexity of the cortical surface, there are some me-thods in the literature. Almost all recent meme-thods, falling within the context of computational anatomy and surface-based morphometry, rely on analyses of the magnetic resonance images (MRIs) of the brain. Once an MRI acquisition of the brain is performed, it is segmented by using image processing techniques to ex-tract different tissues such as the white matter, gray matter and cerebro-spinal fluid etc. Then, the boundary between those tissues are reconstructed as surfaces modelled by triangular meshes. Finally, morphological analysis can proceed on those meshed surfaces and results of such analyses can be represented on those surfaces.
The existing methods of the surface complexity measurement can be catego-rized in 3 classes based on the geometrical features of the surface that they use for analysis :
• Surface area • Surface curvature
• Surface fractal dimension
Most of these methods provide local measures of the surface complexity. In the literature, these measures are known as either the gyrification index (GI) in cases of surface area and curvature based methods or the surface complexity in the case of the fractal analysis. To avoid any ambiguity, in this thesis, we call all those measures "GI" and we refer to surface complexity as a characteristic of the cerebral cortex that is measured by a GI.
The variety of methods and their results imply that there are different implicit interpretations of the notion of surface complexity. Nevertheless, most of those methods have not been designed based on a clear definition of the surface com-plexity which may be misleading i.e. a proposed GI may be biased by other mor-phometric parameters such as the depth of folds and the brain size. Moreover, it is not possible to justify what the proposed GI really measure. Consequently, one may get inconsistent results by using different GIs.
Some inconsistent examples can be found in the literature e.g. most of the surface area-based methods (e.g. TORO et al. 2008; SCHAER et al. 2008) and
even some curvature-based methods (e.g. LUDERS et al. 2006) show that the
frontal cortex is not much folded whereas some other methods (e.g. surface area-based GI of LEBED et al. 2013 and curvature-based GI of KIM et al. 2016) put
this region among highly folded regions. Another example appears in relation to pathologies : in patients with 22q11 Deletion Syndrome, SCHAERet al.2008and BAKKER et al. 2016, by using a surface area-based GI, reported only decreased
cortical complexity of some regions while BEARDENet al.2009, by using a fractal
dimension-based GI, found only increased complexity of occipital lobe. Other inconsistent examples can be found in relation to the surface complexity and brain volume (e.g. ROGERSet al.2010; LIet al.2014) and gender (e.g. LUDERS
et al.2006; LIU et al.2003).
Regarding the properties of different GIs in the literature, this question arises : What are the properties that a GI should possess to consider it as a standard GI ?
This question may be answered through investigating drawbacks of the existing methods. For instance, as mentioned before, some proposed GIs are not based on an explicit definition of the surface complexity. Some GIs have limitations in locality such that they can assign only one value to a big portion of the brain while some others work only in very small spatial scales (e.g. KIM et al. 2016).
Some methods do not take into account the inter-subject brain size variability thus result in inconsistent locality of analysis (e.g. GIs proposed by SCHAER et
al. 2008 and TORO et al. 2008). Some GIs violate essential properties that is
necessary in clinical studies e.g. they do not have geometry invariance properties thus depend on the embedding of brain surfaces and are hardly reproducible. For
instance, YOTTER et al. 2011 have shown that the fractal dimension computed
by the box-counting method is not invariant to surface rotation.
To address the above-mentioned question, we define explicitly the notion of the surface complexity and develop methods to introduce new GIs that overcome the mentioned issues of existing GIs in the literature by satisfying some standard properties. The main contributions of this thesis are given below.
Contributions
In this thesis, by reviewing the advantages and disadvantages of the existing methods, we provide a list of properties that a standard GI should possess. Then, we develop spectral methods on meshed surfaces to measure the surface com-plexity in two directions :
1. Analysis of geometrical properties of surfaces 2. Identification of fractional Brownian surfaces
In the first direction, we propose two explicit definitions of the "surface
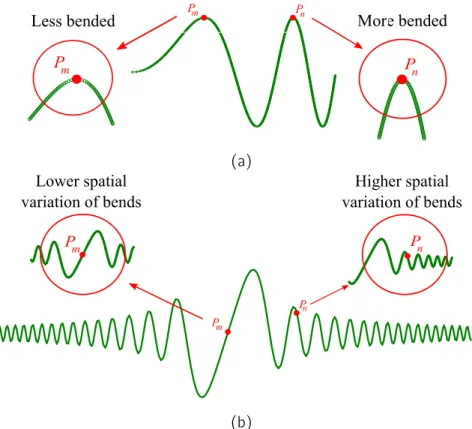
com-plexity" notion in two intuitive ways that rely on the surface bending properties.
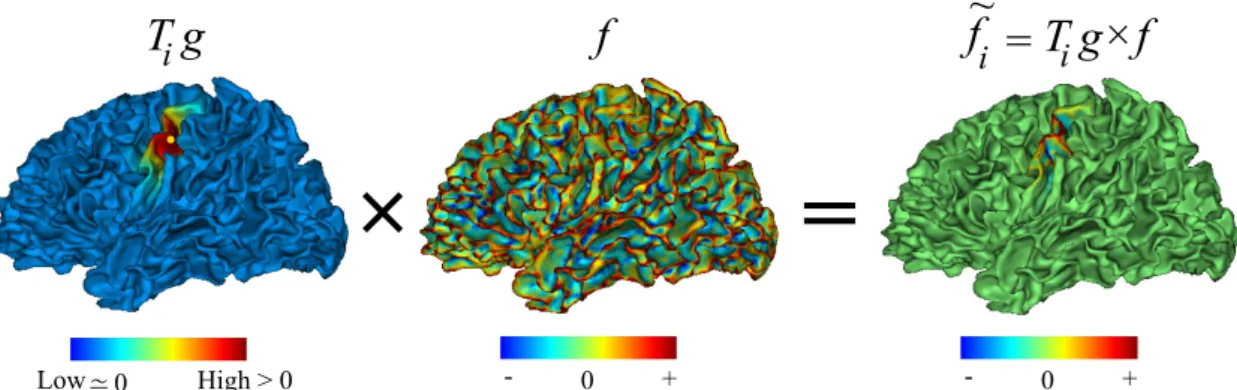
Particularly, a surface has more local complexity in a neighbourhood of each point if 1) it is more bended (magnitude of bending), or 2) it consists of more bends (spatial variation of bends). To quantify these definitions, we take advan-tage of the mean curvature as a geometric tool to measure bending properties.
To avoid the issues of using the mean curvature in spatial domain e.g. too much locality and sensitivity to noise, it is transferred to a so-called spectral domain through a local spectral transformation. For this purpose, the recently introduced graph windowed Fourier transform (SHUMAN et al. 2016) is exten-ded to the mesh setting by replacing graph Laplacian by finite element (FE) dis-cretization of Laplace-Beltrami operator defined on a surface. Unlike the graph Laplacian that is constructed based on the connectivity of graph nodes, the FE Laplace-Beltrami operator is aware of mesh geometry by taking into account the local surface area and angles of mesh elements. Moreover, we replace the win-dow function, used to define neighbourhoods, by an adaptive winwin-dow function to overcome the inconsistency of analysis arising from the inter-subject brain size variability.
Through the proposed method, we introduce two new local GIs and show that they satisfy most of the suggested standard properties. Especially, they are constructed based on clear definitions of the surface complexity and we prove theoretically that they quantify exactly those definitions. Moreover, they are geo-metric invariant, taking into account the inter-subject brain size variability and computed directly on the cortical surface with neither of them requiring a non intrinsic reference surface nor a smoothing procedure. The locality of GIs can be tuned easily in a wide range of spatial neighbourhoods from a part of a gyrus or sulcus to a big portion of the cortical surface equivalent to a lobe. Indeed, it is
done only by changing a parameter of the window function without any ceiling effect.
Through some experiments on designed synthetic wavy surfaces we show that the mostly used surface area-based methods cannot distinguish between a deep regular fold and a set of shallow oscillating folds with the same surface area. In other words, those measures are biased by the fold depth and tend to give higher values of GIs to deep folds where much surface area is found. In contrast, our proposed indices are able to disentangle the effect of depth on the surface complexity quantification.
In the second direction, we try to measure the surface complexity through
identification of the recently introduced fractional Brownian surfaces. Indeed, GELBAUM 2014 has introduced a generative model of fractional Brownian mo-tions (fBm’s) defined on smooth manifolds. Through displacing the points of a smooth manifold by an fBm defined on it, in direction of normals to the mani-fold, a fractional Brownian surface (fBs) is constructed. An fBs is a kind of fractal surface which can be characterized by a so-called Hurst parameter (denoted by
H) of the corresponding fBm. This parameter takes its values in the range of (0, 1)and determines properties of the fBm e.g. the Hölder regularity : the lower the value of H of an fBm, the more irregular the corresponding fBs.
Accordingly, we propose to define the surface complexity of a given fBs by the Hölder regularity of its corresponding fBm. Furthermore, for the first time, we propose an algorithm to estimate H parameter of a given fBs to measure its complexity. The proposed algorithm relies mainly on the special structure of the underlying fBm which has been defined as a random series of Laplace-Beltrami eigenvalues and eigenvectors of the underlying smooth manifold (GEL -BAUM 2014). It encourages us to estimate H by using a spectral analysis based
on Laplace-Beltrami eigenpairs.
In the proposed algorithm, first, the underlying smooth manifold and fBm are approximated through surface smoothing and dilation procedures applied on a given fBs. Then, the Laplace-Beltrami eigenvalues and eigenvectors of the ap-proximated smooth manifold are apap-proximated by a linear FE method. By using the eigenvectors, the spectral powers of the approximated fBm are computed. Then, the spectral powers of fBm are modelled by a least square linear regres-sion as a function of the Laplace-Beltrami eigenvalues. Finally, the estimation of
H is extracted from the slope of the regression line.
The smoothing procedure, involved in the proposed algorithm, might result in non convex smoothed surfaces. Consequently, dilation of a non convex surface may cause point crossing which corrupts the surface locally, especially when the amount of dilation is high. To overcome this issue, we propose an iterative di-lation algorithm with surface surgery. Through this algorithm, didi-lation is broken into several iterations with lower amount of dilation. Moreover, in each iteration, the critical points that are going to cross each other are identified and fixed (not
dilated). At the end of iterations, the fixed points are relocated by a weighted interpolation of their normal neighbour points.
By computing the Hurst parameter of a set of fetal cerebral cortices, we show that the human cerebral cortex can be considered as a fractional Brownian sur-face, at least in a range of its low frequencies. Moreover, we discuss that the H have main properties of a standard GI. Especially, it is based on a clear definition of the surface complexity i.e. the Hölder regularity, it is geometric invariant and can be computed in a reasonable time.
The Hurst parameter, however, is a global measure of the surface complexity. To have a local measure, inspired by the idea of multi-fractional Brownian sur-faces, we bring up the idea of using local spectral analysis (e.g. the windowed Fourier transform) to estimate the local Hurst parameter. In this manner, it is expected that other properties of a standard GI i.e. locality and consistency are also met due to the natural properties of the mesh windowed Fourier transform with adaptive window function established in the first direction of this thesis.
Since a fractional Brownian surface is a kind of fractal, we wonder if there is a relationship between its Hurst parameter and fractal dimension. Inspired by some relationships in case of fBm’s defined on R or rectangular domains in R2,
we give a conjecture on this relationship in case of fBm’s defined on manifolds. If this conjecture comes to be true, it can be useful in two ways : 1) It provides a new estimation of the Hurst parameter by using the methods of estimating the fractal dimensions, 2) By using the generative model of fBm’s, one can generate a fractal surface with a known FD from arbitrary manifolds.
Organization
The materials of the thesis are organized as follows.
In Chapter 1, first, it is explained shortly what the cortical gyrification is,
how it emerges and why it is useful to quantify it. The existing methods in the literature to quantify the gyrification are surveyed in Section1.3. The advantages and disadvantages of those methods are listed in this section. At the end of this chapter, we propose a list of properties that a standard GI should possess (cf. Section1.4).
In Chapter 2, we review the methods of spectral surface analysis with
em-phasis on the methods developed to analyse the cerebral cortex in Section 2.1. Specially, we explain the Fourier transform on meshed surfaces in Section 2.2. The windowed Fourier transform for 1D signals is illustrated through an example in Section2.3. The recently introduced graph windowed Fourier transform is gi-ven here. Our extension of the framework to mesh setting is presented in Section
2.4. The proposed spectral gyrification indices and their properties are given in Section2.5. A summary of contributions finalizes this chapter (cf. Section2.6).
In Chapter3, the proposed method in the previous chapter is applied to some
designed to illustrate the features of the proposed GIs. For comparison, a surface area-based GI proposed by TOROet al.2008is also computed on these surfaces. Through these experiments, the effect of fold depth on surface area-based GIs is elucidated. Then, the method is applied to real adult brain surfaces in Section
3.2. The individual maps as well as group average maps of our GIs and Toro’s GI are presented in Section3.2.2. Some features of our GIs are also shown here through some examples on an individual brain surface. The relationship between our proposed GIs and the brain volume is investigated globally and locally in Section3.2.3. Finally, a summary of results along with a discussion are given in the last section of this chapter (cf. Section3.3).
In Chapter 4, our proposed estimator of the Hurst parameter of fractional
Brownian surfaces is presented. First, the theory of fractional Brownian motion (fBm) in 1D is reviewed shortly in Section4.1. The extension to manifolds toge-ther with the simulation on the sphere surface are also given in this section. Our proposed algorithm to estimate the Hurst parameter is presented in Section4.2. Especially, the proposed technique of dilation of non convex surfaces with mesh surgery is also given in this section. The method is evaluated on simulated frac-tional Brownian spheres in Section4.3.1. The method is then applied on a set of real cortical surfaces of fetuses in Section4.3.2. This chapter is ended with some discussions on how the Hurst parameter can be considered as a global GI and the relationship between the Hurst parameter and the fractal dimension. The idea of local estimation of the Hurst parameter is also brought up in this section. Finally, we mention some limitations of our algorithm (cf. Section4.4).
In AppendixA, the proof of a proposition about the precision of the proposed estimator of the Hurst parameter is given.
1. Gyrification process and
measurements
The human brain changes enormously in size, shape, and complexity during its development from prenatal life to adulthood. In particular, during prenatal and early postnatal periods, cortical folds appear and the cortex becomes more and more convoluted, a process that is known as gyrification. The study and quantification of gyrification is of great interest to measure the changes occurring on the brain surface during development, aging and diseases. In this field, one usually tries to measure and characterize the geometric features of brain like its volume, surface area and fold properties (e.g. length, depth, complexity etc.). In this chapter, we review some studies that have attempted to answer these questions : What is the gyrification ? How does it happen ? What are the effects of various factors on it ? How can we quantify it and measure these effects ?
1.1. Theories of gyrification
The human brain, in the middle of fetal stage, has a smooth surface. Then it starts wrinkling and some primary folds appear on this surface as short isolated shallow grooves or triple junctions. These primary folds become progressively deeper, more elongated and more wrinkled and develop side branches which form secondary and tertiary folds. The process of fold appearing on the cerebral cortex is called gyrification ; see Fig.1.1. It occurs mostly during the second half of fetal life but continues changing the shape of the folds during post-natal life (ARMSTRONG et al.1995; WELKER1990; YUet al.2007; LEFÈVREet al.2015).
In spite of space limitations enforced by skull size, gyrification allows brain to increase its surface area, up to 2500 cm2 in average (JONES et al. 1986), with
advantages for expansion of number of neurons (ROCKEL et al. 1980; RAKIC
1995). Moreover, the connections between different parts of the brain will be more packed i.e. the length of axons become shorter. In this way, brain networks are optimized in terms of time and energy consumption for information proces-sing (CHERNIAK 1995; KAAS 2000; KARBOWSKI 2003; LAUGHLIN et al. 2003;
ZILLES et al.2013).
Figure 1.1.: Gyrification process from fetal to adult ages (adapted from Van Essen Lab, Washington University in St. Louis)
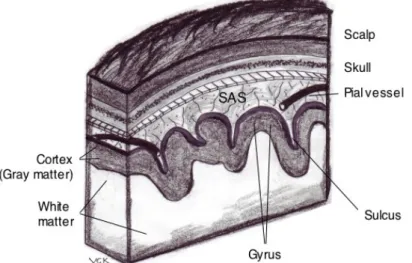
Figure 1.2.: A cross-section of the human head, from hairs to the white matter. A gyrus and sulcus are also indicated.
respectively ; see Fig.1.2. Individual folding patterns show that the position and orientation of primary folds are not randomly determined and they are stable across individuals (WELKER1990). In other words, although there is a high
inter-individual variation in the shape of folds, all normal human brains include well-known primary folds in specific locations and orientations e.g. central sulcus, calcarine, superior temporal sulcus etc. This fact suggests that the gyrification is driven by specific mechanisms although it is not well understood yet. There are some studies that propose different scenarios behind gyrification process. Those studies have tried to unveil the underlying mechanisms of gyrification from different perspectives and scales : from genetic and molecular determinants to geometric patterns and mechanical forces. Here, we give a short review on some gyrification scenarios that are the most accepted in the brain development community.
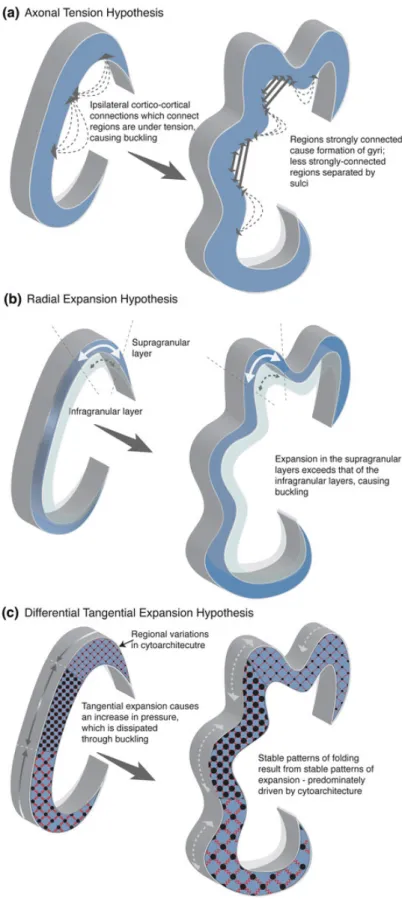
VAN ESSEN 1997 proposed that axons in white matter pull the regions of
the cortex which are strongly connected together and it forms gyri ; see Fig.
1.3. Accordingly, abnormal gyrification patterns stem from abnormal patterns of connectivity. In another hypothesis, RICHMANet al. 1975explained the
gyrifica-tion process by the radial gradient of cortical tangential expansion. This suggests that the increasing expansion of upper layers of the cortex relative to the lower layers generates compressive stress leading to cortical folding ; see Fig.1.3b. To test this hypothesis in practice, TALLINEN et al. 2016 have constructed a soft
elastic tissue brain model based on a smooth fetal brain that mimics the gyrifi-cation process when immersed in solvents. Although the physical experiments, computational simulations and morphometric analysis show that the proposed mechanical approach can mimics the gyrification process at some extent, the fol-ding pattern in this model is almost uniform in the whole cortex in contrast to that of a real brain (see e.g. Fig. 1d of TALLINEN et al.2016). Recently, RONAN
et al. 2014proposed that differential tangential expansion causes folding. They supposed the non-uniform cytoarchitecture patterns cause different local growth rates of cortex. It, in turn, causes in-plane pressure that is mitigated through out-of-plane folding ; see Fig.1.3c.
In the above-mentioned works, it is not answered why the position and orien-tation of the primary folds are reproduced across individuals. Through a joint analysis of experimental data and computational modelling, ZHANG et al.2016
proposed that consistent folding patterns might have roots in heterogeneous re-gional growth in the cortex. They found that regions of cortex with faster growth rates form gyri consistently while more rigid regions form sulci.
1.2. Gyrification measurement : Applications
Morphological parameters of the cerebral cortex such as volume, surface area, sulcal shape features (like sulcal length, depth, width, position and asymmetry indices), cortical thickness, curvature and gyrification index (GI) are commonly used to quantify the gyrification process. Among these, GI is a direct measure that attempts to quantify the degree of folding of the cerebral cortex. It pro-vides valuable information about structural changes occurring on a brain surface complexity during development, aging, and disease.
Detection of characteristic neuroanatomical patterns caused by abnormal brain development or neurodegenerative/psychiatric disorders may lead to early diag-nosis, prevention and treatment of such pathologies. GI can be also employed to investigate differences in the brain surface structure between groups of in-dividuals e.g. men vs. women, mediators vs. other people etc. The following paragraphs review some studies on how measurement of GI helps us to better understand the effect of various factors on the brain surface complexity. There are different definitions of GI that are given in the next section. Here, we refer to GI in its general sense as a descriptor of cortical complexity.
1.2.1. Development and aging
In many developmental studies, GI is one the most widely used indicators to identify normal and abnormal brain development from fetal to adult ages. In a cross-sectional study of gestational age-matched fetuses and preterm newborns, LEFÈVRE et al. 2015showed that preterms have higher global GIs than fetuses. This finding reveals the increasing impact of early exposure to ex utero envi-ronment on the cortical complexity. In another comparison between term-born, healthy preterm and pathologic preterm infants, the power of gyrification in-dex is highlighted where it is the only inin-dex among 22 indices that is able to distinguish those groups (SHIMONY et al.2016).
KIMet al.2016studied the changes of cortical complexity occurring after birth from 6 to 24 months of age. They found that GI is positively correlated with age in this period of life. Moreover, they reported some sexual dimorphisms in the insula, middle cingulate, parieto-occipital sulcus and Broca’s region. In another longitudinal study of infants from birth to 2 years of age, LI et al. 2014 found
16.1% and 6.6% of increase in global GI in the first and second year of life. Their results show heterogeneous developmental cortical changes with high-growth regions located in the association cortex, whereas the low-growth regions located in sensorimotor, auditory, and visual cortices. They showed that larger brains are more folded with a significant correlation between GI and the brain size in the prefrontal cortex. They also detected sexual dimorphisms such that males have larger GIs than females at 2 years of age.
In a lobar study on children and adults from 8 to 19 years of age, SU et al.
2013found a gradual decrease in cortical complexity over time. The decreasing GI with age for adults of age 42.8 ± 9.9 has been also reported by BONNICIet al.
2007. Another comparison study between young (27.7±4.4 years of age) and old (74.8 ± 2.6 years of age) subjects shows the decreasing effect of aging on brain surface complexity (ZHANG et al. 2007b). Moreover, the results of this study
suggest that this decrease is not similar across genders and brain hemispheres, such that it significantly happens in the left hemisphere in old men but in the right hemisphere in old women.
In a study on adults between 20 and 86 years old, MADAN et al.2016 found that the global cortical complexity of the gray matter decreases with age. Fur-thermore, the most decrease is observed on the prefrontal lobe followed by the parietal, occipital and temporal lobes. They also found that the cortical com-plexity is a more sensitive measure to aging than the whole brain mean cortical thickness.
In summary, GI measurement reveals that brain degree of folding increases with age in fetal period and few years after birth. Then it starts to decrease in school ages and continue to decrease in adulthood. These studies also show different evolutions of cortical complexity between male and female. Although, more research on cortical development, especially on longitudinal data, is still
needed to give more precise inferences about evolution of cortical complexity.
1.2.2. Pathologies
Gyrification index has been also employed in many studies to identify the relationship between neurodegenerative pathologies/psychiatric disorders and cortical complexity. For instance, SCHAER et al.2008and BAKKERet al.2016
re-cognized some cortical regions of patients with 22q11 Deletion Syndrome with decreased local cortical complexity while BEARDEN et al.2009 identified an
in-crease in GI of occipital lobe in those patients. In a study on patients with mental retardation, schizophrenia, comorbid mental retardation and Schizophrenia and controls, BONNICIet al.2007found that patients with mental retardation has the
lowest GI in prefrontal cortex followed by comorbid, schizophrenia and controls. They also reported a significant age-related decline in GI for all four groups.
A decrease in cortical complexity has been also reported in patients with Schi-zophrenia (BULLMORE et al. 1994), dyslexia (CASANOVA et al. 2004), epilepsy
(LINet al.2007), attention deficit hyperactivity disorder (WOLOSINet al.2009), mental retardation (ZHANGet al.2010), neurofibromatosis type 1 (VIOLANTEet
al.2013), Parkinson (LEWISet al.2016) and amnestic mild cognitive impairment
(WANG et al.2016).
Some studies show an increase in GI in patients with manic-depressive di-sorder (BULLMOREet al. 1994) Williams syndrome (GASER et al.2006), autism
(JOUet al.2010), Schizophrenia (SCHULTZet al.2013), dyslexia (PŁO ´NSKIet al.
2016) major depressive disorder (HAN et al. 2016) and impulsivity (HIRJAK et
al.2016).
Some neurodegenerative pathologies like dementia (LEBEDet al.2013), Schi-zophrenia (PALANIYAPPAN et al.2012; YOTTER et al.2011) and bipolar disorder
(NENADICet al.2017) increase the degree of gyrification in some cortical regions
and decrease it in some other regions. Even some diseases that are not directly related to brain, like severe congenital heart disease, have been reported to re-duce the degree of cortical folding in newborns (CLAESSENSet al.2016).
In these studies, it has been argued that some neurological pathologies may affect the cortical complexity or they even may have roots in altered cortical com-plexity. Accordingly, altered cortical complexity may be considered as a sensitive marker for several neurodevelopmental disorders. The last mentioned study by CLAESSENSet al.2016raises this question that how pathologies of other organs
affect the brain shape and folding. Consequently, quantification of changes in cortical complexity may open a way to investigate neurodegenerative patholo-gies and psychiatric disorders and even patholopatholo-gies of other organs.
1.2.3. Miscellaneous factors
Besides development and diseases, some other events that happen in human life, may change the cortical complexity. For example, KELLY et al. 2013 have
shown that children with maltreatment history have a less complex cortex in the lingual gyrus and the insula extending into pars opercularis in comparison to normal children. A study on people who had been involved in a motor vehicle accident in at least 6 month before the analysis revealed that post-traumatic stress disorder reduces the cortical complexity in the left lateral orbitofrontal cortex (CHU et al.2016).
Recently, RICCELLI et al. 2017have shown that even personality is associated
with variability in cortical anatomy, especially the degree of folding. They studied the famous five-factor model of human personality and found that 1) neuroticism is linked to smaller folding in prefrontal–temporal regions, 2) extraversion is linked to larger folding fusiform gyrus, 3) openness is linked to larger folding in prefrontal–parietal regions, 4) agreeableness is associated with larger inferior temporal cortex and 5) conscientiousness is linked to smaller area and folding in prefrontal regions. The correlation between dispositional anxiety and degree of folding has been studied by MISKOVICHet al.2016. Their findings show a link
between this personality trait and smaller folding in the left superior parietal region.
In a comparison study on gender differences, LUDERSet al.2006observed that
the female brains are significantly more convoluted than male brains in all lobes while ZHANG et al. 2007b got opposite results. In contrast, LIU et al. 2003 did not detect any difference in brain complexity between men and women.
LUDERS et al. 2008 studied the relation between intelligence quotients (IQ)
and cortical complexity and found a significant positive correlation between IQ and GI in outermost section of the posterior cingulate gyrus. They also obser-ved prominent gender differences within the right frontal cortex where "females showed uncorrected significant positive correlations and males showed a non-significant trend toward negative correlations." IM et al.2006 have shown that
people with higher intelligence quotient (IQ) have more complicated cortical structures and more interestingly, number of years of education has significant positive effect on the complexity of the cerebral cortex.
The effect of meditation on the brain gyrification has been also studied by LUDERS et al. 2012. They identified some regions, namely left precentral gyrus, right fusiform gyrus, right cuneus and left and right anterior dorsal insula with higher local GI in mediator subjects as well as a positive correlation between GI and the number of meditation years.
The relationships between the cortical complexity and other morphological properties of the cerebral cortex have been also investigated in several studies. IM et al. 2006 found a negative significant correlation between mean cortical thickness and complexity. They also found significant positive correlation
bet-ween folding areaa and complexity. They could not find any significant
relation-ship between sulcal depth and complexity except in the left temporal lobe. In contrast, MADAN et al. 2016 found a strong positive correlation between mean
cortical thickness and complexity.
Some studies reveal a positive correlation between cortical complexity and brain size, For instance TORO et al. 2008 have shown that the cortical
com-plexity varies positively with total cortical surface area with the largest variation happens in the prefrontal region. IM et al. 2008, GERMANAUD et al. 2012 and GERMANAUD et al.2014found a positive correlation between brain volume and
global cortical complexity. These results are in agreement with some mechanical models of gyrification process (TALLINENet al.2013; TALLINENet al.2016) and they support the hypothesis that larger brains are more folded.
1.3. Gyrification measurement : Methods
The extensive research mentioned in the previous section acknowledge the importance of gyrification measurement for which diverse methods have been suggested in the literature. A basic classification of these methods may be based on the level of GI assignment which varies from point-wise to global level. A method in point-wise level assigns a GI value to each point of the cerebral cor-tex that is usually computed in a pre-determined neighbourhood of each point. Some regional studies need to compute a GI for some regions of interest in-cluding sublobar regions, lobes and hemispheres. Finally, at the highest level, a single GI value is assigned to the whole brain surface. It is called a global GI and is a compact measure in which the information of total surface complexity is summarized. Although a global GI may be enough in some applications, des-cribing the whole surface of a highly convoluted brain by only a single value is not sufficient to understand its local complexity. Especially in case of pathologies that deform cortical regions, a local GI is needed to localize this alteration.
A more sophisticated classification of gyrification measures may be presen-ted based on the geometrical methodology : Some methods compute a ratio of surface area or contour perimeter of the brain(ZILLES et al. 1988; MOORHEAD
et al. 2006; TORO et al. 2008; SCHAER et al. 2008; LEBED et al. 2013; SU et
al. 2013; LI et al. 2014). Some other methods employ the surface curvature
(VAN ESSEN et al. 1997; LUDERS et al. 2006; SHIMONY et al. 2016; KIM et al.
2016). There are also methods that mix the concepts and tools of the previous categories (SHISHEGAR et al. 2015) or are based on other geometrical features
like fractal dimension (HOFMAN 1991; FREE et al. 1996; KISELEV et al. 2003; ZHANG et al.2007b; JIANG et al.2008; YOTTER et al. 2011). In the following,
we give a review of all these categories.
GI =
Length of pial contour ( ) Length of outer contour ( )Figure 1.4.: Left : A coronal section of a brain hemisphere. The pial contour is drawn by a solid line while the superficial outer contour is delineated by a dashed line. Right : Formula of Zilles’ GI (Zilles et al. 1988). It is noted that, in the literature, the gyrification measures that are based on surface area or curvature are usually called "Gyrification Index" (GI). On the other hand, the gyrification measures based on fractal dimension are called "Cortical
Complexity". In this thesis, we call all of those measures as gyrification index and
we refer to cortical complexity as a feature of the brain surface that is quantified by a gyrification index.
1.3.1. Surface area/perimeter-based GIs
An early attempt to measure the degree of human brain folding has been done by ZILLES et al.1988 on post-mortem brains sliced on coronal plane. They defi-ned the gyrification index of each coronal section of the brain as the ratio bet-ween the length of the pial contour and the length of a regular superficial outer contour as a reference contour ; see Fig. 1.4. The idea is that if a brain is more folded, this ratio will be larger. Despite of its easy interpretation, it raises some issues in implementation and results. For instance, in this method, the pial and outer contours have been delineated manually which is very time consuming in large scale studies and raises questions about reproducibility and reliability of results. Moreover, it has been discussed that due to complexity of folds in the 3D space, this measure by considering 2D coronal slices is prone to be biased and sensitive to slice orientation (ZILLES et al.1989). Moreover, SCHAER et al.2008
argued that the standard deviation of results obtained by Zilles’ GI is too high to reveal group differences. In addition, while significant correlations between gyrification and brain volume (TORO et al. 2008; KAPELLOU et al. 2006; GER -MANAUD et al.2012) or gender (LUDERS et al.2004; LUDERS et al.2006) have
1988.
Following the development of medical imaging technologies like MRI and ad-vances in image processing algorithm in recent years, a 3D representation of brain can be reconstructed. Indeed, after anatomical MRI acquisition, the ce-rebrospinal fluid, gray and white matters are segmented in 3D volumes. Then, from the segmentation, the pial surface and white matter surface are reconstruc-ted and modelled by triangular meshes.
By taking advantage of this representation, some attempts have been done to modify Zilles’ GI. For instance, to deal with the manual delineation issue of Zilles’ method, MOORHEADet al.2006developed an algorithm to compute the pial and
outer contours in the coronal sections of MR images automatically.
To take into account the 3D nature of the brain surface, SCHAERet al.2008
ex-tended Zilles’ GI to 3D and proposed a local GI by the ratio between the area of a neighbourhood on a superficial outer surface and the area of the corresponding neighbourhood on the pial surfaceb. In this work, the outer surface is the hull
surface that fills the sulci and covers the gyri. The outer neighbourhood around each point is then determined by the intersection of a sphere and the outer sur-face. Correspondence between the outer neighbourhood and the corresponding neighbourhood on the pial surface is computed by finding the points with the closest distance on both surfaces ; see Fig. 1.5a. This method assigns a GI value to every point of the outer surface. To compare GI values across cortices, an ad-ditional step has to be done to redistribute GI values from the outer surface to the pial surface through an averaging procedure.
To avoid this non intuitive step, LEBEDet al.2013proposed to compute the
ou-ter surface by applying a surface-smoothing procedure. In this way, there exists a one-to-one vertex correspondence between the pial and the outer surfaces. LI
et al. 2014found the vertex correspondences between the cortex and the cere-bral hull surface by solving the Laplace’s equation and following the streamlines between the two surfaces.
Another method in the first category has been proposed by TOROet al. 2008.
In this method, at each point of the pial surface, a sphere is centered and Toro’s GI is defined as the ratio between the area of the pial surface contained in the sphere and the area of the great disc of the spherec; see Fig.1.5b. The idea is
that if the brain was not folded, the pial surface would be the great disc of the sphere. In this method, akin to Schaer’s method, the neighborhood around each point is defined by a sphere of a certain radius r. By changing the radius of the sphere, it is possible to compute the GI in different spatial scales. According to GI maps shown in SCHAER et al. 2008, Fig. 4 and TORO et al. 2008, Fig. 5a-c, Toro’s GI, is less sensitive to r than Schaer’s GI.
The locality of results of those methods depends on the radius of the spherical neighbourhood r. In order to deal with the brain size variability in a database,
b. It is noteworthy that Schaer’s method has been integrated in FreeSurfer software. c. The great disc is the largest disc that can be included inside a sphere.
(a) (b)
Figure 1.5.: (a) Left : the pink surface is the brain hull surface. In Schaer’s method, a neighbourhood around each point of the hull surface is determined by intersection of a sphere centred at that point and the hull surface. Right : the pial surface is shown on blue. The dark region is the pro-jected neighbourhood from hull surface to pial surface. (b) Left : in Toro’s method, a neighbourhood around each point of the pial surface is determined by intersection of a sphere centred at that point and the pial surface. Right : Such a neighbourhood is depicted. Figures are adapted from Schaer et al. 2008 and Toro et al. 2008.
the radius would have to be adapted for each subject. Otherwise the locality of analysis is not consistent between subjects. In other words, by using a fixed radius for a large and a small subject, the neighbourhood covers a greater portion of the surface area in small subject in comparison to large subject ; see Section
2.4.3 for more information. It will be more problematic when one is studying subjects with highly different sizes e.g. fetal brains.
Unfortunately, no intrinsic strategy exists to choose an adaptive neighbou-rhood in the above methods. To tackle this issue, LEFÈVRE et al. 2015proposed
to adapt the radius r so that it equals a fraction of the brain length in the rostro-caudal direction. LI et al. 2014 also managed to deal with the size variability
and to do a consistent analysis by resampling all cortical surfaces to the same standard mesh and taking N -ring neighbourhood around each vertex instead of geodesic neighbourhoods.
The main idea of the above methods is that if the brain was not folded, the local area of the pial surface and the reference surface would be the same. Ac-cordingly, if the brain is more folded around a cortical point, the neighbourhood around that point contains a larger surface and the defined ratio will increase. This idea interprets the notion of cortical complexity based on the surface area. To our opinion, however, the main drawback of those methods stems from this interpretation. In fact, this interpretation is true when an unfolded region is to be compared with a folded region. Although, in case of two folded regions, this interpretation cannot distinguish between different kinds of folding. More preci-sely, those methods may not distinguish between deep folds and oscillating folds
P
n(a)
P
m(b)
Figure 1.6.: (a) A folded region with few deep folds around Pn. (b) Another folded
region with shallower but more oscillating folds around Pm. Toro’s GI
equals to 2.23 for both Pm and Pn.
(a) (b)
High
Low
Figure 1.7.: GI maps resulted from (a) Schaer’s method and (b) Toro’s method. The blue and red colors indicate the extremes of low and high degree of folding respectively. It is seen that both methods tend to give larger GI values to deeper folds like the insula. Figures are adapted from Schaer et al. 2008 and Toro et al. 2008.
with equal surface areas.
For instance, in Fig. 1.6, two folded regions with equal surface areas are re-presented. The region around Pn consists of few deep folds while the region
around Pm includes shallower but more oscillating folds. Due to equal surface
areas around Pm and Pn, the methods in this category give equal GI value to
these points e.g. Toro’s GI is about 2.23 for both Pm and Pn. That is why Schaer’s
and Toro’s methods both give high GI values to deep folds like the insula and the central sulcus. Indeed, in deep neighbourhoods, much surface area is found. In a more general way, both methods tend to produce similar GI maps ; see Fig.1.7.
To address this issue, SUet al.2013proposed to weight the GI by the geodesic sulcal depth. In this method, the pial surface is wrapped by an outer hull surface. Then, for any ROI on the pial surface, the corresponding region on the hull surface is extracted by solving an differential equation of the negative gradient
Figure 1.8.: Maps of Schaer’s GI with different neighbourhood size : from 20mm to 35mm. The blue and red colors indicate the extremes of low and high degree of folding respectively. The figure is adapted from Schaer et al. 2008.
of geodesic sulcal depth for points on the boundary of the pial ROI. Finally, the ratio between the weighted surface area of the considered ROI on the pial surface and the surface area of the corresponding region on the outer surface is computed where the weights are the geodesic sulcal depth. In this way, deep folds get higher weights than shallow ones.
The advantage of this method on the previous ones is two folded. First, there is no need for an extrinsic sphere to define a ROI/neighborhood on the cortex or the outer surface. Second, the weighted surface area ratio is able to discriminate deep and shallower folds with equal surface area. Nevertheless, we believe that this weighting strategy is in contradiction with the notion of surface complexity. In fact, if a cortical region with deep sulci and another region with shallow sulci have equal areas, the latter region should be more convoluted to keep the same area as the former one.
Moreover, the gyrification maps produced by these methods may be not locali-zed enough for some applications. For example, in Fig.1.8adopted from Schaer’s work, for a small spherical neighbourhood, the most folded region of the cortex is around the Sylvian Fissure and as the radius of the sphere increases, the same pattern propagates across the cortex. Therefore, it may fail to catch other folded parts of the brain and affect the reliability of findings.
1.3.2. Curvature-based GIs
Methods in the second category rely on the curvature and its derivatives e.g. the mean curvature. The mean curvature is a geometric tool that measures lo-cally how a surface is deviated from being flat. It defines a function on the cere-bral cortex and assigns positive values to points on gyri and negative values to points on sulci (see MEYERet al. 2003and Section2.5.1for more information).
The mean curvature map, however, is too local to deliver a helpful insight into the surface folding (LUDERSet al.2006). Moreover, as SHIMONYet al.2016have
Gaus-sian curvature, shape index etc.) by themselves may not be able to discriminate between normal and aberrant cortical development.
Nevertheless, the curvature contains useful information about the surface ben-ding. VAN ESSEN et al.1997 defined a global folding index of each hemisphere
by integrating a function of principal curvatures. To introduce a local measure of folding, LUDERSet al.2006defined a local GI by smoothing the magnitude of
the mean curvature but the Luders’ GI is not scale invariant. Indeed, if a cortical surface is just scaled while preserving its folding pattern, it is expected to keep its GI value as well but it is not the case for the Luders’ GId.
KIMet al.2016has recently proposed a new GI by quantification of the shape
index variance in a local region. In each neighbourhood, determined by a geode-sic radius, the variability of some predefined shape types is computed, followed by a smoothing procedure. They introduced a two-phase adaptation of neigh-bourhood to deal with the size variability between subjects. In a longitudinal database of subjects from 6 to 24 month of age, first, for each 6-month-old sub-ject, a fixed neighbourhood size is adapted globally by the ratio of the subject’s hemisphere surface area to the average hemisphere surface area. Then, for older subjects, the normalized neighbourhood size is scaled by the changes of local surface area.
This analysis is done in very fine scales of at most 8mm with the advantage of differentiating between widening and deepening of cortical regions as well as to identify regions with developing secondary and tertiary sulci. The loca-lity limitation leads to cortical complexity analysis within a sulcus or gyrus with neighbourhood size less than 8mm ; otherwise, a ceiling effect appears and less folded regions are not distinguishable from more folded ones (see Fig. 5a,b of KIMet al.2016). The authors have also mentioned that the proposed GI changes by less than 0.1% when the cortical surface is scaled from 80% to 120%, thus not completely scale invariant. Moreover, due to the heat kernel smoothing pro-cedure used in this method and Luders’ method, they are likely to miss some folding features at fine scales.
In a recent work by SHISHEGARet al.2015, a new local GI has been proposed
by computing the differential 1D signed curvature along the level sets of the first nontrivial Laplace-Beltrami eigenfunction weighted by the geodesic distance bet-ween each point and two closest gyral tops. In this way, the cortical curvature features are combined with sulcal depth which enable the method to discrimi-nate between narrow sulci from wide sulci. This method focuses mainly on sulcal bending such that it assigns the lowest values to points on gyri and the largest values to deep narrow folds.
1.3.3. Fractal dimension-based GIs
In a different direction, the fractal dimension (FD) has been used to quantify the global degree of cortical folding. In fact, the human cerebral cortex has been approximately recognized as a fractal structure, at least in a limited range of spatial scales (HOFMAN 1991; FREE et al. 1996; KISELEV et al. 2003). Accor-dingly, FD as a measure of fractal irregularity, is applied as a global gyrification index. The more complex an object, the larger its FD value (MANDELBROT1967).
Fractal dimensions of different brain parts can also be computed and combined. For instance, ZHANG et al.2007b proposed a hybrid FD consists of FD of white
matter volume, white matter surface and the overall white matter structure (the sum of two former FDs).
The most widely used method to compute FD for human brain is the "box-counting method" introduced originally by RUSSELL et al. 1980 in a physics
context (e.g. IM et al. 2006; THOMPSON et al. 1996). In this method, the sur-face of interest is mapped onto a rectangular grid or lattice. The grid consists of boxes with edges of equal length r. Then, the number of boxes occupied by one or more vertices of the mapped surface is counted. This procedure is done several times with different r’s and at each step, the number of occupied boxes is kept as N (r). It has been shown that N (r) is proportional to FD power of r by
N (r) ∝ (1/r)FD. Now, the slope of the least-square regression line fitted to points {(1/r, N (r))} in log-log scale gives FD (LIEBOVITCHet al.1989; SARRAILLEet al.
1994; JIANGet al.2008).
The human brain is not a pure fractal i.e. it does not have self-similarity in all scales. So, the range of box sizes r in the box-counting method should be chosen carefully such that a linear relationship holds between 1/r and N (r) in log-log scale (cf. NEZADAL et al. 2001; SILVA et al. 2006). Some limited attempts have been done to find upper and lower bounds for the box size (cf. CHENet al.1993;
BISOI et al.2001). Moreover, ASVESTASet al. 1998showed experimentally that
the box-counting method is not numerically stable and underestimates the true value of FD.
Other methods have been also proposed to estimate FD and cover the limi-tations of box counting method e.g. differential box-counting method (CHAUD
-HURIet al.1995), extended counting method (SANDAUet al.1997) and frational
Brownian motion methods (variogram by SOILLEet al.1996and power spectrum
by PENTLAND 1984). To the best of our knowledge, none of them has been used to measure cortical complexity. A comprehensive review on above-mentioned methods for FD estimation along with their advantages and limitations are given by LOPES et al.2009.
YOTTERet al.2011proposed recently a new way for estimating the FD through
reconstruction of cortical surfaces by spherical harmonics (SPH). In this work, it is shown practically that the normalized surface area of reconstructed surfaces by SPH of degree at most l varies linearly with l in a certain range of l’s in
log-log scale. The slope of the fitted regression line is then considered as a global GI. A similar regression analysis in vertex level after a smoothing procedure gives a local GI. Moreover, they have shown that while this new GI is able to estimate the FD of fractal surfaces more accurately than the box counting method, the latter method is not invariant to rotation. As discussed at the end of this chapter, in practice, it is strongly expected from a well-defined GI to be invariant to isometric transformations like rotatione.
1.4. Discussion
The aforementioned methods in all categories have different implicit inter-pretations of the concept of "surface complexity" that underlies GIs. AWATE et al.
2010discussed the different meanings of surface complexity and categorized GIs based on their responses to different situations like surface scaling and variable spatial frequency of folds. It is also seen that sometimes different GIs give incon-sistent or even conflicting results. For example, while most of the surface area-based methods and even Luders’ GI show that the frontal cortex is not much folded, Kim’s GI and Lebed’s GI put this region among highly folded regions. Another evidence of the inconsistency appears in relation with the brain volume and the degree of cortical folding : ROGERS et al. 2010, by using an extension
of Zilles’ GI to 3D, showed that GI decreases with brain volume while an inverse correlation has been reported in some papers by using other surface-area based methods (see e.g. TORO et al. 2008; LI et al. 2014; GERMANAUD et al. 2014)
and a curvature-based method (RABIEIet al.2016).
This inconsistency also occurs when the effects of pathologies on cortical com-plexity are studied. For example, in patients with 22q11 Deletion Syndrome, SCHAER et al.2008 and BAKKER et al. 2016by using Schaer’s GI reported only
decreased cortical complexity of some regions while BEARDEN et al. 2009 by using a fractal dimension-based GI found only increased complexity of occipital lobe. Even in group comparison studies, inconsistent results have been reported. For instance, by using a curvature-based method, LUDERSet al. 2006concluded that female brains are more complicated than men’s while ZHANG et al.2007b
found that men show more complex brain surface than women and no difference was detected when the brain complexity is measured by fractal dimension (LIU
et al.2003).
Accordingly, the concept of the surface complexity needs to be defined expli-citly. Moreover, a method should be developed to quantify this definition and satisfy some standard properties. We propose the following properties that a standard GI should possess :
1. Clear basis : A GI should be defined based on a definition of the "surface
complexity" notion. It means that before developing a method to measure
GI, a clear and reasonable definition of surface complexity should be given. Without having a clear definition of this notion, one may propose a new GI without knowing what the results are really meant. In this case, the effect of other geometric factors like the surface area or sulcal depth cannot be disentangled.
2. Physicality : A GI should have an interpretable physical meaning. In other
words, it should be proven mathematically and practically that the propo-sed GI quantifies the assumed definition of the surface complexity.
3. Locality : A GI should be defined locally. Although depending on its
appli-cation but in general, it is not adequate to describe a highly convoluted sur-face like the brain sursur-face only with a single value. So, a good GI should be computed locally to measure the surface complexity in a reasonable neigh-bourhood around each point of the cortex. In this case, it is also possible to derive a single value as global cortical complexity.
4. Multi–spatial scale : It is an advantage if a method can propose GIs in a
wide range of spatial scales. In other words, the locality of method around each point on the brain surface should be tuned easily from few millimeters (equivalent to N -ring neighbourhoods with small N ’s) to larger areas ( e.g. areas of labor size). In this way, the method can be used for a wide range of applications by changing few parameters of locality.
5. Consistency : To have a consistent analysis across all subjects of a database,
a GI should consider the inter-subject size variability. indeed, the size of neighbourhoods for each individual brain has to be adapted with the size of that individual brain surface. Otherwise, by using a fixed neighbourhood size for a small and a large brain, the neighbourhood covers relatively a larger proportion of the small brain than the large brain. In other words, there should exist a mechanism in the GI method to keep the relative spread of neighbourhoods constant across subjects.
Beside the global size adaptation, for some applications e.g. developmen-tal studies, it is an advantage for a GI method to have a mechanism of local size adaptation. It means that corresponding neighbourhoods across sub-jects should be adapted with respect to the local size of anatomical regions (see e.g. LIet al.2014and KIM et al.2016).
6. Geometric invariant : Geometric transformations such as translation,
rota-tion, reflection and scaling of a surface do not change its surface complexity. Consequently, it is reasonable to expect a good GI to preserve its value after such transformations. Otherwise, a kind of alignment is needed in prepro-cessing steps. However, as pointed out by YOTTERet al.2011, "alignment is
a complicated endeavor that often requires manual delineation of areas that correspond geometrically across subjects, such as gyral landmarks or cortical sulci."
7. Efficiency : A GI should to be computed in a reasonable time and memory.
In practice, efficiency is very important. There are some mathematical me-thods with interesting features that cannot be applied in this framework due to time and/or memory issues. For example, due to problems occurring sometimes in MR imaging of fetuses, segmentation algorithms fail which re-sults in noisy surface triangulation. Consequently, one would like to apply meshless processing methods instead of mesh-based methods to get rid of noisy triangulation. But, due to non-sparsity of meshless methods and large number of vertices needed to model a complicated brain surface, it requires too much processing time and memory and makes it impractical.