HAL Id: tel-02496674
https://tel.archives-ouvertes.fr/tel-02496674
Submitted on 3 Mar 2020HAL is a multi-disciplinary open access archive for the deposit and dissemination of sci-entific research documents, whether they are pub-lished or not. The documents may come from teaching and research institutions in France or abroad, or from public or private research centers.
L’archive ouverte pluridisciplinaire HAL, est destinée au dépôt et à la diffusion de documents scientifiques de niveau recherche, publiés ou non, émanant des établissements d’enseignement et de recherche français ou étrangers, des laboratoires publics ou privés.
Magnetic anomalies and plate tectonic history of the
Caribbean plate and the Gulf of Mexico
Andreina Garcia-Reyes
To cite this version:
Andreina Garcia-Reyes. Magnetic anomalies and plate tectonic history of the Caribbean plate and the Gulf of Mexico. Geophysics [physics.geo-ph]. Université Sorbonne Paris Cité, 2018. English. �tel-02496674�
Dedication
I dedicate this work to: two women who marked my life, my Mother, Cruz Elena Reyes de García, who passed away early, but not without leaving me the clear message that every woman should be independent, and that there is no way to achieve it except through disciplined study. To my grandmother Carmen Dolores Eizaga de Reyes, an example of honesty, strength and rectitude.
To my children.
To Caracas, to the Central University of Venezuela, to my Avila mountain; and finally, to all those who think that the past or that the present conditions of life are an impediment to transform reality into what we dream of.
Dedicatoria
Dedico este trabajo: a dos mujeres que marcaron mi vida, a mi Mamá, Cruz Elena Reyes de García, quien partió temprano, pero no sin dejarme el claro mensaje de que toda mujer debe ser independiente, y de que no hay forma de lograrlo sino a través del estudio disciplinado; a mi Abuela Carmen Dolores Eizaga de Reyes, por ser ejemplo de honestidad, fortaleza y rectitud.
A mis hijos.
A Caracas, a la Universidad Central de Venezuela, a mi Avila; y por último, a todos aquellos que piensan que el pasado o que las condiciones presentes de vida son un impedimento para transformar la realidad en aquello que soñamos.
Magnetic anomalies and plate tectonic history of the Caribbean plate and the Gulf of Mexico
Abstract
The origin of the Caribbean plate - Pacific or intra-American - is still under debate. We produced a magnetic map from our compilation of marine magnetic data in the Caribbean plate and the Gulf of Mexico (GoM) in order to perform a magnetic interpretation which could contribute to the debate. In the GoM, we relate a set of fan-like long-wavelength magnetic anomalies with seafloor spreading. We interpret these anomalies by comparing them to filtered polarity time scales and identify the fossil ridge axis. We then carry out plate tectonic reconstruction to establish the initial tectonic framework and evolution of the GoM. The GoM opened asymmetrically in two stages, starting during the Kimmeridgian and ceasing in the Berriasian. We interpret the strong magnetic anomalies and neighboring smoothed magnetic anomalies extending from South to North in the Colombian Basin as Chrons 33 and 33r and the younger part of the CQZ. Comparing the width of magnetic anomalies 33 and 33r in the Colombia Basin, Atlantic and Pacific Oceans shows a similarity between those in the Colombian Basin and the Pacific Ocean. Forward modelling in the Colombian Basin allowed to propose a paleo-latitude of∼10°S and a spreading rate of ∼3.6 cm/yr. The crust in the Venezuela Basin shows North-South fracture zones and stronger magnetic variations that would be older, belonging to the middle part of the CQZ. The Caribbean plate more likely formed on the Pacific-Farallón spreading center.
Keywords: Caribbean Plate, Gulf of Mexico, magnetic anomalies, Colombia Basin, CLIP, Venezuela Basin.
Anomalies magnétiques et tectonique des plaques de la plaque Caraïbe et du golfe du Mexique
Résumé
L’origine Pacifique ou intra-Américaine de la plaque Caraïbe est toujours en débat. Nous avons produit une carte magnétique à partir de la compilation des données magnétiques marines de la plaque Caraïbes et du golfe du Mexique (GoM) afin de contribuer au débat. Dans le GoM, nous interprétons un ensemble d’anomalies magnétiques en éventail de grande longueur d’onde comme liées à l’expansion des fonds océaniques. Nous les identifions par comparaison avec de versions filtrées de l’échelle des inversions de polarité magnétique et lo-calisons l’axe d’expansion fossile. Nous effectuons des reconstructions paléogéographiques pour établir le cadre tectonique initial et l’évolution du GoM, ouvert asymétriquement entre le Kimmeridgien et le Berriasien. Nous interprétons les fortes anomalies magnétiques et puis celles, plus lisses, observées du Sud au Nord dans le bassin de Colombie comme les Chrons 33 et 33r et la partie la plus récente de la Période Magnétique Calme du Crétacé (CQZ). Nous comparons la largeur des anomalies magnétiques 33 et 33r du bassin de Colombie et des océans Atlantique et Pacifique pour remarquer une similitude entre bassin de Colombie et océan Pacifique. La modélisation directe dans le bassin de Colombie conduit à une paléo-latitude de∼10°S et un taux d’expansion de ∼3,6 cm/an. Le bassin du Venezuela présente des zones de fracture Nord-Sud et des variations magnétiques de plus forte amplitude qui se-rait plus anciennes, reflétant la partie médiane du CQZ. La plaque Caraïbe s’est formée au centre d’expansion Pacifique-Farallón, et la province magmatique Caraibe (CLIP) serait liée au point chaud des Galápagos.
Mots-clés : Plaque Caraïbes, golfe du Mexique, bassin du Colombie, bassin du Venezuela, anomalies magnétiques, CLIP
Anomalías magnéticas e historia de la tectónica de placas en la placa Caribe y el Golfo de México
Resumen
El origin de la placa Caribe - Pacífico o intra-América - está todavía dentro de debate. En esta investigación se produjo un mapa magnético a partir de nuestra compilación de da-tos magnéticos marinos en la placa Caribe y el Golfo de México (GoM) con el objetivo de realizar una interpretación magnética que sirva de contribución al debate. En el Golfo de México, relacionamos al conjunto de anomalías en abanico y de longitud de onda larga con la expansión del piso oceánico. La interpretación de estas anomalías se realizó median-te su comparación con diferenmedian-tes escalas de tiempo de la polaridad geomagnética filtradas y mediante la posterior identificación de la cresta de la dorsal fósil. A partir de esos resul-tados, realizamos la reconstrucción de placas tectónicas para establecer el marco tectónico inicial y la evolución del GoM. El piso oceánico del GoM se expandió asimétricamente en dos estadios de rotación, comenzando durante el Kimmeridgiense y cesando en el Berria-siense. Desde el Sur al Norte de la cuenca de Colombia, son observadas una secuencia de anomalías fuertes y otra secuencia de anomalías suaves las cuales son interpretadas como los Cronos 33 y 33r y parte del Cretácico Quieto Temprano. La comparación del ancho de las anomalías magnéticas 33 y 33r en la cuenca de Colombia con anomalías en los océanos Pa-cífico y Atlántico permitió establecer la similaridad entre las mismas con las anomalías en el Océano Pacífico. El modelado directo en la cuenca de Colombia permitió proponer una paleo-latitud de∼10°S y una velocidad de expansión de ∼3.6 cm/yr. La corteza en la cuen-ca de Venezuela presente zonas de fractura en dirección Norte-Sur y variaciones magnéticuen-cas fuertes que podrían ser más antiguas, siendo su edad correspondiente al período intermedio del Cretácico Quieto. La placa Caribe podría haberse formado sobre el centro de expansión Pacífico-Farallón.
Palabras claves: placa Caribe, Golfo de México, anomalías magnéticas, cuenca de Colom-bia, CLIP, cuenca de Venezuela.
Contents
Contents x
List of Figures xiv
List of Tables xx
1 Introduction 1
1.1 Problem statement . . . 1
1.2 Latest research . . . 2
1.2.1 Caribbean plate boundaries . . . 4
1.2.2 Geological history of the Caribbean plate . . . 6
1.2.2.1 Spreading events . . . 6
1.2.2.2 Cretaceous-Eocene history . . . 7
1.2.3 Models of origin of the Caribbean plate . . . 7
1.2.3.1 Arguments supporting the Pacific origin of the Caribbean plate . . . 9
1.2.3.2 Arguments supporting the Intra-Americas origin of the Caribbean plate . . . 11
1.2.4 Inner Caribbean plate . . . 11
1.2.4.1 Yucatán basin . . . 12 1.2.4.2 Cayman Trough . . . 12 1.2.4.3 Colombian Basin . . . 13 1.2.4.4 Nicaragua Rise . . . 14 1.2.4.5 Venezuelan Basin . . . 15 1.2.4.6 Beata Ridge . . . 15 1.2.4.7 Aves Ridge . . . 17
1.2.5 Caribbean volcanic province . . . 18
1.2.5.1 Origin . . . 18
1.2.6 Island Arcs of the Caribbean . . . 19
1.2.6.1 Greater Antilles . . . 19
CONTENTS
2 Marine magnetic anomaly map of the Caribbean and the Gulf of Mexico 30
2.1 Introduction . . . 31
2.2 Objectives . . . 33
2.3 Theory . . . 33
2.3.1 Main internal magnetic field . . . 34
2.3.2 Magnetic anomalies . . . 35
2.3.3 Source of errors . . . 36
2.3.3.1 Heading effect . . . 37
2.3.4 Spectral analysis . . . 37
2.3.5 Principal component analysis . . . 38
2.4 Data and methods . . . 38
2.4.1 Aeromagnetic . . . 39 2.4.1.1 Data . . . 39 2.4.1.2 Method . . . 40 2.4.2 Marine data . . . 40 2.4.2.1 Data . . . 40 2.4.2.2 Method . . . 41
2.4.3 Main internal magnetic field removal . . . 42
2.4.4 Preprocessing of marine magnetic anomalies . . . 42
2.4.4.1 Detecting outlying surveys . . . 42
2.4.4.2 Detecting erroneous acquisition time . . . 47
2.4.4.3 Evaluation of the magnetic heading effect . . . 49
2.4.5 Levelling . . . 49
2.4.5.1 Detection of internal and external crossovers . . . 49
2.4.5.2 Internal levelling . . . 52
2.4.5.3 External levelling . . . 53
2.4.5.3.1 Unshifting: . . . 53
2.4.5.3.2 Distribution of the crossovers data using x2sys: 53 2.4.6 Frequency analysis and band-pass filtering . . . 53
2.4.7 Statistical validation of the maps: Principal component analysis on the magnetic anomalies and error ellipses. . . 54
2.5 Results . . . 57
2.5.1 Aeromagnetic data . . . 57
2.5.1.1 Long wavelength magnetic anomaly map . . . 57
2.5.1.2 Short wavelength magnetic anomaly map . . . 60
2.5.1.3 Frequency histogram analysis . . . 61
2.5.2 Compiled database . . . 62
2.5.3 Marine magnetic anomalies . . . 63
2.5.3.1 Caribbean domain and surroundings . . . 63
CONTENTS
2.5.5 Comparison of the short wavelength map with previous works . . . 70
2.5.5.1 Short-wavelengths on the Yucatán Basin . . . 70
2.5.5.2 Short-wavelengths on the Eastern Caribbean plate . . . . 70
2.5.5.3 Short-wavelengths on the Nicaragua Rise . . . 71
2.5.6 Validation of the dataset . . . 71
2.5.6.1 Power spectrum of the magnetic anomalies . . . 71
2.5.6.2 Statistical validation: Principal component analysis on the magnetic anomalies and error ellipses. . . 79
2.6 Conclusions . . . 85
2.7 References . . . 85
3 Plate tectonics on the Gulf of Mexico from gravity and magnetic data 93 3.1 Introduction . . . 94
3.2 Problem statement . . . 95
3.3 Aim . . . 98
3.3.1 Limitations from potential field data . . . 99
3.4 Geological background . . . 101
3.4.1 Margins . . . 101
3.4.2 Models of opening of the GoM . . . 102
3.4.2.1 Principal tectonic events that occurred from 200 to 164 Ma 102 3.4.2.2 Single mantle plume model . . . 103
3.4.3 Regional geological structures . . . 103
3.4.3.1 Western Main Transform Fault . . . 103
3.4.3.2 Sabine Block . . . 103
3.4.3.3 Yucatán Block . . . 103
3.4.3.4 Florida Block . . . 105
3.4.4 Crust in the GoM . . . 106
3.4.4.1 Stratigraphy . . . 106
3.4.4.2 Thickness . . . 107
3.4.4.3 Physical properties . . . 107
3.4.4.4 Ages . . . 107
3.4.5 Evolution models . . . 108
3.4.5.1 Implications (fromVan Avendonk et al.,2015) . . . 108
3.4.6 Salt migration and deposition . . . 109
3.5 Data . . . 111
3.6 Methodology . . . 112
3.6.1 Mapping and interpretation of the magnetic and gravity fabric . . . 112
3.6.1.1 Determination of the trial Euler poles from FZs . . . 113
3.6.1.2 Identification of magnetic isochrons . . . 115
CONTENTS
3.7.1 Mapping and interpretation of the magnetic and gravity fabric . . . 117
3.7.1.1 Surroundings of the Gulf of Mexico . . . 117
3.7.1.2 Interior of the Gulf of Mexico . . . 117
3.7.1.3 Synthesis of the maps interpretation . . . 118
3.7.2 Trial Euler poles . . . 120
3.7.2.1 Laying the foundations for the plate tectonic reconstruction in the GoM . . . 120
3.7.3 Closure . . . 124
3.7.4 Stage poles of rotation and spreading asymmetry . . . 125
3.7.5 Magnetic isochrons and Spreading rates on the GoM . . . 131
3.8 Discussion . . . 138
3.9 Conclusion . . . 143
3.10 References . . . 144
4 Magnetic anomalies in the Colombia and Venezuela Basins 152 4.1 Introduction . . . 152
4.2 Method and results . . . 157
4.3 Magnetic anomalies in the Venezuela and Colombia basins . . . 157
4.3.1 The Colombia Basin . . . 157
4.3.2 The Venezuela Basin . . . 158
4.3.3 Origin of the Caribbean plate . . . 160
4.3.4 Discussion . . . 165
4.4 Conclusion . . . 170
4.5 References . . . 171
5 General conclusions and Perspectives 174 5.1 General conclusions . . . 174
5.2 Perspectives . . . 176
5.3 References . . . 177
6 Conclusions générales et Perspectives 178 6.1 Conclusions générales . . . 178
6.2 Perspectives . . . 180
6.3 References . . . 181
A Carte Structurale des Caraïbes 182 A.1 Le projet et ma contribution . . . 182
B References 184 B.1 References . . . 185
List of Figures
1.1 Simplified geology of the Caribbean domain (from internal reports of the Commission for the Geological Map of the World (CCGM, (Bouysse et al.,
2016))) . . . 3 1.2 Caribbean domain and main features . . . 5 1.3 Diachronous eastward displacement of the Caribbean plate relative to the
North and South American plates. Black solid lines represent: 1 =∼80 Ma, 2 = ∼60 Ma, 3 = ∼44 Ma, 4 = ∼30 Ma, 5 = ∼14 Ma, 6 = ∼5 Ma, 7 = Recent. Contours filled with yellow represent foreland basins produced by diachronous oblique convergence between the Caribbean, North American and South American plates. Abbreviations: SB= Sinu Belt, WC = Western Cordillera, SJB = San Jacinto Belt, SNM = Santa Marta Massif, CC = Central Cordillera, EC = Eastern Cordillera, SM = Santander Massif, MA = Merida Andes, LN = Lara Nappes, CCO = Cordillera de la Costa, APP = Araya-Paria Peninsula, SI = Serrania del Interior, and NR = Northern Range of Trinidad (from (Escalona and Mann,2011)) . . . 6 1.4 Opening of the South Atlantic (model from (Pérez-Díaz and Eagles, 2014,
2017)) . . . 8 1.5 Comparison of time span between different models about the origin of the
Caribbean plate . . . 9 1.6 Coincidence of the Galapagos hotspot (red) and the Caribbean
Plateau-polygon at 94 MaNerlich et al.(2014) . . . 10 1.7 Map of the extent of the Caribbean LIP and eastern Cayman Trough passive
margin in the Jamaica passage (Corbeau et al.,2016) . . . 13 1.8 Unmigrated stacked seismic section on the Beata Ridge (Diebold,2009) . . 16 1.9 Conceptual plate boundary configurations illustrating the origin of the
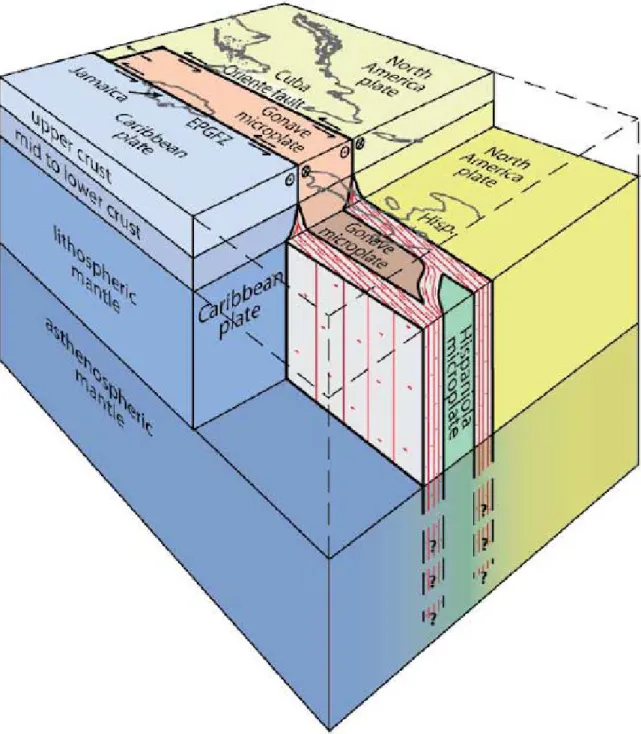
Caribbean lithosphere at 200 Ma. Proto-Caribbean/Atlantic origin (a), Panthalassa origin (b) (fromBoschman et al.,2014) . . . 19 1.10 Three-dimensional model for the lithosphere in the northern Caribbean.
Fabric (red) has a vertical foliation and horizontal lineation and is localized at borders of microplates, whereas the interior of microplates has no fabric
LIST OF FIGURES
2.1 Main geographical features on the Caribbean region . . . 32
2.2 Histogram of surveys per year . . . 33
2.3 Total magnetic field intensity IGRF12 (http://www.gfz-potsdam.de) . . . . 34
2.4 Marine magnetic anomalies (FromBurger et al.(2006)) . . . 35
2.5 Aeromagnetic tracklines location (Legend: Red circles indicate Syledis navigation stations location, blue triangles indicate ground magnetometer location) (MENEVEN,1983) . . . 39
2.6 Marine and aerial tracks location . . . 41
2.7 Plot of marine magnetic anomalies located between 55°W and 52.5°W showing outliers . . . 43
2.8 Plot of marine magnetic anomalies located between 65°W and 62.5°W showing outliers . . . 44
2.9 Plot of marine magnetic anomalies located between 65°W and 67.5°W showing outliers . . . 45
2.10 Plot of marine magnetic anomalies located between 17.5°N and 20°N showing outliers . . . 46
2.11 Magnetic anomalies versus decimal year showing erroneous registered acquisition time (Labels "a", "b", and "c" exhibit errors whilst "d" has a correct time, red boxes indicating identified erroneous time) . . . 47
2.12 Accumulated distance vs. ship velocity . . . 48
2.13 Accumulated distance vs. Ship velocity (featuring negative velocities) . . . 48
2.14 Magnetic anomaly vs. magnetic heading on the survey LWI932010 . . . 49
2.15 Heading effect and correction on magnetic anomalies . . . 50
2.16 First criterion used to determine the parameters for the internal cross-overs detection . . . 51
2.17 Amplitude of the external crossovers for the marine tracklines . . . 51
2.18 Internal levelling and correction curve . . . 52
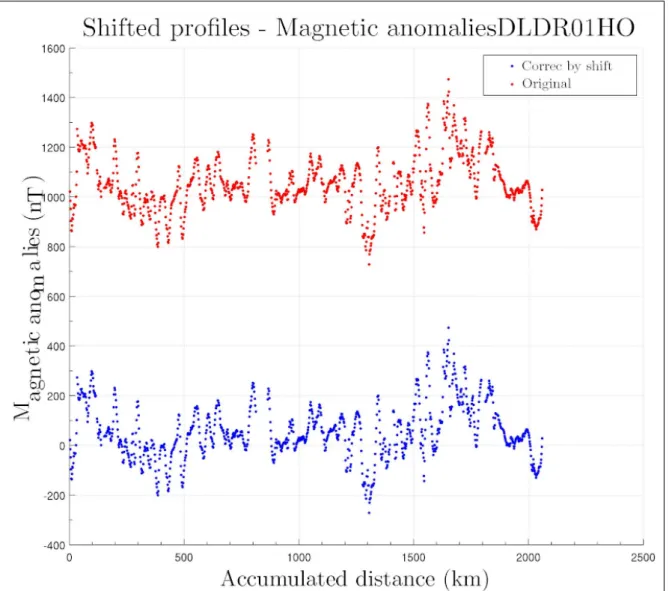
2.19 DLDR01HO survey before and after the unshifting step . . . 54
2.20 Example of the frequency analysis used . . . 56
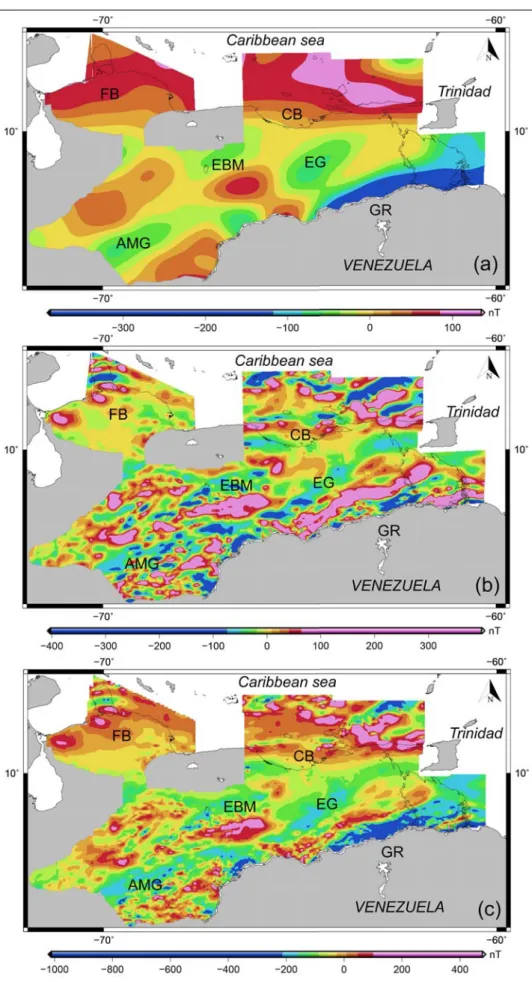
2.21 Aeromagnetic maps over Venezuela from processed magnetic anomalies (Legend: (a) Long wavelength map, (b) Short wavelength map, (c) Total magnetic anomaly map); Acronyms: FB=Falcón Basin, AMG= Apure-Mantecal Basin, EG= Espino Graben, CB=Cariaco Basin, EBM= El Baúl Massif, GR= Lake Guri) . . . 59
2.22 Frequency histogram from aeromagnetic data . . . 62
2.23 Frequency histogram of magnetic anomalies before and after processing . . 63
2.24 Total magnetic anomaly map . . . 66
2.25 Short-wavelength magnetic anomaly map . . . 67
2.26 Long wavelength magnetic anomaly maps (a: Reprocessed magnetic anomalies, b: WDMAM, c: MF7, d: GRIMM-L) . . . 69
LIST OF FIGURES
2.27 Short wavelength magnetic anomaly maps. (a: Reprocessed magnetic anomalies, b: Processed by NGDC, c: NAMAM, d: WDMAM) . . . 72 2.28 Short wavelength magnetic anomaly map of Yucatán Basin. (a: Reprocessed
magnetic anomalies, b: NAMAM, c: WDMAM) . . . 73 2.29 Short wavelength magnetic anomaly map of Eastern Caribbean plate. (a:
Reprocessed magnetic anomalies, b: NAMAM, c: WDMAM) . . . 74 2.30 Crust type in the Aves Ridge interpreted from potential field data . . . 75 2.31 Short wavelength magnetic anomaly map of Nicaragua rise. (a: Reprocessed
magnetic anomalies, b: NAMAM, c: WDMAM) . . . 76 2.32 Crust type in the Nicaragua Rise interpreted from potential field data . . . . 77 2.33 Radially averaged spectrum of the magnetic anomalies for long wavelengths
over the Caribbean region and the Gulf of Mexico . . . 77 2.34 Radially averaged spectrum of the magnetic anomalies for short wavelenghts
over the Caribbean region and the Gulf of Mexico . . . 78 2.35 Plain and tridimensional view of the bivariate frequency calculated from the
magnetic anomalies of the GRIMM-L, WDMAM and MF7 datasets and the magnetic anomalies from this study in the Caribbean region and the Gulf of Mexico . . . 80 2.36 Bivariate frequency from long wavelength datasets. (Using: MF7 (a),
WDMAM (b) and GRIMM-L (c)) . . . 81 2.37 Bivariate frequency from short wavelength datasets. (Using: NAMAG (a)
and WDMAM (b) . . . 81 2.38 Location of the discrepancies between previous datasets and the processed
magnetic anomaly for long wavelengths (Using: MF7 (a), WDMAM (b) and GRIMM-L (c)) . . . 83 2.39 Location of the discrepancies between previous datasets and the processed
magnetic anomaly for short wavelengths (Using: NAMAG (a) and WDMAM (b) . . . 84 3.1 Simplified geology of the Gulf of Mexico (from Bouysse et al., 2015) . . . 96 3.2 COB estimations from different authors (Eagles et al.,2015) . . . 97 3.3 Plate tectonic reconstruction in the GoM at 200 Ma (from (Pindell,1994)) . 97 3.4 Base maps of this study: Vertical gradient of gravity (Sandwell et al.,2014)
(a) and marine magnetic anomalies (b) . . . 100 3.5 Previously interpreted fracture zones over Eastern North America (from
(Thomas et al.,2006)) . . . 101
3.6 Structural interpretation of the GoM from magnetic anomalies (from Tectonic Analysis) . . . 104 3.7 Map showing Gondwana terranes along the Atlantic and GoM (From
LIST OF FIGURES
3.8 Tectonic map and location of salt domes in the GoM (from (Worrall and
Snelson,1989)) . . . 110
3.9 Location of the magnetic profiles used individually in this study . . . 111 3.10 Estimation of the Euler pole produced by our Matlab algorithm. Great circles
passing perpendicular to the simulated FZ and by the Euler pole (a); detail of the different great circles calculated in the GoM (b) and, global view showing the two set of solutions for the location of the Euler poles, bars represent the statistical frequency of the crossings between the great circles (c) . . . 115 3.11 Parameters that we used to apply the oblique Mercator projection (a) and
an example of the use of the Oblique Mercator projection for the Central Atlantic (b) . . . 116 3.12 Three fan-like magnetic anomalies on each flank. Central anomalies are
marked by 1, 2 and 3; outer anomalies ’*’; dashed black lines represent the boundaries of the Yucatán Block and Florida Block respectively . . . 120 3.13 Focus on the Pangea reconstruction from magnetic and gravity data
respectively. Pangea reconstruction based in magnetic data from WDMAM 2.0 (a), focus in the Southern North American continent-Northern South American-Western African continent fit 200 Ma ago, observed amplitude of the magnetic anomalies in the North American continent is stronger than those observed over the South American continent and the African continent (b), similar reconstruction were performed using vertical gradients of gravity (c and d) . . . 121 3.14 View of the Pangea reconstruction from gravity (b), topographical (c) and
magnetic data (d) centred in the Atlantic Ocean . . . 123 3.15 Tectonic reconstruction of the Gulf of Mexico from magnetic anomaly . . . 124 3.16 Adopted tectonic model from VGG (a) and magnetic anomaly data (b).
Dashed yellow lines represent the correlation that we observe between magnetic anomalies highs of the Yucatán Block and the Florida Block respectively. Dashed fuchsia line represents the respective correlation for the magnetic anomalies lows . . . 125 3.17 Extended view of the adopted tectonic model from VGG and magnetic
anomaly data . . . 126 3.18 Magnetic and gravity maps in polar projection, using the Total Euler pole as
pole of the projection . . . 127 3.19 Interpretation of the conjugated magnetic anomalies in the GoM. Colors
represent different stages of rotation: Light violet represents a younger rotation stage than darker violet (outer magnetic anomalies) . . . 128 3.20 Flow lines showing the different stages of rotation in the GoM . . . 129
LIST OF FIGURES
3.21 Sketch of the location of the Yucatán Block at different stages of rotation. Legend: Points pattern represent the distribution of the salt provinces over the GoM; flowlines indicate the path followed by the Yucatán Block during the rotation; each color line represent a half-stage of rotation . . . 130 3.22 Percentage of asymmetry along the different stages of rotation . . . 131 3.23 Marine magnetic anomalies from west to east of the GoM as estimate from
our grid. We plotted the profiles centered in the ridge axis . . . 133 3.24 Magnetic wiggles from the previously extracted profiles . . . 134 3.25 Filtered geomagnetic time scale (normal polarity). In the background,
vertical lines in colours represent the geomagnetic polarity time scales before filtering . . . 135 3.26 Filtered geomagnetic time scale (inverse polarity). In the background,
vertical lines in colours represent the geomagnetic polarity time scales before filtering . . . 135 3.27 Identified isochrons in the GoM. ’d1’ represent the ridge axis whereas
’d2’ represent the inner conjugated magnetic anomalies, associated to the isochron M24n . . . 136 3.28 Identified magnetic isochrons in the GoM with previously identified
isochrons in the Central Atlantic (Isochrons from (Seton et al., 2014) database updated on July-2018) . . . 139 3.29 In the figure, our proposed GoM reconstruction is showed together with
models suggested by other authors (Lundin and Doré, 2017; Nguyen and
Mann,2016;Pindell et al.,2016) . . . 140
3.30 Position of the Yucatán Block at 245 Ma as an implication of our proposed model . . . 141 3.31 Crustal terrains with our COB interpretation in the GoM (zoom in to the
Structural Map of the Caribbean - see Appendix A) . . . 142 4.1 Global distribution of large igneous provinces (Bouysse, 2009). Colors
represent crustal ages and are according to the Commission for the Geological Map of the World, excepting orange color which represents oceanic plateaus . . . 154 4.2 Interpretation of thickened oceanic crust in the Caribbean domain from
seismic data (Meschede and Frisch,1998) . . . 155 4.3 Magnetic profiles previously interpreted over the Venezuela Basin, the Aves
Ridge and the Grenada Basin (Donnelly,1973;Ghosh et al.,1984) . . . 156 4.4 N-S profiles used to evaluate the magnetic anomalies in the Colombia Basin.
The grid of Vertical Gradient of Gravity is in the background. Color scale from blue to red, represents negative to positive VGG respectively. The Colombian Basin exhibits the minimum averaged VGG of this area . . . 158
LIST OF FIGURES
4.5 Extracted magnetic anomaly from tracks in the Colombia Basin. Solid black lines: Profile 1-CB extracted from the northern segment of the basin (a) and profiles 1, 2, 3 and 4 extracted in NS direction from the southern segment of the basin (b) . . . 159 4.6 Profiles used to evaluate the magnetic anomalies in the Venezuela Basin. The
grid of Vertical Gradient of Gravity is in the background. Color scale from blue to red, represents negative to positive VGG respectively. Solid black lines represent the direction of the extracted profiles whereas dashed black lines represent our tentative fracture zones (’a’ and ’b’) . . . 161 4.7 Approximately N-S trending magnetic profiles selected in the Venezuela Basin162 4.8 Magnetic interpretation over the Venezuela Basin from marine data. Black
dashed lines represent second order fracture zones, thick solid lines are the limit of a major fracture zone interpreted in the NS direction . . . 163 4.9 Magnetic interpretation from marine data superimposed on satellite
magnetic data (satellite magnetic data from (Olsen et al.,2017)) . . . 164 4.10 Magnetic anomaly map (from (Dyment et al., 2015)) used to compare
the wavelengths of magnetic anomalies obtained in the Colombia Basin with other marine magnetic wavelengths (In the Caribbean region, we replaced data with the database obtained in this study). Green boxes represent identified compatible areas in the Pacific Ocean and Colombia Basin respectively . . . 166 4.11 Close up on the evaluated area in the Pacific Ocean. We selected magnetic
data from available marine tracklines (a) and plotted the magnetic wiggles on those selected tracks (b) . . . 167 4.12 Sub-group of magnetic profiles in the Pacific Ocean used for the magnetic
modelling and comparison . . . 168 4.13 Forward modelling of the selected Pacific Ocean and Colombia Basin
magnetic anomalies . . . 168 4.14 Magnetic anomalies on the Cretaceous Normal Superchron (Granot et al.,
2012) . . . 169 4.15 Sediments thickness in the Caribbean region (from (Whittaker et al., 2013)
List of Tables
2.1 Description of track lines and total magnetic field measurements . . . 40 2.2 Statistics of the magnetic anomalies before and after the internal levelling . 55 2.3 Basic statistics of magnetic anomalies before and after their reprocessing . . 63 2.4 Statistics before and after the bivariate frequency analysis . . . 82 3.1 Stage poles for each rotation stage in the GoM respect to our interpreted
ridge axis . . . 125 3.2 Percentage of seafloor spreading symmetry from our proposed model for
each stage of rotation . . . 132 3.3 Average half-spreading rates for the youngest stage of rotation from the three
Chapter 1
Introduction
- In lak ‘ ech, - hala ken. - I am another you, - you are another me. — MAYAN GREETING
1.1
Problem statement
For many years, several authors noted the difficulty of interpreting magnetic anomalies within the Caribbean plate. Aside of the magnetic isochrons identified in the Colombia Basin (Christofferson,1973) and along the Cayman Ridge (e.g.,Leroy et al.,2000), seafloor spreading structures in the Caribbean plate remain unrevealed. The complexities in the interpretation of the marine magnetic anomalies in the Caribbean plate are mostly due to: longitudinal magnetic anomalies with an amplitude smaller than 10 nT which can be in the same order of the cultural noise (if the plate formed near the Equator); the presence of electro-jets currents which are also part of the cultural noise (these currents can produce peaks or outliers in the magnetic compilation with no geological meaning); very old magnetic profiles with problems of quality, large navigational uncertainties and instrumental calibration; large span in time of the marine magnetic tracks which can also be responsible of artifacts and large amplitude crossovers; magnetic anomalies produced by the volcanic layer which may mask the original magnetic anomalies in area of oceanic crust (the volcanic layer extends along the Venezuelan Basin, Colombia Basin, partially over the Nicaragua Rise and the south of the Hispaniola Island); in particular cases, inaccessibility to the documentation related to the acquisition and pre-processing of the marine tracks and, the lack of magnetic observatories in the Caribbean region, in general, which make infeasible to validate the magnetic measurements and correct them from variations of the external magnetic field. Usually, the use of global geomagnetic reference models (e.g.,Sabaka et al.,2004) allows to remove most of the variation of the external magnetic field from the measurements.
1.2. LATEST RESEARCH
magnetic data in the Caribbean area, and second, that data other than those of magnetic anomalies makes up most of the plate reconstruction models of the Caribbean area (e.g.,
Boschman et al., 2014; Calais et al., 1989;Giunta and Orioli, 2011; Meschede and Frisch,
1998;Pindell and Dewey,1982). However marine magnetic anomalies remain a suitable data
to address the still-pending issues in the Caribbean plate, ie. to interpret oceanic structures in the Caribbean seafloor, to identify the magnetic signature of the Caribbean Large Igneous Province (CLIP) and to determine where and when the CLIP and the Caribbean plate originated.
In this work we aim to revisit the marine magnetic anomalies in the Caribbean region in order to shed light on the magnetic provinces and contribute to the questions exposed above. We included the Gulf of Mexico (GoM) in our investigation because the Gulf constitutes a temporal and spatial reference for the plate tectonic reconstruction of the Caribbean plate.
1.2
Latest research
The three crustal provinces identified in the Caribbean are (see Fig. 1.1): (1) Precambrian crustal blocks underlain by pre-Mesozoic basement rocks; (2) continental crust formed during the Mesozoic and Cenozoic; and (3) a thickened oceanic crust of a plateau basalt set up in the Middle Cretaceous (e.g.,Bouysse et al., 2016; Meschede and Frisch, 1998). Pre-Mesozoic basement occurs in the pre-existent parts of the North and South American plates and the north of the Central American land bridge including southern Guatemala, Honduras, Nicaragua and the Nicaraguan shelf. A primitive Mesozoic and evolved Cenozoic magmatic arc forms the south-eastern part of the Central American land bridge in Costa Rica and Panama, built on top of Caribbean oceanic crust (Meschede and Frisch, 1998). Marine Triassic is not known in the Caribbean region (e.g.,Woodring,1928).
1.2. LATEST RESEARCH Figure 1.1 – Simplified geology of the Caribbean domain (from internal reports of the Commission for the Geological Map of the W orld (CCGM, ( Bouysse et al. , 2016 )))
1.2. LATEST RESEARCH
1.2.1
Caribbean plate boundaries
A 100-250 km wide seismic zone defines the convergent boundary between the Caribbean and North America tectonic plates. This zone consists mainly of left-lateral strike-slip deformation extending over 2000 km along the northern edge of the Caribbean Sea (e.g.,
Leroy et al., 2000; Mann et al., 1995) (see Fig. 1.1). Leroy et al.(2000) and Rosencrantz
(1990) proposed that the location of the north-western edge of this boundary by a convergent domain defined along the Cayman Trough. Rosencrantz (1990) interpreted this boundary edge as a younger boundary that dissects and overprints the older convergent one; hence, it may preserve in its interior the record of the concurrent history of the Caribbean. Timing records of the spreading age in the Cayman Trough may also be present in this boundary. Towards the north-east, a transition from this convergent margin in La Hispaniola evolves to an extensional margin up to Puerto Rico, where a subduction system takes place (see Fig. 1.2).
First, the oblique convergence of the Atlantic oceanic lithosphere and second, the subduction of that oceanic lithosphere beneath the lithosphere of the Greater Antilles dominate the W-E variations of the Caribbean-North American margin (e.g.,Symithe et al.,
2015). The north-eastern edge of this margin exhibits three types of subduction systems: an oblique subduction/collision with strain partitioning in Hispaniola; an oblique subduction with no strain partitioning in Puerto Rico and, an along-strike transition to a plate boundary-normal subduction farther east in the Lesser Antilles (Calais et al.,2016). Escalona and Mann
(2011) proposed seven families of faults related to the diachronous eastward displacement of the Caribbean plate relative to the North and South American plates.Calais et al.(1989) and
Symithe et al.(2015) identified an intra-arc strike-slip faults family related to the eastward
motion of the Caribbean plate in relation to North America and a family of faults linked to the North American plate compression over the Caribbean. (Fig. 1.3).
Profound foreland basins, with sediment thickness ranging from 4 km to 18 km, with ages ranging from the Eocene to present and which become progressively younger to the east characterise the Southern boundary of the Caribbean plate (Audemard, 2009;Escalona and Mann,2011). Diachronous and oblique collision between the Caribbean arc and the passive margin of South America produced this boundary (Lugo and Mann,1995;Mann et al.,2006;
Pindell and Barrett,1990), which represents one of the most prolific hydrocarbon regions in
the world and comparable in reserves with those of the Middle East (Escalona and Mann,
2011). The Cayman Spreading Center (CSC) marks the western boundary of the Caribbean plate. Leroy et al.(2000) proposed that the CSC activated from the early Eocene (49 Ma). However, based on inherited rotated fault-structureten Brink et al.(2002) proposed 36 Ma for the initiation of the spreading. Ridge propagation allowed the formation of basins and established the Walton-Enriquillo fault system. The parallel magnetic lineations observed for north and south of the Cayman Ridge delimit those basins. A first phase of compression
1.2. LATEST RESEARCH Figure 1.2 – Caribbean domain and main features
1.2. LATEST RESEARCH
Figure 1.3 – Diachronous eastward displacement of the Caribbean plate relative to the North and South American plates. Black solid lines represent: 1 = ∼80 Ma, 2 = ∼60 Ma, 3 = ∼44 Ma, 4 =∼30 Ma, 5 = ∼14 Ma, 6 = ∼5 Ma, 7 = Recent. Contours filled with yellow represent foreland basins produced by diachronous oblique convergence between the Caribbean, North American and South American plates. Abbreviations: SB= Sinu Belt, WC = Western Cordillera, SJB = San Jacinto Belt, SNM = Santa Marta Massif, CC = Central Cordillera, EC = Eastern Cordillera, SM = Santander Massif, MA = Merida Andes, LN = Lara Nappes, CCO = Cordillera de la Costa, APP = Araya-Paria Peninsula, SI = Serrania del Interior, and NR = Northern Range of Trinidad (from (Escalona and Mann,2011))
Arc is the eastern boundary of the Caribbean plate. A chain of volcanic islands form the arc and north-south extend from Anguilla and Saba up to the Grenada volcanic island (e.g.,
Schlaphorst et al., 2017). The Grenada Basin and the Aves Ridge form the western limit of
the arc. The Tobago Basin neighbours the arc on its southeast edge (e.g.,Christeson et al.,
2008). The arc originated from the relatively slow subduction (∼2 cm/yr; (DeMets et al.,
2000)) of the North and South American plates beneath the eastern Caribbean plate.
1.2.2
Geological history of the Caribbean plate
1.2.2.1 Spreading events
Among the most important seafloor spreading events known within the Caribbean region in chronological order are:
1. Spreading in the Central Atlantic Ocean from the Lower Callovian to the present (from 166 Ma);
1.2. LATEST RESEARCH
(from 164 Ma to 100 Ma);
3. Spreading in the Gulf of Mexico from the Upper Jurassic until the Neocomian (from approx. 140 Ma to 131 Ma);
4. Opening of the southern part of the South Atlantic Ocean from the Aptian (see Fig. 1.4);
5. Opening of the northern part of the South Atlantic Ocean from the Albian (see Fig. 1.4);
6. the spreading of the still active Cayman Trough from the Middle Eocene (Calais et al.,
1989, and references therein). 1.2.2.2 Cretaceous-Eocene history
Cretaceous: Stéphan et al. (1990) considered the Campanian magmatic arcs reported in North America, South America, Mexico, and Colombia as first order geotectonic elements and related them to folding, thrusting and metamorphism (e.g.,Calais et al.,
1989).Iturralde-Vinent et al.(2016) reported the coexistence of these arcs with
Proto-Caribbean fragments of oceanic crust (of Atlantic affinity) and, oceanic lithosphere of Pacific origin in Cuba.
Eocene: Transpressive intense tectonics and the transpression active since 57-48 Ma along the northern and southern boundaries of the Caribbean plate, resulted in different families of major strike-slip faults and deformations zones. Both faulting and deformation zones passed through several stages. Those stages gave birth to the main structural basins and ranges of this area (e.g.,Calais et al., 1989;Escalona and Mann,
2011; Stéphan et al., 1990). Baquero et al. (2015) reported a rifting event related
with the post-Great Arc of the Caribbean. This event could affect the Falcon basin in western Venezuela from 34 Ma to 15.4 Ma.
1.2.3
Models of origin of the Caribbean plate
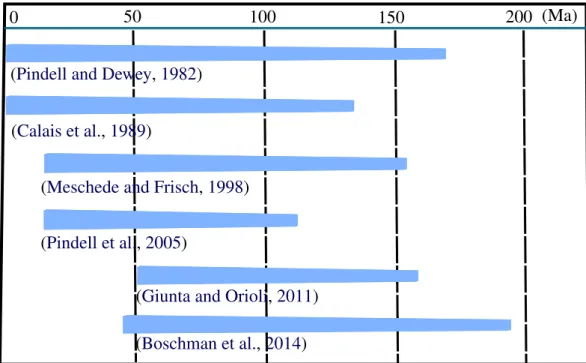
Proposed models about the origin of the Caribbean plate and the Gulf of Mexico (GoM) span from different geological times (Fig. 1.5) and are mostly based on geological observations and paleomagnetic results, but the latter data are available only in a few locations (e.g.,Boschman et al.,2014;Calais et al.,1989;Giunta and Orioli,2011;Meschede
and Frisch,1998;Pindell and Dewey,1982).
The large sediment thickness, the absence of clearly identified magnetic anomalies associated with seafloor spreading dates and the absence of deep penetrating drills or deep seismic prevented to conclude on the age and nature of the Caribbean ash and to make plate tectonic reconstruction models other than speculative ones. Although most of the models agree on the fact that the Caribbean plate was in place at least during the Early Paleocene
1.2. LATEST RESEARCH
1.2. LATEST RESEARCH
(Pindell et al.,2005)
(Boschman et al.,2014)
(Meschede and Frisch,1998)
(Calais et al.,1989)
(Giunta and Orioli,2011)
(Pindell and Dewey,1982)
50 100 150 200
0 (Ma)
Figure 1.5 – Comparison of time span between different models about the origin of the Caribbean plate
(c. 65 Ma), Calais et al. (1989), Pindell and Dewey (1982) and Boschman et al. (2014) proposed two leading families of models for the origin of the Caribbean plate. The first family assumes that the plate came from far away in the west, i.e., a Pacific origin. In these models, the Caribbean plate is a fragment of the Farallon oceanic crust isolated from the eastern Pacific and emplaced between North and South America starting from the latest Cretaceous time onwards (see Fig. 1.3) (Duncan and Hargraves, 1984;Pindell and Dewey,
1982). These models also imply a convergence and collision of the Caribbean plate versus the proto-Caribbean during the Upper Cretaceous-Paleocene and large-scale sinistral strike-slip faults active from the Eocene until present (e.g.,Calais et al., 1989). A second family assumes a local formation, i.e., Intra-America or Atlantic origin.
1.2.3.1 Arguments supporting the Pacific origin of the Caribbean plate
1. Reconstruction of plate circuits of the Caribbean Plateau - Farallon Plate – Pacific Plate – Antarctica – Africa, with South and North America moving relative to Africa suggests a Pacific provenance for the Caribbean plate (e.g., Nerlich et al.,2014) (see Fig. 1.6);
2. Acton et al.(2000) used paleomagnetic data from ODP Sites 999 and 1001, to propose
a paleo-latitude for the Caribbean plate at 5°–15° south of its current position at approx. 80 Ma, which agrees with an origin in the Pacific Ocean west of the subduction zones active in the Central American region during the Cretaceous, but also with an origin within the Central American region.
1.2. LATEST RESEARCH
Figure 1.6 – Coincidence of the Galapagos hotspot (red) and the Caribbean Plateau-polygon at 94 Ma
1.2. LATEST RESEARCH
1.2.3.2 Arguments supporting the Intra-Americas origin of the Caribbean plate • Paleomagnetic data, which covers an age ranging from Jurassic to Paleocene, indicates
that the ophiolite complexes in Costa Rica and Panama formed in an equatorial position;
• The position of the ophiolites relative to South America remained unchanged since their origin;
• Basaltic rocks of the lower part of the ophiolites are of mid-ocean ridge type suggesting formation at a spreading center. Those basaltic rocks formed as part of the proto-Caribbean crust at a spreading axis in an intra-American position during Jurassic and Early Cretaceous times;
• The upper part of the ophiolites is mainly built up by island-arc and intraplate basalts. The island-arc basalts evolved at the Central American land bridge which started in the Middle Cretaceous;
• Meschede and Frisch(1998) related the Caribbean plateau basalt to intraplate basalts,
which thickened and stopped the movement of the Caribbean crust in the Middle Cretaceous to probably Campanian times;
• Orientations and time sequences of paleostress tensors calculated from fault-slip data in southern Mexico and Costa Rica reflect changes in relative plate motions along the Middle American convergent plate margin;
• And plate-tectonic reconstructions show an overlap between South America and parts of southern Mexico in Triassic to Middle Jurassic times (Pindell and Barrett, 1990;
Ross and Scotese, 1988). To solve the space problem, Meschede and Frisch (1998)
postulated that large-scale sinistral strike-slip movements along the Mojave-Sonora ‘Megashear’ in Northern Mexico (Amato et al., 2009; Anderson et al., 2005), the Trans-Mexican Volcanic Belt (Cebull and Shurbet,1987), the Motagua–Polochic fault system in Guatemala (e.g., Rosencrantz et al., 1988) and several second-order shear zones were active during the Early Mesozoic.
1.2.4
Inner Caribbean plate
It is generally accepted that a Cretaceous Oceanic Plateau made the Caribbean plate core, ’known as the Caribbean Large Igneous Province (CLIP)’. Extensive lava flows and distinct thickness of sediments which covers an igneous basement characterize the Caribbean plate. Lu and McMillen (1982) and Bowland (1993) over the Colombia Basin and Ladd
and Watkins(1980), Ladd et al. (1990) andDiebold et al.(1999) in the Venezuelan Basin
described several seismic units with typical oceanic material. The thickness of the crust in those units is around 5 km. Moreover, in the Venezuelan Basin, Colombian Basin, south of the Beata Ridge and in the Lower Nicaraguan Rise, seismic reflection and drills allowed the
1.2. LATEST RESEARCH
identification of the Carib Beds (Caribbean typical prominent reflection horizons A” and B”)
(Corbeau et al.,2016, and references therein.).
1.2.4.1 Yucatán basin
Basement structural provinces The Yucatán borderland, along the west side of the basin parallel to the Yucatán platform, represents the eastern extension of the platform, truncated by a complex paleo-transform boundary fault zone along its outer edge. A small, deep and rectangular oceanic basin of Paleogene age formed by rifting within the transform zone (66-23 Ma) dominates the central deep basins province east of the borderland. The Cayman Rise province, covering the eastern two-thirds of the basin, includes a prominent ENE - WSW trending linear topographic rise of unknown but probable volcanic origin (Rosencrantz,1996). Rosencrantz(1996) interpreted the rise that intersects and dips beneath the Cuban margin to the east along a buried trench to be a remnant of the Cretaceous subduction zone associated with the Cuban arc. Crustal thickness Seismic refraction profiles and regional gravity interpretations indicate
that crust beneath the deep north-central and western parts of the basin is oceanic, and that it thickens southward to more than 18 km beneath the Cayman Ridge (e.g.,
Bowin, 1968; Dillon et al., 1972; Dillon and Vedder, 1973; Ewing et al., 1960). In
contrast, heat flow and depth to basement measurements in the western part of the basin suggest that the underlying oceanic crust may be as young as Late Paleocene to Middle Eocene in age (Rosencrantz, 1996, and references therein.). In the Central deep basins, the basement depths range from 5 to 7 km, with an average of 6 km approximately. The basement horizon is relatively flat with a moderate relief of 200 to 500 m, and has a seismic reflection character typical of oceanic crust (nested, high-amplitude diffraction hyperbola) (Rosencrantz, 1990). There is no obvious structural break between the basement under the rise and deep basement to the south, however, and the seismic character of the two are similar. The orientation of the stepped terraces is unknown (Rosencrantz,1996).
Age The age of the oceanic crust underlying the northern Yucatán basin (and presumably the Cayman Rise) is unknown (Rosencrantz, 1996). Even though, it seems that the opening of the Cayman Trough started in the Early Eocene age (49 Ma, Ypresian)
(Leroy et al.,2000).
1.2.4.2 Cayman Trough
Pubellier et al.(2000) proposed first in the eastern part of the Gonâve microplate based on
paleotectonic reconstructions and magnetic mapping the presence of tilted blocks belonging to the Eastern Cayman Trough passive margin. The easternmost tilted block of the Eastern Cayman Trough passive margin imaged in previous surveys was the Holmes bank near
north-1.2. LATEST RESEARCH
east Jamaica (Leroy and Mauffret,1996). This passive continental margin related with the rifting episode of the Cayman Trough may extend until the Southern Peninsula of Haiti
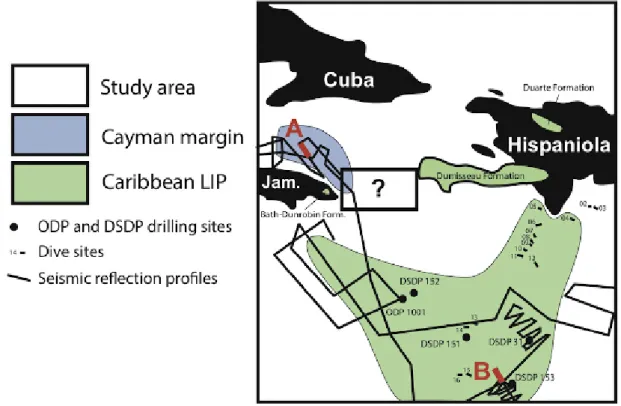
(Corbeau et al., 2016). The identification of the reflectors A”, B” and V on seismic profiles
may indicate that the CLIP extends until the southern part of the Jamaica Passage, at the north-eastern extreme of the Lower Nicaraguan Rise (Fig. 1.7) (fromCorbeau et al.,2016)
Figure 1.7 – Map of the extent of the Caribbean LIP and eastern Cayman Trough passive margin in the Jamaica passage (Corbeau et al.,2016)
1.2.4.3 Colombian Basin
A smooth, continuous and typically high amplitude acoustic basement characterizes most of the Colombian Basin. This reflector is comparable to the "smooth" horizon B" of the Venezuelan Basin. The smooth horizon B" in the Colombian Basin has never been sampled but may correspond to the top of basaltic sills interbedded with Upper Cretaceous sediments cored during Deep Sea Drilling Project (DSDP) Leg 15 (Sigurdsson et al.,1997). The crust in the Colombian Basin is relatively thin (approx. 8.5 km) where the acoustic basement is deepest and relatively thick (-15 km) beneath basement highs, such as the Mono Rise. The topography of the acoustic basement mirrors crustal thickness (Ewing et al., 1960; Houtz
and Ludwig, 1977). A rough basement that shows many characteristics of oceanic crust
underlines the southern parts of the Venezuela and Colombia basins (Mauffret and Leroy,
1.2. LATEST RESEARCH
1.2.4.4 Nicaragua Rise
The Nicaragua Rise (NR) is adjacent to the Colombian Basin, but it remains unexplored with only a few wells drilled on its carbonate platforms. The NR comprises two main structural provinces: the Northern Nicaragua Rise and the Southern Nicaragua Rise.
The Nicaragua Rise has a highly variable relief, and it is the product of an extensive deformation, including faults, troughs, and young volcanoes. The reflectors B", A", and eM are of Campanian, Middle Eocene, and Early Miocene ages respectively (Mauffret and
Leroy,1997).
Northern Nicaragua Rise Tectonic activity modified the bathymetry of the northern Nicaraguan Rise and the Isthmus of Panama (Roth et al., 2000). Cunningham
(1998), and references therein, places the initiation of tectonic activity and mini-basin formation in the Pedro Channel area at 16–11 Ma. Leroy and Mauffret(1996) related that activity to the change from a relatively extended period of quiescence on the northern Nicaraguan Rise to the uplift of Jamaica in the late middle Miocene. Carbonate banks that have remains of areas of neritic carbonate since the late Eocene drowned banks and reefs observed in Pedro Channel and Walton Basin formed an east-west barrier along the northern Nicaraguan Rise from the late Eocene to early Miocene. Some of the carbonate banks and barriers subsided and drowned as late as the late middle Miocene (Cunningham,1998;Roth et al.,2000).
Lower Nicaragua Rise Ewing et al.(1960),Edgar et al.(1971) andHolcombe et al.(1990) regarded the Lower Nicaragua Rise as of oceanic origin, similar to the crust in the Colombian Basin to the south. Its character is different from the northern Nicaragua Rise (Holcombe et al.,1990). A recent left-lateral transtensional tectonics is observed in the lower Nicaragua Rise; the Colombia Basin might have a motion towards the north-east relative to the rise (Mauffret et al., 2001a). The Lower Nicaragua Rise probably formed in the Pacific Ocean during the Mesozoic (approx. 88 Ma) as an oceanic plateau associated with the Galápagos hot-spot (Sigurdsson et al., 1997) and seems to be part of the CLIP. In the results of the IODP site 1001, Sinton
et al. (2000) reported an 81 ± 1 Ma age volcanic eruption (Campanian basalts).
Additionally the K/T boundary, tektites and carbonates recovered in this hole date from the Middle/Upper Miocene boundary. Results at ODP site 1001 reveal that the rise originated over a volcanic edifice likely located near the paleo-equator, as suggested by the very shallow paleomagnetic inclinations obtained from the basalt and overlying sediments.
Ash layers register three episodes of volcanism: 1. A Paleocene-early Eocene explosive volcanism documented at site 998 and attributed to the Cayman Ridge; 2. A smaller peak in the Early Paleocene, attributed to the Central American arc and 3. A brief episode in mid-Campanian time, perhaps associated with the activity of central
1.2. LATEST RESEARCH
volcanoes on the Caribbean Oceanic Plateau.
Boundaries The Hess Escarpment delimits the southern boundary of the Nicaragua Rise.
Burke(1988) andBurke et al.(1984) interpreted the Hess Escarpment as a left-lateral
fault boundary of the Caribbean plate, active during the Campanian (approx. 80 Ma). A diffuse zone of rifting and related volcanism between the Hess Escarpment and the Pedro fracture zone was active since the Miocene producing intraplate deformation. The base of the escarpment began between horizons B" and A", based on the occurrence of a sediment-filled, faulted half-graben at the base of the escarpment. ’The demise of carbonate neritic banks in the northern part of Pedro Channel and the central part of Walton Basin led to the observed modern configuration of shallow carbonate banks segmented by north-south oriented channels’ (Roth et al., 2000, and references therein).
Hess Escarpment Bowland (1993) interpreted the Hess Escarpment to be a transcurrent fault. Schwindrofska et al. (2016) suggested two contradictory origins for the Hess Escarpment: in the first one, the escarpment was part of the continental Chortis Block whereas in the second one volcanic rocks of the escarpment are related to the CLIP. Unlike the proposition that the Hess Escarpment is part of the continental Chortis Block, results show that the structure is of volcanic origin and most likely also belongs to the CLIP (Schwindrofska et al., 2016). Its morphology also confirms the volcanic nature. The Hess Escarpment represents a significant fault zone but, including the area north of the Escarpment, it also consists of seamounts, guyots, and ridges often located on the vast plateau like structures (Schwindrofska et al., 2016). Erosional channels, which are the result of sediment transport from the lower Nicaragua Rise into the Colombian Basin characterize the escarpment.
1.2.4.5 Venezuelan Basin
Diebold et al.(1981) documented pre-existing thin oceanic crust in the Venezuelan Basin.
Diebold (2009), and references therein, also indicated that dozens of volcanic edifices
marked the Venezuela Basin (Fig. 1.8) and associated them to the final phase of volcanism. They interpreted the seamounts in the Venezuela Basin as channels for the primary upper volcanic sequence.
1.2.4.6 Beata Ridge
It is generally accepted that the Beata Ridge is part of the CLIP. Schwindrofska et al.
(2016) attributed an age between 94 to 86 Ma to the Beata Ridge. The Beata plateau is a marginal unit of the Beata Ridge, where Mauffret and Leroy (1997) documented active transpressional deformation. The geochemical data show that the Beata Ridge has a composition typical for the CLIP (Schwindrofska et al.,2016).
1.2. LATEST RESEARCH
Figure 1.8 – Unmigrated stacked seismic section on the Beata Ridge (Diebold,2009)
Limits The central part of Hispaniola along a transverse NE alignment collides with the northern part of Beata Ridge, which constitutes a morpho-structural limit (Núñez et al.,
2016). The western flank of the Beata Ridge looks undeformed in the sediments, while the eastern flank looks deformed. Granja-Bruña et al. (2014) defines the northern Beata Ridge as a sequence of asymmetrically uplifted and faulted blocks of oceanic crust. Diebold(2009) identified on the eastern flank of the Beata Ridge, “thrust faults superimposed upon a regional flexure resulting from extension” on seismic profiles. Such regional flexure presumably resulted from the extension that uplifted Beata Ridge and thinned the Haiti Basin (Mauffret and Leroy, 1997). It is unclear if compression preceded the extension or if it was the opposite (Diebold, 2009). Kerr et al. (1997a) interpreted evidence on land for deformation of the volcanic plateau and attributed it to plateau or arc collision.
Structure The bathymetry and decreasing thickness towards La Hispaniola strongly influenced the sedimentary layer in the Haiti sub-basin (e.g., Mauffret and Leroy,
1997). The upper mantle thickness is between 20 km and 24 km below the Beata Island
1.2. LATEST RESEARCH
and Leroy,1997). The upper crustal layer is a complex sequence, whose stratigraphy
shows that the thickest part of the Caribbean volcanic plateau was experiencing east-west compressional deformation during the last stages of its emplacement (Diebold,
2009). Diebold(2009) identified Moho reflection over all seismic lines acquired over
the Venezuela Basin in contrast with intense deformation of the observed along the flanks of Beata Ridge and less often identification of the Moho reflection, and where it was "practically imperceptible the middle and lower crust." The upper crust is thick under Beata Island, suggesting to some authors that it is a thinned continental or transitional crust (Núñez et al.,2016).
Origin The Beata Ridge is more probably an oceanic plateau, and the thick crust formed during the Cretaceous volcanic event is not the result of thickening during the compressional deformation (Leroy and Mauffret, 1996). The formation of the South Caribbean deformed belt and the uplift of its edges disturbed the initial topography of the Beata Ridge during the early Miocene (Leroy and Mauffret,1996). Révillon et al.
(2000) proposed an intrusive origin for the Beata Ridge, "consisting of a dike and sill complex built during three volcanic episodes at 55, 76 and 90 Ma". The arrival of the Sala y Gomez and Galápagos plume at the base of the lithosphere produced a melting episode at 90 Ma and ’potentially’ at 76 Ma (Révillon et al., 2000). Lithospheric extension and thinning possibly initiated the 55 Ma episode (Révillon et al., 2000). A different hypothesis proposes that the oblique convergence of the Caribbean plate against the inactive Greater Antilles Island Arc originated the Beata Ridge (e.g.,
Granja-Bruña et al., 2014). Such oblique convergence resulted in the collision and
impingement of the thickened crust of the Beata Ridge into southern Hispaniola Island
(Granja-Bruña et al.,2014).
1.2.4.7 Aves Ridge
Some authors favour a no subduction model beneath the Aves volcanic arc because of the lack of evidence. The Aves volcanic arc probably formed after the collision located South of Yucatán (Mauffret et al., 2001a). The Aves Ridge is considered by others to be a remnant arc that precedes the Lesser Antilles arc (after.Bouysse,1984). Drills at DSDP site 148 found nannofossils within volcano-clastics sediments of Campanian-Maastrichtian age 83–65 Ma together with radiolarians of possibly Paleocene age (Edgar,1973). Although, the acoustic basement in the Aves Ridge is likely Middle Cretaceous age (Mauffret et al.,2001a). Although, petrological, trace element and isotopic constraints indicate that the granitoids have an oceanic crustal source and formed by melting of the lower arc, oceanic or oceanic plateau crust (Neill et al.,2011).
1.2. LATEST RESEARCH
1.2.5
Caribbean volcanic province
Several thick volcanic plateaus separated by deep basins contrasting with thinner crust comprise the Caribbean volcanic province (Mauffret and Leroy, 1997). The observed sills and dipping horizons on seismic profiles contributed to identify volcanism (Mauffret and
Leroy, 1997). Diebold (2009) reported two sequences in this plateau: the upper sequence
that shows reflecting horizons and the lower sequence that does not exhibit any reflector. The reflector B" indicates the top of the Cretaceous volcanic flows. The DSDP Leg 15 and the ODP Leg 165 drilled the reflector B" (Sigurdsson et al.,1997).
In the Venezuelan Basin, the upper sequence extends beyond the limits of the lower sequence, appearing to flow onto the pre-existing thin oceanic crust (Diebold et al., 1981). The thickness and volume of the upper volcanic sequence decrease from 10 km or more near the summit of the Beata Ridge to zero to the South-east (Diebold, 2009). Despite the variable thickness and the ridges and domes documented on the lower sequence, its thickness is usually higher than that of the thin oceanic crust of the SE Venezuelan Basin. Diebold
(2009) suggested that the upper volcanic sequence was not merely superimposed upon pre-existing oceanic crust and that the original crust must have been thickened by, and likely entrained within, the material forming the lower sequence.
Based on melting trends,Krawl(2014) proposed that composition samples from the CLIP implied a contribution from a more enriched source than a depleted source. The mantle source of the CLIP is heterogeneous at a length scale of∼102to 103km (Krawl,2014). 1.2.5.1 Origin
The origin of the Caribbean volcanic plateau remains controversial (e.g.,Diebold,2009). Recent models propose that the CLIP originated at 2000–3000 km east of the modern Galápagos hotspot (Boschman et al., 2014) (see Fig. 1.9). Diebold et al.(1999) concluded that the lower sequence predates the upper, which well correlated with models for a plume-generated oceanic plateau (e.g.,Farnetani et al., 1996;Kerr et al., 1997b). By analogy with results from ODP site 1001 samples (Sigurdsson et al.,1997), the inner sections of ’inflated flows’ likely formed much of the massive basalts. These flows may reach tens of kilometres in length as a result of lava injection into preexisting, insulating, extrusives (Umino et al.,
2006). On the other hand, dolerite sills and gabbros dominated on samples taken nearby with only occasional pillow basalts (Mauffret et al., 2001b; Révillon et al., 2000). This dichotomy suggests either a sampling scheme favouring a few competent sills, or a high degree of lateral heterogeneity in the CLIP, one in which transitions between flow-dominated emplacement and sill-dominated emplacement can take place within a short distance of much thicker sequences of flows (Diebold,2009).
1.2. LATEST RESEARCH
(a) (b)
Figure 1.9 – Conceptual plate boundary configurations illustrating the origin of the Caribbean lithosphere at 200 Ma. Proto-Caribbean/Atlantic origin (a), Panthalassa origin (b) (fromBoschman et al.,2014)
1.2.6
Island Arcs of the Caribbean
The intrusion of the oceanic Farallon plate into the Caribbean domain and the dispersion of the Gondwanan Block and the Laurentian Block resulted in the Caribbean volcanic arc (e.g.,Villeneuve and Marcaillou,2013).
1.2.6.1 Greater Antilles
The Jamaica Island, Cuba Island, La Hispaniola Island and Puerto Rico Island made up from west to east the Greater Antilles. In this section we synthesize the most relevant events in their geological history:
Cuba Cuban arc sequences include island-arc tholeiitic, calc-alkaline, and alkaline bimodal suites of volcanic and plutonic rocks. Remnants of Proto-Caribbean oceanic lithosphere occur as exhumed mélange bearing eclogite, blueschist, and garnet-amphibolite-facies tectonic blocks (oldest age ca. 120 Ma) within a serpentinite matrix intercalated with, or at the base of, the over-thrusted ophiolitic bodies (
Iturralde-Vinent et al., 2016). The Cuban orogenic belt defined the leading edge of the
Caribbean plate in late Cretaceous (Rosencrantz, 1996). During the Jurassic, the Pangea breakup and associated passive margin and the oceanic sedimentary layers and magmatic history are present in Cuba Island (Iturralde-Vinent et al., 2016;
Woodring, 1928). Thick sequences of Jurassic-Cretaceous strata and interlayered
basaltic rocks characterize the passive margin sequences found in the Guaniguanico terrane, allowing to relate the western Cuba with the Maya block passive margin, the Gulf of Mexico and the Bahamas Platform (Iturralde-Vinent et al., 2016). The collision and suturing of allochthonous Cuba terranes with the passive margin of the Bahamas platform followed the development of the Yucatán Basin (Pindell et al.,
1.2. LATEST RESEARCH
magmatic, and metamorphic evolution of an intra-oceanic Cretaceous-Paleogene ophiolite-arc complex. Iturralde-Vinent et al.(2016) proposed evidence of Paleogene “soft collision” and transfer of the NW Caribbean plate allochtonous (and Cuba) to the North American plate in Cuba Island (Iturralde-Vinent et al., 2016). In eastern Cuba, a new arc developed during Paleocene–middle Eocene times. The collision, which included overriding of the ophiolitic and arc units over both subducted and non-subducted passive margin sequences, also produced synorogenic basins and filled them, a process that continued until ca. 40 Ma. A local uplift and subsidence succeeded this fold belt to form late Eocene and Recent unconformable post-orogenic continental basins (Iturralde-Vinent et al.,2016).
Jamaica In the Jamaica Island, post-Jurassic arc and plateau rocks have been found in the igneous rocks of the Blue Mountains, Central, Above Rocks and Benbow Cretaceous Inliers and the Tertiary Wagwater Belt (Hastie, 2007) (Fig. 1.10). Hastie (2007) proposed that at 55 Ma Jamaica collided with the Yucatán peninsula and it was subsequently transported to the east due to the transtensional opening of the Cayman Trough.Corbeau et al.(2016) interpreted two crustal domains in the Jamaica passage: the first associated with the Eastern passive margin of the Cayman Trough and the second related with the CLIP, which may extend up to the north-eastern extreme of the Lower Nicaraguan Rise (Corbeau et al., 2016) (Fig. 1.7). Geochemical analysis confirmed the presence of a Cretaceous oceanic plateau section within the Blue Mountains and Cretaceous island-arc sequences, while in the Tertiary Wagwater Belt were discovered basalts and adakites (Hastie, 2007). Hastie(2007) proposed that the Bath-Dunrobin plateau lavas derive from a 90 Ma mantle plume which is distinct from the source regions for other Caribbean oceanic plateau lavas.
Hispaniola The north of the Hispaniola is colliding with the edge of the Bahamas Platform, as evidenced by offshore compressional structures (Calais et al.,2016, and references therein). The deformation observed might also be due to the transpression related to the collision of the Beata Ridge with its northern part and the left-lateral motion of the Enriquillo fault (Heubeck and Mann,1991;Mercier de Lepinay et al.,1988).
1.2.6.2 Lesser Antilles
The Lesser Antilles form an archipelago with a North-South orientation that comprises several islands: Barbados, Carriacou, Dominica, Grenada, Grenadines, Guadeloupe, Martinique, Saint Lucia, Saint-Vincent, Tobago, and Trinidad. Along the northern Lesser Antilles arc, the North American and Caribbean plates converge in a roughly ENE direction, at a rate between 1.8 to 2 cm/yr (DeMets et al.,2000). Subduction of Atlantic seafloor chiefly absorbs this motion under the arc (Feuillet et al.,2002, and references therein.). Feuillet et al.
1.2. LATEST RESEARCH
Figure 1.10 – Three-dimensional model for the lithosphere in the northern Caribbean. Fabric (red) has a vertical foliation and horizontal lineation and is localized at borders of microplates, whereas the interior of microplates has no fabric (fromBenford,2012)
1.3. REFERENCES
Caribbean and North American plates. In the upper plate, arc-parallel and arc-perpendicular faults create graben and crosscut the volcanic arc in echelon pattern respectively. Those faults are the result of the left-lateral trench parallel component of the convergence which is accommodated above the subduction interface (Feuillet et al., 2002). From the Early Cretaceous to the Paleocene, an active island-arc occupied the northern part of the Lesser Antilles as far as the southern part of the Guadeloupe archipelago, representing the southeast termination of the Greater Antilles arc. This island-arc extended to the Aves swell sensu stricto, which was probably offset by a transform fault. The new evidence of an Early Cretaceous age for the La Desirade cherts interbedded in an island-arc complex supports the above hypothesis (Bouysse et al.,1983).
1.3
References
Acton, G. D., Galbrun, B., and King, J. W. (2000). 9. Paleolatitude of the Caribbean plate since the Late Cretaceous. Atlantic, 25:25.
Amato, J. M., Lawton, T. F., Mauel, D. J., Leggett, W. J., González-León, C. M., Farmer, G. L., and Wooden, J. L. (2009). Testing the Mojave-Sonora megashear hypothesis: Evidence from Paleoproterozoic igneous rocks and deformed Mesozoic strata in Sonora, Mexico. Geology, 37(1):75–78.
Anderson, T. H., Silver, L. T., Nourse, J., McKee, J., and Steiner, M. (2005). The Mojave-Sonora megashear-Field and analytical studies leading to the conception and evolution of the hypothesis. SPECIAL PAPERS-GEOLOGICAL SOCIETY OF AMERICA, 393:1. Audemard, F. A. (2009). Key issues on the post-Mesozoic southern Caribbean plate
boundary. Geological Society, London, Special Publications, 328(1):569–586.
Baquero, M., Grande, S., Urbani, F., Cordani, U., Hall, C., and Armstrong, R. (2015). New Evidence for Putumayo Crust in the Basement of the Falcon Basin and Guajira Peninsula, Northwestern Venezuela. In AAPG Special Volumes.
Benford, B. (2012). Faulting and strain partitioning in Jamaica from GPS and structural data: Implications for Gonave and Hispaniola microplate kinematics, northern Caribbean. PhD thesis, The University of Wisconsin-Madison.
Boschman, L. M., van Hinsbergen, D. J., Torsvik, T. H., Spakman, W., and Pindell, J. L. (2014). Kinematic reconstruction of the Caribbean region since the Early Jurassic.
Earth-Science Reviews, 138:102–136.
Bouysse, P. (1984). The Lesser Antilles island-arc-structure and geodynamic evolution.