HAL Id: tel-01258800
https://hal.archives-ouvertes.fr/tel-01258800v2
Submitted on 3 Mar 2016HAL is a multi-disciplinary open access archive for the deposit and dissemination of sci-entific research documents, whether they are pub-lished or not. The documents may come from teaching and research institutions in France or abroad, or from public or private research centers.
L’archive ouverte pluridisciplinaire HAL, est destinée au dépôt et à la diffusion de documents scientifiques de niveau recherche, publiés ou non, émanant des établissements d’enseignement et de recherche français ou étrangers, des laboratoires publics ou privés.
Distributed under a Creative Commons Attribution - NonCommercial - NoDerivatives| 4.0 International License
diagnostics, image processing
Harsh Purwar
To cite this version:
Harsh Purwar. Ultrafast imaging of fuel sprays: development of optical diagnostics, image processing. Physics [physics]. Université de Rouen, France, 2015. English. �tel-01258800v2�
TH `ESE
Pour obtenir le grade de Docteur
op´er´e par l’Universit´e de Rouen
Discipline : Physique Sp´ecialit´e : ´Energ´etique
Ultrafast imaging of fuel sprays:
development of optical diagnostics, image processing
Pr´esent´ee et soutenue publiquement par
Harsh PURWAR
Th`ese soutenue publiquement le 16 dec. 2015 devant le jury compos´e de
M. Ra´ul PAYRI Professeur, Universitat Polit`ecnica de Val`encia Rapporteur
M. Bruno LAVOREL Directeur de recherche, CNRS, Universit´e de Bourgogne Rapporteur M. David SEDARSKY Assistant Professor, Chalmers University of Technology Examinateur
M. Lo¨ıc M ´EES` Charg´e de recherche, CNRS, ´Ecole Centrale de Lyon Examinateur
M. Christophe DUMOUCHEL Directeur de recherche, CNRS, Universit´e de Rouen Examinateur
M. Jean-Bernard BLAISOT Maˆıtre de conf´erences, Universit´e de Rouen Examinateur M. Claude ROZE´ Professeur, Universit´e de Rouen Directeur de th`ese
Dedicated to my beloved parents
for their unconditional love, constant support, encouragement and for all the sacrifices they have made for me.
Acknowledgments
I am very happy to have got this opportunity to thank all those known and unknown with whose guidance, help, participation and support, this work has come to its final shape.
First and foremost, I express my utmost gratitude to the director of laboratory CORIA, Prof. Abdelkrim Mourad Boukhalfa, not only for giving me the opportunity to work here but also for creating an irreproducible ambience in the laboratory. So far, whichever labs I have visited or worked in, I always found this lab to be the best one. At the same time, I am equally thankful to the secretary of laboratory, Val´erie Thieury, for helping me get through most of the formalities; other administrative staff members of CORIA – Nathalie Delahaye, Thierry Bessac, Florence Fradet and Aur´elie Pailhes, who took appropriate care of the tedious paperwork, whenever needed; members of the IT department, especially C´edric Chambrelan, Guillaume Edouard and Hugues Aroux, who were always available to sort out any computer-related issues; members of the workshop of CORIA – especially Benjamin Quevreux, Thierry Muller, Jacky Galle and Bruno Mille, for their timely help in installations of new instruments in the lab and for building various kinds of optical mounts which were required for experiments included in this work; members of the m´etrologie and instrumentation group – especially Gilles Godard and Philippe Pruvot, who made sure that all the instruments in the lab function properly at all times. I express my heartfelt gratitude to our librarian, Nathalie Fouet, for helping me get access to various journal articles and books. It was this magnificent administration and keen cooperation among the members that led to well timed and thorough completion of my work.
I am extremely thankful to the jury members who devoted their precious time to my thesis and came all the way to Rouen for my PhD defense. I am highly obliged to Prof. Ra´ul Payri of Universitat Polit`ecnica de Val`encia, Spain and Prof. Bruno Lavorel of the Universit´e de Bourgogne, France, for an in-depth review of my thesis and their insightful comments about my work. I am full of gratitude and heartily thank Prof. Christophe Dumouchel & Dr. Jean-Bernard Blaisot of the Universit´e de Rouen, France, Dr. Lo¨ıc M´e`es of the ´Ecole Centrale de Lyon, France and Dr. David Sedarsky of the Chalmers University of Technology, Sweden, for examining my work and their thoughtful suggestions for its further improvement.
I am overwhelmed with reverence and do not find words to pay my esteemed respect and deep gratitude to my supervisor Prof. Claude Roz´e, without whose affectionate guidance and utmost help, I would have not even survived in France, let alone my research. His deep knowledge, sustained interest, meticulous observations, and timely advice were the motivating force that guided me throughout this work. The constant encouragement and subtle criticism offered by him was the source of strength which enabled me to tread forward over the obstacles both in the course of the work and in my life and I am highly indebted to him. It has been a great pleasure working with you Sir and I hope that I will have your support and guidance in future as well.
I am extremely grateful to my esteemed colleague, Dr. Sa¨ıd Idlahcen, whose experience, understanding and personal guidance has provided a very strong basis for this work. I really admire his sharp observations and
valuable criticism, something that motivates my pace and passion to work harder.
It is with deep sense of gratitude and respect that I express my thanks to Dr. Jean-Bernard Blaisot, Dr. David Sedarsky, Dr. Lo¨ıc M´e`es, Dr. Nirmalya Ghosh, Dr. Ammar Hideur, Dr. Thomas Godin, Prof. Kuan Fang Ren and Dr. Thibault M´enard for all the support, help, motivation and fruitful discussions from time to time during our work together.
I am also indebted to all my colleagues and friends from CORIA – Kamel, Bastien, Hongjie, Huanhuan, Antonio, Th`anh, Hassan, Arezki, Mincheng, Maria, Justin and Yingchun, for all the help and motivation that you guys have been in my life for the past three years. I am extremely thankful to my seniors and friends – Arnab Da, Kasar, Tapan Da, Pradip, Suresh, Megha and Raj, who helped me settle when I was new in Rouen and familiarize me with various French traditions and customs.
I am equally grateful to my dearest friends – Satish, Jalpa, Subhasri, Jyothi, Sumi, Debanjan, Deodatta, Mohit, Vineet, Irfan, Jigyasa and Mukesh, who have been so supportive, encouraging and cheerful throughout my PhD.
The role of my family is too big to be acknowledged in so less words. My vocabulary fails me in describing what they mean to me. I dedicate my work and all that I have achieved so far in life to my parents and my adorable younger sisters, Naincy and Priyanshi, who have always been besides me in lows and highs of my life and have had the biggest contribution in shaping my life into what it is today. Without their blessings, support, encouragement and sacrifices this work would not have been possible.
Last but not the least, I express my gratitude to the director, Prof. Didier Blavette and secretary, Laure Paris of the ´Ecole Doctorale SPMII, for their incessant efforts in improving the life of PhD students of the University working in various labs spread across the state.
Summary
Due to an increasing demand of automobiles, a lot research is being carried out in improving the performance of the fuel engines, thereby decreasing the emitted pollutants in the atmosphere. Fuel atomization plays a very crucial role in determining the overall efficiency of diesel internal combustion engines. If the liquid fuel breaks up into fine droplets, it evaporates and mixes properly with air, thereby leading to its complete and proficient combustion.
This work focuses on developing fast optical diagnostic tools for the study of the liquid fuel atomization with an aim to characterize the fuel sprays in the near field of the injector nozzle. Optically targeting the near nozzle region is a big challenge due to the fact that the speed of the fuel spray is very high in this region (several hundreds of m/s) and the high liquid concentration in two-phase flow makes it optically impenetrable.
At first, classical imaging techniques using continuous illumination with a high-speed camera and an ultra-short pulsed illumination with a high-resolution CCD camera are reviewed. Their drawbacks, applicability in the near-nozzle region and the kind of spray analysis possible with the obtained images are discussed. The possibility of supercontinuum (SC) derived illumination generated by focusing the high power laser pulses in water is investigated. It was observed that the spray images obtained with such an illumination were almost free from laser speckle, which tremendously improved the clarity of these images. Later, reasons for the same were investigated and it was found that during SC generation the coherence of the laser beam was almost destroyed leading to almost no laser-induced artifacts in the spray images. An application of the classical imaging technique to a preliminary study of cavitation inside a transparent injector is presented.
The behavior of the fuel spray in the near nozzle region is very unpredictable due to the presence of a lot of instabilities, which finally leads to its atomization. Therefore, in order to characterize them in this region, one must look at the statistical behavior of the spray for any given set of injection parameters. A few image-based analysis tools for the characterization of the high-pressure fuel sprays used in this thesis include measurement of penetration length and speed at the beginning of fuel injection, statistical mapping of off-boundary displacements, evolution of spray cone angles with the needle lift and statistical mapping of spray velocities estimated by correlating spray image-pairs.
In the next part of the thesis optical techniques to reduce the noise originating due to the multiple scattering of light from its interaction with the fuel spray are studied. The method here consisted in removing delayed light, mainly due to multiple scattering, and keeping ballistic light for imaging. Optical Kerr effect based time gate in its primitive crossed-beam configuration is reviewed and a novel approach with collinear overlap of the pump and probe beams for time-resolved imaging of fuel spray with time resolution on the order of a picosecond is proposed and ballistic images of fuel spray in the near-nozzle region with high spatial resolution are obtained.
The change in the optical polarization properties of the Kerr medium on introduction of the pump pulse vii
are completely characterized by measuring all 16 elements of the Mueller matrix (MM). After determination of the MM for the Kerr medium, polarization parameters – depolarization, diattenuation, and retardance are quantified by decomposing it using polar decomposition formalism.
And finally, the possibility of using SC-derived illumination with the optical time-gate configuration is dis-cussed. The preliminary time-gated spray images obtained by using SC-derived probe beam for spray illumi-nation in the optical-gate setup show that speckle is substantially reduced maintaining a similar time resolution ∼1 ps.
Keywords – Atomization, spray, high-pressure diesel injection, high-speed imaging, femtosecond laser, non-linear optics, ballistic imaging, Mueller matrix imaging.
List of Publications
Harsh Purwar, Sa¨ıd Idlahcen, Claude Roz´e, and Jean-Bernard Blaisot, “Diesel spray velocity measurement using incoherent double-pulsed illumination,”Diesel Sprays and Biodiesel Combustion Workshop, London, UK (2013).
Harsh Purwar, S. Idlahcen, C. Roz´e, David Sedarsky, and J.-B. Blaisot,“Dual-colour OKE-based time-gate for imaging of high-pressure diesel sprays,”Diesel Sprays and Biodiesel Combustion Workshop, London, UK (2013).
S. Idlahcen,Harsh Purwar, C. Roz´e, D. Sedarsky and J.-B. Blaisot,“Two-color collinear Kerr-effect time-gate for ballistic imaging of high pressure sprays,”Gordon Research Conferences – Laser Diagnostics in Combus-tion, New Hampshire, US (2013).
Harsh Purwar, S. Idlahcen, C. Roz´e, and J.-B. Blaisot,“Ballistic imaging of high-pressure fuel sprays using incoherent, ultra-short pulsed illumination with an ultrafast OKE-based time gating,”17th International Sym-posium on Applications of Laser Techniques to Fluid Mechanics, Lisbon, Portugal (2014).
Harsh Purwar, S. Idlahcen, C. Roz´e, D. Sedarsky, and J.-B. Blaisot,“Collinear, two-color optical Kerr effect shutter for ultrafast time-resolved imaging,”Optics Express 22(13), 15778-15790 (2014). Selected for further impact by Virtual Journal for Biomedical Optics 9(8) (2014).
Harsh Purwar, S. Idlahcen, C. Roz´e, and J.-B. Blaisot,“Collinear two colour Kerr effect based time-gate for ballistic imaging,” 10th International Conference Series on Laser-light and Interactions with Particles, Mar-seille, France (2014).
Harsh Purwar, Kamel Lounnaci, S. Idlahcen, C. Roz´e, J.-B. Blaisot, and Thibault M´enard,“Quantitative com-parison of fuel spray images obtained using ultrafast coherent and incoherent double-pulsed illumination,”26th Annual Conference on Liquid Atomization and Spray Systems (ILASS-Europe), Bremen, Germany (2014). Harsh Purwar, K. Lounnaci, S. Idlahcen, C. Roz´e, J.-B. Blaisot, Lo¨ıc M´e`es, and Marc Michard, “Effect of cavitation on velocity in the near-field of a diesel nozzle,”13thInternational Conference on Liquid Atomization and Spray Systems (ICLASS), Tainan, Taiwan (2015).
Harsh Purwar, Hongjie Wang, Mincheng Tang, S. Idlahcen, Ammar Hideur, C. Roz´e, J.-B. Blaisot, and Thomas Godin,“Development of picosecond fiber laser for high repetition diesel spray imaging,”13th Interna-tional Conference on Liquid Atomization and Spray Systems, Tainan, Taiwan (2015).
Harsh Purwar, H. Wang, M. Tang, S. Idlahcen, A. Hideur, C. Roz´e, J.-B. Blaisot, and T. Godin, “Ultra-fast high-repetition imaging of fuel sprays using picosecond fiber laser,”Optics Express 23(26), 33396-33407 (2015).
Harsh Purwar, S. Idlahcen, C. Roz´e, and J.-B. Blaisot, “Time-resolved imaging with OKE-based time-gate: enhancement in spatial resolution using low-coherence ultra-short illumination,” manuscript under preparation for Optics Express.
Related work
Jalpa Soni, Harsh Purwar, Harshit Lakhotia, Shubham Chandel, Chitram Banerjee, Uday Kumar, and Nir-malya Ghosh, “Quantitative fluorescence and elastic scattering tissue polarimetry using an Eigenvalue cali-brated spectroscopic Mueller matrix system,”Optics Express 21(13), 15475-15489 (2013).
Paromita Banerjee, J. Soni,Harsh Purwar, N. Ghosh, and Tapas K. Sengupta,“Probing the fractal pattern and organization of Bacillus thuringiensis bacteria colonies growing under different conditions using quantitative spectral light scattering polarimetry,”Journal of Biomedical Optics 18(3), 035003 (2013).
Contents
Summary vii
List of Publications ix
List of Figures xiii
List of Tables xix
List of Symbols & Abbreviations xxi
1 Introduction 1
1.1 High-pressure fuel injection system . . . 7
1.1.1 Fuel injectors . . . 8
1.1.2 Needle lift and coil current measurements . . . 9
1.2 Organization of the manuscript . . . 11
2 Classical imaging techniques 13 2.1 Imaging with continuous illumination . . . 16
2.1.1 Off-boundary displacement measurement . . . 20
2.1.2 Estimation of spray velocity . . . 27
2.2 Imaging with ultra-short pulsed illumination . . . 32
2.2.1 Correlation based velocity computation . . . 33
2.2.2 High-repetition spray imaging . . . 34
2.3 Imaging with supercontinuum-based illumination . . . 42
2.3.1 Spectral and coherence measurements . . . 45
2.3.2 Comparison of velocity maps . . . 46
2.4 Conclusions . . . 48
3 Impact of cavitation on sprays 51 3.1 Transparent nozzle design . . . 52
3.2 Experimental design . . . 53
3.2.1 Needle lift measurement . . . 53
3.2.2 Cavitation measurements . . . 53
3.2.3 Fuel spray imaging . . . 54 xi
3.3 Results and discussions . . . 57
3.3.1 Needle lift and laser timings . . . 57
3.3.2 Development of cavitation with needle lift . . . 57
3.3.3 Spray cone angle estimation . . . 60
3.3.4 Spray velocity and cavitation . . . 62
3.4 Conclusions . . . 66
4 OKE-based time gating 67 4.1 Kerr effect . . . 68
4.2 Working principle of an OKE gating . . . 70
4.3 Crossed-beam configuration . . . 71
4.3.1 Crossed-beam, single color configuration . . . 71
4.3.2 Crossed-beam, frequency-doubled configuration . . . 73
4.4 Collinear, frequency-doubled configuration . . . 76
4.4.1 Optical setup . . . 76
4.4.2 Spatial and temporal resolutions . . . 78
4.4.3 Testing OKG and application on sprays . . . 80
4.5 Collinear configuration with SC-derived probe . . . 84
4.5.1 Optical setup . . . 84
4.5.2 Spatial and temporal resolution . . . 84
4.5.3 Application to fuel sprays . . . 89
4.6 Influence of the Kerr medium . . . 89
4.7 Conclusions . . . 91
5 Polarization properties of Kerr medium 95 5.1 Theory. . . 96
5.1.1 Mueller matrix measurement strategy . . . 96
5.1.2 Decomposition of measured Mueller matrices . . . 97
5.2 Single color, crossed-beam configuration. . . 98
5.2.1 Experimental setup . . . 98
5.2.2 Results . . . 100
5.3 Dual wavelength, collinear configuration . . . 104
5.3.1 Experimental setup . . . 105
5.3.2 Results . . . 107
5.4 Conclusions . . . 108
6 Conclusions and future aspects 111
List of Figures
1.1 Color-coded map showing progression of changing surface temperatures from 1884 to 2014. . 1
1.2 Global averaged atmospheric concentrations of the greenhouse gases determined from ice core data and from direct atmospheric measurements.. . . 2
1.3 Annually and globally averaged sea level change relative to the average over the period 1986 to 2005 in the longest-running dataset. . . 2
1.4 Global anthropogenic CO2emissions from forestry and other land use as well as from burning of fossil fuel, cement production and flaring. . . 3
1.5 Concentration of carbon dioxide over the decades.. . . 3
1.6 Working principle of a four stroke diesel engine.. . . 5
1.7 Schematic of the high-pressure injection system control. . . 8
1.8 X-ray images of metallic Inj. A. . . 9
1.9 IPoD coil current and injector needle lift measurements for Inj. A at 500 bar of injection pressure. 10 1.10 IPoD coil current and injector needle lift measurements for the transparent Inj. B at 300 bar of injection pressure. . . 10
2.1 Schematic showing various processes involved in combustion of a liquid fuel. . . 13
2.2 Direct numerical simulation results for a liquid jet in the near nozzle region. . . 14
2.3 Schematic of the optical setup for recording high-speed videos of fuel sprays. . . 16
2.4 Images of fuel spray issued using Inj B. inside a chamber maintained at ATP with an injection pressure of 300 bar. . . 17
2.5 Evolution of penetration length and speed with time for the fuel spray ejected in a chamber maintained at ATP with an injection pressure of 300 bar. . . 18
2.6 Mushroom-like structure visible in the high-resolution diesel spray image at the SOI and pene-tration length versus time after injection trigger for the fuel spray issued at an injection pressure of 400 bar. . . 19
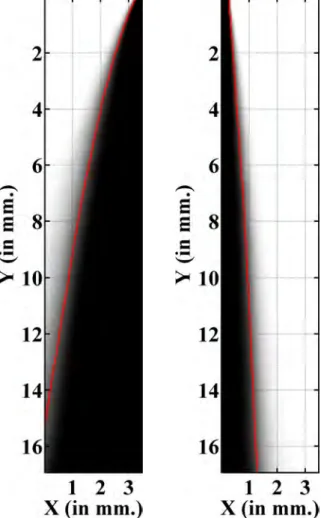
2.7 Average spray image at t = 1.0 ms after the SOI with fitted straight lines at the spray boundaries and evolution of spray half-cone angles with time. . . 20
2.8 Time-average fuel spray images for left and right sides with average spray boundary for a particular injection event. . . 21
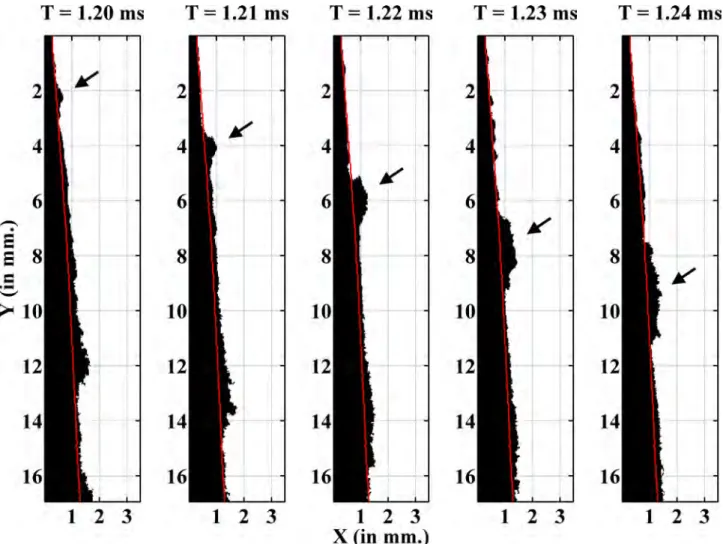
2.9 Occurrence of big liquid structures along the boundary of the spray, their movement and spread-ing in time. . . 22
2.10 Ambiguous off-boundary structures. . . 23 xiii
2.11 Off-boundary displacement plots.. . . 24 2.12 Magnified view of the off-boundary displacement plots to emphasize on the difference in the
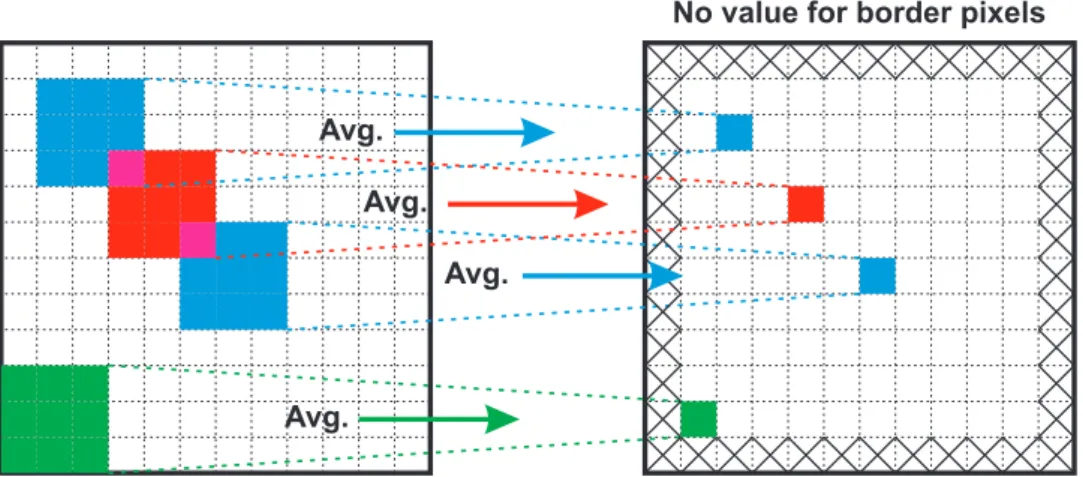
slopes associated with spreading of the structure. . . 25 2.13 Fourier transform of the off-boundary displacement plots. . . 26 2.14 Displacement vectors computed by correlating the two spray images obtained within a short
period of time.. . . 28 2.15 Schematic to emphasis on the moving average procedure used to generate velocity maps. . . . 28 2.16 Average velocity maps for left side of the spray computed using consecutive spray images
captured with the high-speed camera. . . 29 2.17 Average velocity maps for right side of the spray computed using consecutive spray images
captured with the high-speed camera. . . 30 2.18 Images of fuel spray injected using Inj. A in a chamber maintained at ATP with an injection
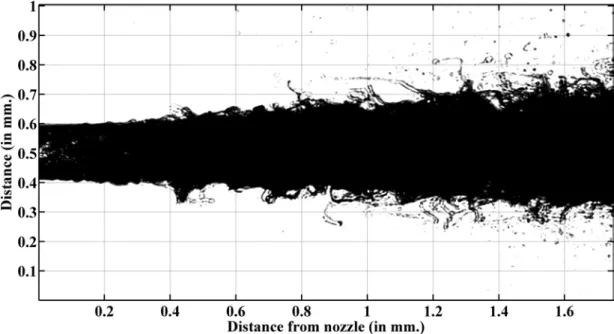
pressure of 800 bar. . . 31 2.19 Pulse duration required to freeze the motion of spray at the detector. . . 32 2.20 Trans-illuminated image of a fuel spray recorded using a sCMOS camera with an ultrafast
illumination.. . . 33 2.21 Displacement vectors computed by correlating the two spray images obtained within a very
short period of time.. . . 35 2.22 Experimental setup of the fiber master-oscillator power-amplifier (FMOPA). . . 36 2.23 Autocorrelation trace measured at the FMOPA output. Inset: Optical spectrum measured after
the amplifier. . . 37 2.24 Radio-frequency spectrum . . . 37 2.25 Schematic of the experimental setup for high-repetition imaging of high-pressure fuel sprays. . 38 2.26 Spray shadowgraphs obtained using continuous white light and ps fiber laser illuminations. . . 39 2.27 (Top) Image of USAF 1951 chart with (left) continuous white-light and (right) ps fiber laser
il-luminations. Optical magnification: 1.1. (Bottom) Contrast function, C = (Imax−Imin)/(Imax+
Imin)with respect to spatial resolution in line pairs/mm. measured for all elements of groups 2,
3 and 4 of the USAF chart. . . 40 2.28 Spray edge length estimated from the spray images recorded at different times from the SOI for
continuous white light and ps fiber laser illuminations. . . 41 2.29 Trans-illumination spray images obtained using ps fiber laser illumination (a to t) at a repetition
rate of 80.5 kHz (time between consecutive frames ∆t = 12.41 µs). Optical magnification: 0.63. 43 2.30 Schematic of the experimental setups for trans-illuminated spray imaging with direct laser and
SC-derived illuminations. . . 44 2.31 A magnified section of the fuel spray images obtained using direct laser and SC-derived
illumi-nations for qualitative comparison. . . 45 2.32 Supercontinuum spectrum and the selected wavelength range used for illumination of the object
under study with the optical gate configuration. . . 46 2.33 Schematic of the Michelson interferometer setup for measuring temporal coherence, obtained
List of Figures xv 2.34 Schematic of the Young’s double-slit experimental setup for measuring spatial coherence and
obtained interference patterns for fs laser and SC-derived illuminations. . . 48 2.35 Average spray velocity maps estimated using images obtained with fs laser and SC-derived
illuminations. The left side maps are computed from the core jet, while the right side maps are computed only considering the droplet cloud. . . 49 3.1 Schematic of the transparent nozzle made of PMMA. . . 53 3.2 Schematic of the experimental setup for recording back-lit images of the internal flow. . . 54 3.3 Schematic of the optical setup used to obtain high-resolution trans-illuminated spray images
for the two orthogonal viewing angles. . . 55 3.4 Examples of recorded cavitation and spray images for front and side views. . . 56 3.5 Example of a spray image recorded by a sCMOS camera when 87% of the injector’s needle is
lifted and the corresponding displacement vectors traced using cross-correlation based approach. 57 3.6 Injector needle lift signal and corresponding timings of the laser pulses used for cavitation and
spray imaging.. . . 58 3.7 Average cavitation images for different injector needle lifts at 300 bar of injection pressure. . . 59 3.8 Cavitation intensity for different times after the SOI with colored markers indicating the times
at which cavitation and spray images were recorded. . . 60 3.9 Normalized spray images for a particular injection and average normalized spray image all
recorded at t = 1.45 ms after the SOI each fitted with straight lines along the spray boundaries to demonstrate the sensitivity towards binarization threshold values. . . 61 3.10 Average behavior of half-cone angles, averaged over 200 spray images obtained at t = 1.45 ms
after SOI. . . 62 3.11 Left and right spray cone angles for different laser timings after SOI (correspond to different
injector needle lifts and cavitation intensity) for the two orthogonal views. . . 63 3.12 Spray velocity maps at different times after the SOI computed using the spray images recorded
by Cam 1. . . 64 3.13 Spray velocity maps at different times after the SOI computed using the spray images recorded
by Cam 2. . . 65 3.14 Velocity line profiles for different laser timings after SOI (correspond to different injector
nee-dle lifts and cavitation intensity) for the two orthogonal views. . . 65 4.1 Schematic showing ballistic, refracted and scattered photons upon interaction with a dense fuel
spray. . . 67 4.2 Working principle of an OKE-based time-gate. . . 70 4.3 Schematic of the experimental setup for crossed-beam, single color configuration of the
OKE-based time-gate. . . 72 4.4 Example of time-resolved images obtained through crossed-beam, single color configuration of
the optical time-gate. . . 73 4.5 Schematic of the experimental setup for crossed-beam, frequency-doubled configuration of the
OKE-based time-gate.. . . 74 4.6 Schematic showing overlap of pump and probe pulses inside the Kerr medium. . . 75
4.7 Averaged line profiles for the time-gated images showing the spatial shift for various delays between the pump and probe pulses. . . 75 4.8 Dependence of temporal resolution on the angle α between the pump and probe beams. . . 76 4.9 Schematic of the frequency doubled configuration for the OKE-based time-gate with collinear
overlap of the pump and probe pulses inside the Kerr medium. . . 77 4.10 Averaged line profiles for the time-gated images obtained with this collinear frequency-doubled
configuration of the optical gate for various delays between the pump and probe pulses. . . 78 4.11 The opening and closing profiles for the optical gate in collinear configuration with 1.0 mm,
2.0 mm and 10 mm liquid CS2as the Kerr medium. . . 78
4.12 Schematic showing overlap of pump and probe pulse inside the Kerr medium for single and dual color configurations of the optical time-gate. . . 79 4.13 Image of a slanted glass fiber obtained using collinear time-gate configuration with 1.0 mm
thick CS2cell and the corresponding averaged ESF for the indicated edge in the image. . . 80
4.14 Normalized MTF as a function of spatial frequency calculated using the fitted ESFs for the collinear and crossed-beam configurations of the optical gate.. . . 81 4.15 Schematic of the cross section of a 342 µm large mode area fiber. Ballistic and refraction
images of the same micro-structured optical fiber obtained using 1.0 mm CS2optical gate. . . 81
4.16 Ballistic and refraction images of fuel spray close to the nozzle separated using 1.0 mm CS2
optical time-gate. . . 83 4.17 Schematic to show the ballistic and the refracted light signals through a 185 µm thick medium
with the refractive index of 1.46 (black, solid line curve). The blue, solid and dashed curves shows the transmission through the 1.0 mm CS2optical time-gate (gate duration ∼ 1.0 ps) for
two different delays between the pulses, separating ballistic and refraction light signals. . . 84 4.18 Schematic of the modified collinear configuration for the OKE-based time-gate with SC derived
probe. . . 85 4.19 Image of a slanted glass fiber obtained using SC-derived illumination with collinear optical
time-gate configuration and the corresponding averaged ESF extracted from the indicated edge in the image and fitted ESF. . . 86 4.20 Normalized MTF as a function of spatial frequency calculated using the fitted ESFs for the
collinear configuration of the optical gate with SC-derived and FD probe beams for illumination. 86 4.21 Temporal profile of the OKE-based time gate for SC-derived probe pulse and for
frequency-doubled probe. . . 87 4.22 Schematic of the optical setup used to measure the chirp characteristics of the generated
super-continuum. . . 88 4.23 Dependence of gate duration on the chosen wavelength band in SC-derived optical time-gate. . 88 4.24 Ballistic images of fuel spray with frequency-doubled, coherent and SC-derived, low-coherence
illumination sources with the collinear OKE-based time-gate. . . 90 4.25 Comparison of response and relaxation times for liquid CS2 and solid BK-7 glass for the
collinear, frequency-doubled configuration of the optical gate. . . 91 4.26 Ballistic and refracted light through an optical fiber separated using 2.0 mm glass optical
List of Figures xvii 4.27 Comparison of response and relaxation times for liquid CS2 and solid GGG crystal obtained
for the collinear, frequency-doubled configuration of the optical gate.. . . 92 5.1 Schematic of the experimental setup for measuring Mueller matrix of carbon disulfide in single
color, crossed-beam configuration. . . 99 5.2 Mueller matrix (MCS2)for the CS2cell (cell thickness = 10 mm) in single color, crossed-beam
configuration calculated for a particular delay between the probe and the pump pulse from sixteen intensity measurements using rotating retarder technique. . . 101 5.3 Polar decomposition derived linear retardance (δ ) for CS2 cell (cell thickness = 10 mm) for
various delays between the probe and the pump pulse in single color, crossed-beam configuration.102 5.4 Polar decomposition derived linear retardance (δ ) for CS2 cell (cell thickness = 10 mm) for
different average pump power and a fixed time-delay between the probe and the pump pulses in single color, crossed-beam configuration. . . 103 5.5 Polar decomposition derived diattenuation (d) for CS2cell (cell thickness = 10 mm) for
dif-ferent average pump power and a fixed time-delay between the probe and the pump pulses in single color, crossed-beam configuration. . . 104 5.6 Polar decomposition derived depolarization (∆) for CS2cell (cell thickness = 10 mm) for
dif-ferent average pump power and a fixed time-delay between the probe and the pump pulses in single color, crossed-beam configuration. . . 105 5.7 Schematic of the experimental setup for double wavelength, collinear configuration. . . 106 5.8 Polar decomposition derived linear retardance for CS2cell (cell thickness = 10 mm) exhibiting
optical Kerr effect for various delays between the probe and the pump pulse in dual wavelength, collinear configuration. . . 107 5.9 Polar decomposition derived linear retardance for CS2cell (cell thickness = 1 mm) exhibiting
optical Kerr effect for various delays between the probe and the pump pulse in dual wavelength, collinear configuration. . . 108
List of Tables
1.1 Details of the injectors used in this work.. . . 8 2.1 Physical properties of the diesel-like liquid used for recording spray images. . . 16 2.2 Specifications of the high-speed camera used for recording high-speed spray videos.. . . 18 3.1 Laser timings for cavitation measurements and recording spray images and the corresponding
injector needle lifts. . . 58 4.1 Prospective Kerr media, their chemical compositions and nonlinear refractive coefficients. . . 89 4.2 Summary indicating usability of various OKE-based time-gate configurations for time-resolved
imaging of multiphase flows. . . 94 6.1 Summary of classical imaging techniques in context of fuel spray imaging. . . 113 6.2 Summary of various optical configurations for time-resolved imaging of fuel sprays. . . 115
List of Symbols & Abbreviations
α angle between pump and probe beams
∆ depolarization - quantifying loss of polarization δ linear retardance (in radians)
λ wavelength of light (in nm.)
ν spatial frequency (in line pairs/mm.) ψ optical rotation (in radians)
ρL density of the concerned liquid
σ cavitation number, as defined by A. Sou et al., Eq. (3.1)
τ0 relaxation time for the birefringence effect in the concerned Kerr medium τr rise time of the concerned Kerr medium in response to an applied electric field θi orientation angles of the fast axis of quarter waveplate
A polarization state analyzer matrix a camera pixel size (in µm)
d diattenuation - quantifying polarization-dependent transmission
e exposure time of the camera or pulse width (pulse duration) of the laser source
L thickness of the medium
m optical magnification
MCS2 Mueller matrix of carbon disulfide
n2 second order refractive index Pi injection pressure
Pv vapor saturation pressure
Re Reynolds number
vg group velocity
VN mean velocity of the concerned liquid W polarization state generator matrix
ANR l’Agence Nationale de la Recherche - the French National Research Agency ATP atmospheric conditions of temperature and pressure
BBO β-barium borate crystal - used for second harmonic generation (type-I). Bi2O3 Bismuth oxide
CANNEx Cavitation and Atomization in Nozzles: Numerical and Experimental study - Name of the project funded by French National Research Agency (ANR).
CCD charge-coupled device CFCs chlorofluorocarbons
CH4 methane
CI compression ignition
CMOS complementary metaloxidesemiconductor
CO carbon monoxide
CO2 carbon dioxide
CORIA COmplexe de Recherche Interprofessionnel en A´erothermochimie - a laboratory located in Saint-Etienne-de-Rouvray, France.
CS2 carbon disulfide
dns direct numerical simulation ESF edge spread function
GGG gadolinium gallium garnet crystal (Gd3Ga5O12) H2O water or water vapors
HFCs hydrofluorocarbons
L/D ratio of the length of the nozzle to its orifice diameter
LMFA Laboratoire de M´ecanique des Fluides et d’Acoustique - a laboratory located in Lyon, France.
MM Mueller matrix
List of Symbols & Abbreviations xxiii N2O nitrous oxide
NOx oxides of nitrogen OKE optical Kerr effect
OKG optical Kerr effect-based time-gate
PFCs perfluorocarbons
PSA polarization state analyzer PSG polarization state generator
SC supercontinuum
SF6 sulfur hexafluoride
SI spark ignition
SOI start of fuel injection TeO2 Tellurium dioxide TiO2 Titanium dioxide
Chapter 1
Introduction
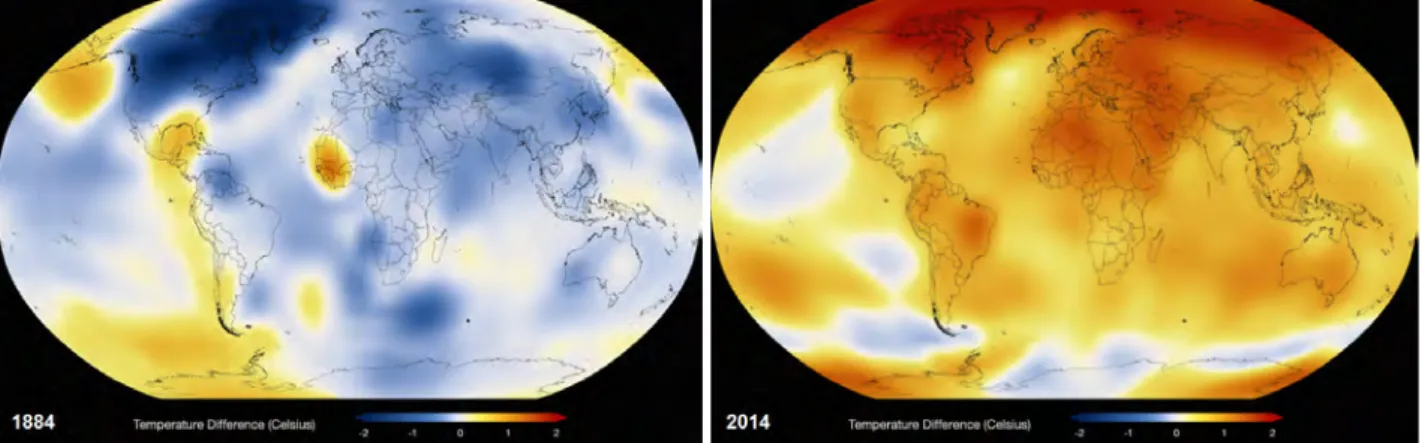
When this thesis will be defended, the 21st session of the Conference of the Parties (COP21) to the United Nations Framework Convention on Climate [1] and the 11thsession of the Meeting of the Parties (CMP11) to the 1997 Kyoto Protocol will be held in Paris (from 30th November to 11th December 2015), with an aim to establish a new international climate agreement between participating governments to limit carbon emission and keep global warming below 2◦ C. Figure 1.1 shows a global increase in the surface temperatures since 1884 [2].
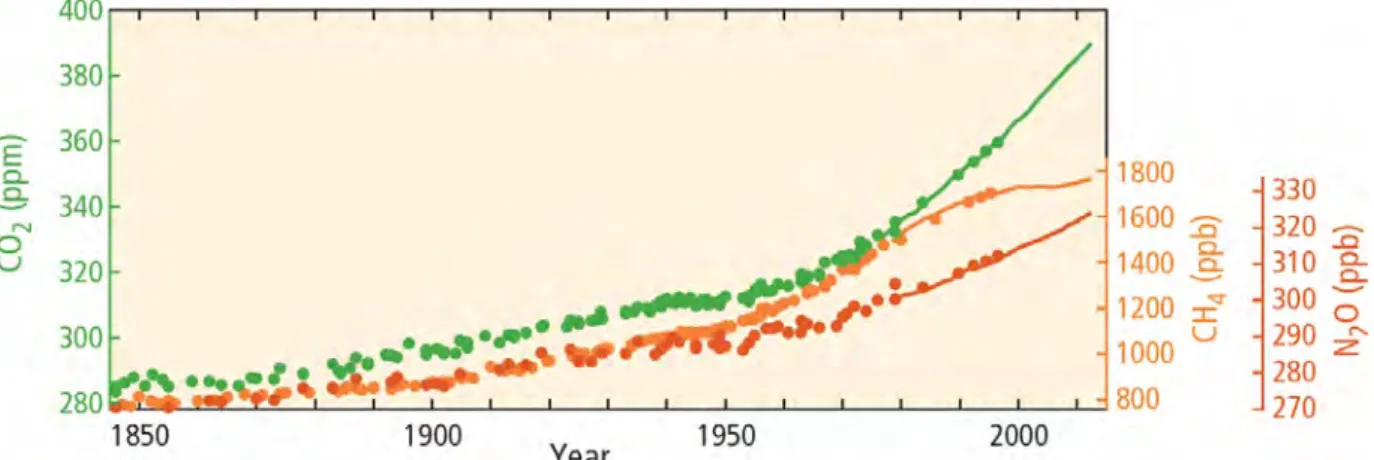
Figure 1.1: Color-coded map showing progression of changing surface temperatures from 1884 to 2014. Dark blue indicates areas cooler than average and dark red indicates areas warmer than average [2]. Global warming is mainly due to excessive greenhouse gas emission. Many chemical compounds present in Earth’s atmosphere behave as ‘greenhouse gases’. These are gases which allow direct sunlight (relative shortwave energy) to reach the Earth’s surface unimpeded. As the shortwave energy (that is the visible and ultraviolet portion of the spectra) heats the surface, longer-wave (infrared) energy (heat) is re-radiated to the atmosphere. Greenhouse gases absorb this energy, thereby allowing less heat to escape back to space, and ‘trapping’ it in the lower atmosphere. Many greenhouse gases occur naturally in the atmosphere, such as carbon dioxide (CO2), methane (CH4), water vapor (H2O), and nitrous oxide (N2O), while others are synthetic. Those that are man-made include the chlorofluorocarbons (CFCs), hydrofluorocarbons (HFCs) and perfluorocarbons (PFCs), as well as sulfur hexafluoride (SF6). Atmospheric concentrations of both the natural and man-made gases have been rising over the last few centuries due to the industrial revolution. Figure1.2shows the globally averaged concentrations of the naturally occurring greenhouse gases.
Figure 1.2: Global averaged atmospheric concentrations of the greenhouse gases – carbon dioxide (CO2, green), methane (CH4, orange) and nitrous oxide (N2O, red) determined from ice core data (dots) and
from direct atmospheric measurements (lines) [3].
Over the past century carbon emissions has increased at an alarming rate and is therefore being considered as the primary reason for the changing climate all over the globe. Evidences of the direct impact of global warming at large scales include – increasing global surface temperatures (see Fig.1.1), rising sea-level (see Fig.1.3) [4], increasing ocean acidity [5] and temperature [6], declining Arctic sea ice [7], and many other indirect impacts due to these changes in the climate, for instance, increase in the number of drastic events of drought, flood, insect outbreak, wildfire etc. [8] not only affect human lives but also several other species living on the planet.
Figure 1.3: Annually and globally averaged sea level change relative to the average over the period 1986 to 2005 in the longest-running dataset. Colors indicate different data sets. All datasets are aligned to have the same value in 1993, the first year of satellite altimetry data (red). Where assessed, uncertainties
are indicated by colored shading [3].
As the global population has increased and our reliance on fossil fuels (such as coal, oil and natural gas) has been firmly solidified, so emissions of these gases have risen. While gases such as carbon dioxide (CO2) occur naturally in the atmosphere, through our interference with the carbon cycle (through burning forest lands, or mining and burning coal), we artificially move carbon from solid storage to its gaseous state, thereby increasing
3 atmospheric concentrations. Figure1.4shows the global anthropogenic CO2emissions in gigatonne (or giga metric ton) per year from forestry and other land use as well as from burning of fossil fuel, cement production and flaring.
Figure 1.4: Global anthropogenic CO2 emissions from forestry and other land use as well as from burning of fossil fuel, cement production and flaring. Cumulative emissions of CO2 from these sources
and their uncertainties are shown as bars and whiskers, respectively, on the right hand side [3].
The fossil fuels (including, coal, oil and natural gas) have amazing physical properties which is why they are largely used in all modern human activities, directly or indirectly. A lot of efforts in reducing our dependency on the fossil fuel energy are being made in almost all major sectors, be it transport or electricity generation and hence the percentage of fossil fuels in the total primary energy supply has been reduced from 86.7% in 1973 to 81.7% in 2012 considering the whole world consumption. However in the same period, the total primary energy produced has also doubled, from 6106 millions of tonnes of oil equivalent (Mtoe) in 1973 to 13371 Mtoe in 2012 and so, the emission of carbon in the atmosphere continuously increases [9]. The amount of carbon dioxide present in the atmosphere today had never ever been so much in the past 650000 years. Figure 1.5 shows estimated concentrations of carbon dioxide in atmosphere 650000 years before present to 2014, based on the comparison of atmospheric samples contained in ice cores and more recent direct measurements, and provides a solid evidence that atmospheric CO2has increased since the industrial revolution [10,11].
Figure 1.5: Concentration of carbon dioxide (in parts per million) over the decades [12].
applications. Although, in the transportation sector, oil is more difficult to replace. It has large energy density and, because of its liquid state, it is really easy to transfer from one tank to another and transport. The percentage of oil being used for transportation in 2012 was 63.7% in the world and had been continuously increasing since 1973 [9]. Attempts to use other energies sources (like electricity, hydrogen) in transports are still marginal, and in any case, the question of the primary source used to produce electricity or hydrogen still remains. The problem cannot be considered as solved if the fossil fuels are used in the thermal plants to produce electricity instead of using them directly for transportation.
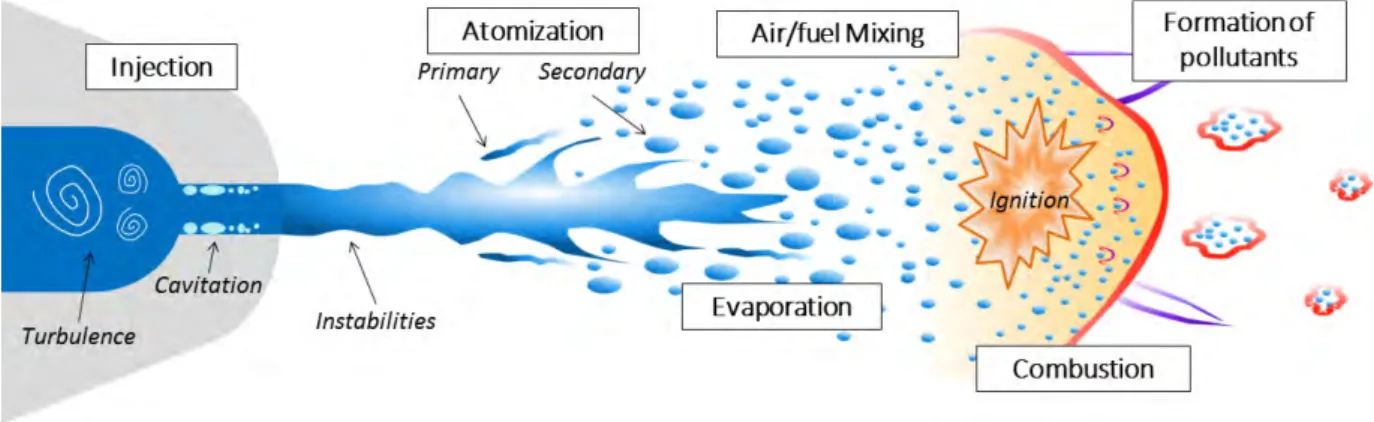
The most common way to convert the chemical energy stored in the fossil fuels into mechanical energy for transport is combustion, i.e. a chemical reaction in gas phase between air and fuel vapors. Transformation of liquid into gaseous state is evaporation, which is a surface phenomenon. Hence, an efficient evaporation demands an increase in the surface area of the liquid which is achieved by breaking the liquid up into small droplets. These fuel droplets then evaporate and must mix with air properly for complete and efficient fuel combustion. To summarize, the combustion process, in context of internal combustion engines, is schematically a sequence of the following processes:
• Injection: introduction of liquid fuel
• Atomization: transformation from continuous liquid phase to droplets • Evaporation: transformation of liquid droplets to gaseous phase. • Mixing of fuel vapor with air
• Ignition: depositing the required amount of energy • Flame propagation
• Extinction
All the processes can occur simultaneously, as in an aeronautical engine, or sequentially like in a car engine. This work focuses on car engines, which can broadly be classified into two main categories depending on the way fuel combustion is carried out: spark ignition (SI) engines, using gasoline or other light fuels (ethanol for example), in which ignition of the air-fuel mixture is initiated by a spark plug, delivering the required amount of energy to start combustion; (ii) compression ignition (CI) engines, using diesel or similar fuels, in which ignition is initiated by the temperature rise during a compression phase.
In Europe (EU-15), the share of new diesel car registrations in 2014 was 53.6% of the total number, with some countries having a much higher share of diesel-based cars, like Ireland 73.2%, Luxembourg 72%, Portugal 71.2%. In France the share of new diesel-based car registrations recorded last year was 63.9% [13]. The diesel combustion optimization is hence a crucial problem.
Schematically, diesel engine works as follows (see Fig.1.6):
Suction stroke: When the piston moves downwards, inlet valves open and fresh air from outside is sucked in. Compression stroke: During the return stroke, inlet and exhaust valves are closed and the air inside the cylinder gets compressed. In this stroke, the piston does work on the air and so the temperature and pressure of the air will rise to a level which is higher than the self ignition value of the diesel.
Injection stroke: An atomized form of fuel is injected into this compressed air. The fuel gets evaporated and undergoes an uncontrolled spontaneous explosion. As a result, the pressure and temperature inside the cylinder (combustion chamber) rise to very high values. The high energy fluid pushes the piston downwards. The hot air does work on the piston and energy in the fluid is converted to the mechanical energy of the piston.
5 open and the exhaust is rejected, usually in the atmosphere. Again the suction stroke happens and this cycle of four strokes is repeated over and over for continuous power generation.
Moreover, for smooth and stable power output diesel engines often use more than just one cylinder, where
Figure 1.6: Working principle of a four stroke diesel engine [14]. these four strokes occur simultaneously but in different cylinders at any particular time.
The problem in fuel combustion is not only the fuel consumption but also the emitted pollutants: NOx, CO and soot particles and of course the greenhouse gas CO2. Heavy metals present in the commercial fuels as impurities are also often disposed in the atmosphere during exhaust, which could be extremely harmful, if present in large quantities in the environment. Optimization of combustion also participates in reduction of pollutants emission.
As pointed out before, atomization is a crucial step in the combustion process. An ideal injection process would be to introduce the right amount of fuel at the right time in the combustion cycle, with size of the droplets, formed after atomization, small enough to quickly evaporate and mix with the air before spontaneous combustion occurs. In reality, the complete control of atomization has not yet been possible. Both numerical [15] and experimental [16] studies show that increasing the injection pressure leads to smaller and uniform sized droplets after atomization. So, the current trend followed by the automobile industries has been to increase the injection pressure (reaching upto 2000 bar) while decreasing the nozzle orifice diameter (on the order of a few hundreds of micrometers) in order to produce finer droplets for better mixing and efficient combustion.
The general context of this work is to contribute to a better understanding of the atomization process. The aim is the prediction of the atomization, i.e. localization of droplets in space over time with their physical characteristics, like, size distribution and velocity profiles. Nowadays, most of the high-confidence prediction models attempts in numerical simulation of the entire liquid jet. Although, complexity of the atomization process limits such high-fidelity simulations, be it direct numerical simulations (dns) [17,18] or large eddy simulations (les) [19] of the fuel sprays, to the near nozzle region [20], since a huge amount of computational resources are required to simulate the liquid jet in the far field of the nozzle and it hasn’t been possible so far. Moreover, in order to validate the prediction models based on such simulations, experimental data is required, which could be in the form of droplet size distribution, velocity profile in different regions of the atomizing spray or other parameters (may or may not be directly related to spray, but might be useful in simulations), like mass flow rate, nozzle’s internal geometry (usually obtained through x-ray imaging or through silicone
molds [21]), etc. The experimental data could as well be used to deduce physical or empirical laws between various parameters governing the behavior of liquid atomization, for example, relationships between the droplet size and nozzle orifice diameter. However, since the high-fidelity numerical simulation results are available only in the near nozzle region where most of the instabilities arise and lead to the primary atomization of the jet, we must have experimental data in this region so that the results can be compared and simulations can be validated. A few successful attempts have already been made by researchers to compare, for example, the velocity of the fuel spray estimated using the dns based on coupled level set and volume of fluid methods in the near nozzle region [22]. In the far-field of the nozzle, experimental data can be measured with ease and the same can be obtained by approximate prediction models as well, but is not representative of what governs combustion in real engines. The work in this thesis primarily concerns with developing new optical diagnostic tools or with improving upon the existing techniques so as to have novel insights in the near-nozzle region of fuel sprays.
A few challenges experimentalists have to face when probing the near nozzle region of the high-pressure fuel sprays using the non-invasive optical tools are summarized below.
Narrow field of view:
The height of the combustion cylinder for a typical 4-stroke diesel engine is about 10 − 13 cm. However, just before the start of fuel injection (SOI) compression stroke occurs and the effective height or space (lengthwise) available for fuel atomization is less than 2 cm. This means that the fuel must atomize within a few milimeters from the nozzle. Hence, in order to obtain high resolution spray images in this region the optical magnification must be large.
High velocity of the jet:
Again, in order to achieve atomization within a short range, the liquid fuel is ejected with a very high injection pressure inside the combustion chamber (or cylinder), of the order of 2000 bar for modern car engines. According to the Bernoulli’s equation for non-compressible fluids, the exit spray velocity (v0) when the liquid with density ρ = 825 kg/m3(close to the density of diesel fuels) is ejected through the orifice into a chamber at atmospheric pressure Patm=1 bar with an injection pressure of Pi =2000 bar would be,
v0=s 2∆P
ρ =
r 2 × 1999 × 105
825 =696 m/s. (1.1)
Due to the high velocity of the jet it is extremely difficult to capture it, even using latest high-speed cameras available in the market. Chapter2discusses about this aspect in more details.
High two-phase flow liquid fraction:
The nozzle orifice diameter for modern injectors used in diesel engines based cars is of the order of 100 µm and hence the ejected liquid is very concentrated both in the near and far field of the injector nozzle. As a result, it is very difficult to use optical techniques to extract morphological characteristics like, droplet size distribution, concentration, their shapes etc., which directly affect the evaporation rate and therefore combustion efficiency.
High optical density:
Due to the high liquid concentration in the near field of the nozzle, optical density is also very high. Furthermore, due to atomization there is a lot of scattering, making this region almost optically impen-etrable. Chapter4discusses this aspect in details. Time filtering has been used to reduce the noise due to multiple scattering and ballistic images of fuel sprays have been obtained using the optical Kerr effect
1.1. High-pressure fuel injection system 7 based time-gating.
Cavitation inside the nozzle:
Another issue with these high-pressure fuel injectors is the development of vapor cavities inside the injectors due to large pressure variations. From the Bernoulli’s principle we have,
v2 2 +gh +
P
ρ =K(constant) (1.2)
where, v and P are the velocity and pressure at any given point inside the fluid respectively, ρ is the fluid density and h is the elevation of this point from the ground and g is the acceleration due to the gravitational force of the Earth. Sudden changes in the velocity of the liquid (usually, volatile fuels) inside the injector leads to changes in the pressure. If the fluid velocity increases, the pressure drops and if the pressure drops below the vapor pressure of the fluid, the fluid would vaporize and form vapor cavities inside the nozzle. These cavities change the behavior of atomization in a way not yet understood very well. Chapter3 addresses this aspect by measuring the cavitation intensity and its impact on the spray characteristics by using a transparent nozzle.
1.1 High-pressure fuel injection system
The objective of this thesis is to test and improve existing optical techniques for diagnostics in the near-field of the nozzle and propose new optical diagnostics, with the aim to provide accurate information to experimental-ists. For testing purpose, these optical tools were applied to a realistic injection bench. The high-pressure fuel injection system used extensively in this thesis for controlling various fuel injection related parameters consists of the following main components:
• Common rail pressure accumulator to have more stable, accurate and safe control of fuel injection pres-sure.
• A supply pump driven by an electric motor. The fuel is sucked from the fuel tank and after passing through a filter, it is pressurized inside the common rail by the pump.
• A high pressure controller module (EFS 8549) allows high pressure regulation inside common rail. It is accompanied with pressure sensors, safety valves, battery power supply etc. for safe and precise control of the pressure inside the common rail.
• A diesel fuel injector for fuel injection. The fuel injection is controlled by using IPoD coil (EFS 8427). It is used to generate appropriate current signals required by the diesel fuel injectors.
• A closed (not sealed) spray chamber to avoid accidental combustion in case of a leak and also to avoid damage to other optical elements involved in the experiments, with 4 glass windows on four sides. Also, an exhaust fan for continuous suction of the toxic fumes or particulates formed during fuel injection is attached with the spray chamber.
The schematic in Fig1.7shows arrangement of the above components in order to have a working and a stable high-pressure fuel injection system.
Figure 1.7: Schematic of the high-pressure injection system control. 1.1.1 Fuel injectors
The work included in this thesis utilizes two different kinds of fuel injectors obtained within the framework of two projects: (i) New Advanced Diesel Injection Analysis for bio fuels (NADIA bio) funded by Haute Normandie region & French government (FUI) and (ii) Cavitation and Atomization in Nozzles: Numerical and Experimental study (CANNEx) funded by the French National Research Agency (ANR). The details of these fuel injectors are mentioned in Table1.1. Everywhere in this thesis these fuels injectors will be referred by their Tag names. X-ray images of the metallic Inj. A were obtained to have an understanding of the internal
Table 1.1: Details of the injectors used in this work. Injector Tag Name Inj. A Inj. B Injector type Hole-type Hole-type
No. of orifices One One
Orifice diameter (φ) 185 µm 350 µm
Transparent? No Yes
Material type Metallic Polymer (PMMA∗) Max. inj. pressure 2000 bar 500 bar ∗IUPAC Name: poly(methyl 2-methylpropenoate)
structure of the nozzle and are shown in Fig.1.8. It is clear from these images that there is no manufacturing defect or any significant asymmetry in the nozzle design for this injector.
1.1. High-pressure fuel injection system 9
Figure 1.8: X-ray images of metallic Inj. A.
For the transparent injector (Inj. B), all the dimensions were given to the manufacturer and so are well known. A schematic of the nozzle with some more details will follow in Chapter3.
1.1.2 Injector needle lift & IPoD coil current measurements
A non-contact, eddy current based displacement measurement system NLS3181 from Micro-epsilon with sen-sor LS04(04) for targets made of ferromagnetic electrically conductive materials was used for injection needle lift measurement. High-frequency alternating current flows through a coil cast in a sensor casing. The elec-tromagnetic coil field induces eddy currents in the conductive target (injector needle) thus changing the AC resistance of the coil. This change in the impedance is interrupted by demodulation electronics, which gener-ates an electrical signal proportional to the distance of the target from the sensor. This electrical signal can then be easily measured using an oscilloscope or any other similar equipment used for such data acquisitions.
The specific current requirements supplied by the manufacturers for the two injectors used in this work was fulfilled by using the IPoD coil (EFS 8427). By changing specific parameters of this device, desired current pulse was obtained. This current pulse was measured using a Hall-effect based current clamp E3N from Chauvin Arnoux. The results are shown below for the two injectors. Note that the output signal from the current clamp, shown below, is directly proportional in form and amplitude to the DC and AC components of the current measured.
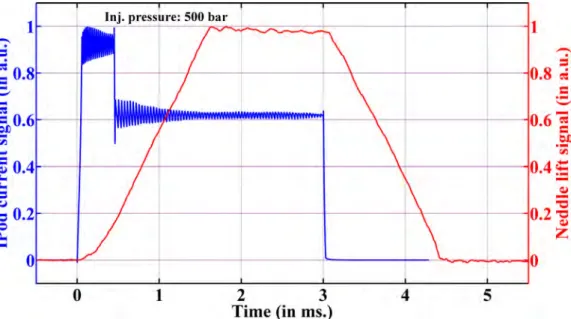
Inj. A: The IPoD coil current and injector needle lifts are shown below in Fig. 1.9 for the high-pressure metallic injector (Inj. A) at 500 bar of injection pressure. The injection duration for these measurements was set to 3.0 ms.
Inj. B: The IPoD coil current and injector needle lifts are shown in Fig. 1.10for the transparent injector (Inj. B) at 300 bar of injection pressure. The injection duration for these measurements and for all the other measurements included in this thesis, unless specified otherwise, is 2.5 ms. This injector will be used for cavitation studies in Chapter3.
Figure 1.9: IPoD coil current and injector needle lift measurements for Inj. A at 500 bar of injection pressure.
Figure 1.10: IPoD coil current and injector needle lift measurements for the transparent Inj. B at 300 bar of injection pressure.
1.2. Organization of the manuscript 11
1.2 Organization of the manuscript
This manuscript consists of six chapters including the current introduction. The aim of this work is to propose or improve optical diagnostic tools for spray studies and to test them, when possible, to real diesel sprays. A brief summary of each chapter is as follows:
Chapter1:
It is this introduction that was focused on highlighting the general context of this work, the motivation behind it and its importance. It describes our goals and objectives and discusses the problems that we must overcome to achieve them. Towards the end it gives a brief overview of the high pressure fuel injection system that was used for fuel injections into a chamber maintained at the atmospheric conditions of temperature and pressure (ATP).
Chapter2:
The aim of this chapter is to show that simple imaging techniques can be improved by using specific light sources for illumination. It starts with a brief review of the simple imaging techniques using either con-tinuous or pulsed illumination with a suitable camera. It demonstrates how one can extract certain simple but important information about the fuel sprays, like penetration and cone angles, using the relatively simple optical setups. All the results shown for the penetration length, speed and cone-angles, although not new, but were obtained using our own measurements. Next, we propose a method to investigate the occurrence of some big liquid structures near the spray boundaries. Average velocity maps were also ob-tained from the frames of the high-speed video by correlating two consecutive frames based on a concept proposed by D. Sedarsky et al. [23]. An improvement in the classical imaging techniques that utilize a high-speed camera for spray imaging has been proposed by using a new, low-cost, high-repetition, picosecond fiber laser source for illumination. It has been shown that the spray images recorded using pulsed fiber laser illumination were better in clarity than the images recorded using continuous white-light illumination. Towards the end, we propose using supercontinuum (SC) derived illumination for single shot (low-repetition) imaging instead of directly using pulsed (ps or fs) laser. The use of SC-derived light is shown to reduce laser speckle in the spray images due to the destruction of the strong coherence of the laser beam and henceforth improves upon the quality of the images.
Chapter3:
The aim of this chapter is to demonstrate the efficacy of classical imaging techniques discussed in the previous chapter by using them to investigate the impact of cavitation on the macroscopic properties of fuel sprays like, velocity and spray cone-angle in the near-nozzle region (a part of an ongoing project, CANNEx). The transparent nozzle (Inj. B) will be used to obtain images of the internal flow at various times after the SOI, corresponding to different injector needle lifts. The same injector will then be used to obtain high-resolution fuel spray images. The estimated spray half-cone angles and velocity maps from the spray images are then compared with the development of cavitation inside the nozzle as injector needle is lifted.
Chapter4:
After exploring the prospects of classical imaging techniques, in context of fuel sprays, using various kinds of illumination sources with compatible detectors (cameras), we move on to more sophisticated imaging techniques capable of reducing multiple scattering from atomizing spray droplets. This chapter
focuses on the need and development of time-gated imaging techniques for fuel sprays. A brief review of the existing crossed-beam configuration of the optical Kerr effect based time-gate is made at first, followed by a discussion on its applicability for time-resolved spray imaging. Next, we propose another configuration for the optical time-gate with collinear overlap of pump and probe beams, thereby solving most of the issues with the classical crossed-beam configuration. Collinear configuration improves the spatial resolution of the time-resolved images a lot, keeping almost the same temporal resolution, ∼ 1 ps. Ballistic and refraction spray images are obtained in the near-nozzle region using this new collinear con-figuration of the optical gate. Moreover, the possibility of using SC-derived light for spray illumination in the optical time-gate setup is also explored in order to reduce laser speckle from the time-resolved im-ages. Towards the end of this chapter, temporal characteristics of a few other Kerr media are studied and it was found that their relaxation times are far better than those of liquid state media like the commonly used carbon disulfide (CS2). However, the mediums that we were able to test showed a poor efficiency compared to that of liquid CS2. In future if we could obtain a more efficient solid state Kerr medium it would serve better in the optical gate configurations for time-resolved imaging.
Chapter5:
This chapter focuses on understanding the polarization properties of the Kerr medium (carbon disulfide). We adopt the Stokes-Mueller formalism for a complete polarization characterization of liquid CS2 in both crossed-beam and collinear configurations of the optical gate. Sixteen measurements are made to determine the 4 × 4 Mueller matrix (MM) of liquid CS2using the rotating retarder approach [24]. After determination of the MM, it is decomposed into three matrices, each of which independently quantify the three polarization parameters namely, retardation (related to the birefringence), diattenuation and depo-larization using a formalism proposed by Lu and Chipman [25]. These individual podepo-larization parameters are then studied for various delays between pump and probe beams in both crossed-beam and collinear optical gate configurations to quantify the changes in the polarization properties of the Kerr medium upon incidence of the pump beam. Such studies are fruitful in understanding the non-linear optical behavior of any medium in general and since liquid CS2is being used extensively as the Kerr medium in optical gating, it was crucial to study its polarization properties for better comprehension of working of optical time-gates. The applicability of the developed optical time-gate in other fields like in bio-medical optics for studying time-resolved MM of tissue samples is also discussed towards the end of this chapter. Chapter6:
Chapter 2
Classical imaging techniques
Measurement of the properties of fast moving objects at any length scale is a big challenge. In the context of fuel injection, the very high injection pressures used in commercial direct fuel injection engines lead to a liquid jet, which is ejected inside the combustion chamber with a very high velocity. Perturbations arising at the outlet of the nozzle are amplified gradually and lead to the break up of the jet, which results in a droplets cloud (see Fig.2.1). These fuel droplets are usually small enough to evaporate quickly and mix with air before undergoing combustion.
Figure 2.1: Schematic showing various processes involved in combustion of a liquid fuel.
The main interest behind studying atomization of the fuel jets is to compare the results with numerical mod-els, which aim to predict the behavior of the spray in terms of droplet granulometry and spatial localization. For an efficient comparison with the last generation of computer simulation of the atomization process (Fig.2.2), it is necessary to analyze the characteristics of the liquid jet in the near-field of the nozzle. The main reasons why we are so interested in the near-nozzle region are: (i) the present high-fidelity numerical simulations are limited to this region due to the limitations of computational resources, (ii) if the perturbations which arise in the near field of the nozzle are not correctly reproduced by the numerical models, the correct droplet size distribution will certainly not be obtained, (iii) characterization of spray in the far-field of the nozzle is not very useful in understanding the physical phenomenon because in reality, in a fuel engine, the fuel will never reach the state observed in the far-field as the space available for atomization inside the combustion chamber in, for example, a car engine is only a few centimeters and then there is evaporation as well.
The characteristics of the jet in the near field of the nozzle which must be compared are, at the least, its position and velocity in time. This means that the presence of liquid at any given point in space must be
Figure 2.2: Direct numerical simulations (dns) of a liquid jet in the near nozzle region, shown here for illustration [17].
15 predicted as a function of time, and so must be its velocity (i.e. velocity of the liquid/air interface and internal velocity of the fluid as well).
Measurement techniques able to produce such data are extremely limited: most of them are not applicable if the shape of the liquid element is not well defined. For example, phase Doppler anemometry (PDA) is a single-point measurement technique (now commercially available as well) which is used for determining simultaneously the size and the velocity of the spherical liquid droplets. Additionally, it can be also be used for concentration and mass flux measurements. However, this technique is limited to the low droplet concentrations with spherical shapes [26]. Laser correlation velocimetry (LCV) is again a single-point measurement technique, capable of measuring the velocity of liquid elements of any shape, but is not able to give any information about their shapes [27,28].
For these reasons, most researchers use imaging, which does not make any assumption on the shape of the object under study. However, one must always remember that in imaging what one sees is just a 2-D projection of the actual 3-D object and this projection may be perturbed by various optical phenomenon like, multiple light scattering, diffraction, speckle, etc. depending upon the object and illumination source(s). Nevertheless, it allows one to visualize the jet, which is not yet broken up into droplets, has very complex liquid-air interfaces with many finer structures and ligaments moving away from the core jet [29]. Even this technique has its limitations, which will be discussed later.
Over the past several years researchers have proposed various imaging techniques for capturing the dynam-ics of high-pressure fuel sprays using continuous white-light (incoherent) and laser (coherent and monochro-matic) sources with various kinds of cameras. It is easy to see that a straightforward way to capture a fast moving object could be to use a continuous light source for illumination, with a camera fast enough to record the dynamics of the moving object with appropriate resolution. Imaging of fast moving objects poses specific problems because of the limitations of the sensors, for example their exposure duration, repetition rate, etc. Due to technical reasons like charge transfers on the sensors, etc. it has not yet been possible to reduce the exposure time of the high-speed cameras beyond a few hundreds of nanoseconds, as in Phantom v711 and v611 high-speed cameras from Vision Research [30] with minimum exposure time of 300 ns. Although with the SIM series of ultra high speed framing cameras from Specialised Imaging, it is possible to capture images at a frame rate of a billion frames per second (fps) with the minimum exposure time on the order of a nanosecond, but its limitation is that it can only capture a maximum of 16 images at once [31]. Another problem pertaining to the limited frame rate of the cameras is due to the limitations of the on-device data storage and transfer rates and therefore the high frame rate cameras have very low image resolutions, even if improvements appear each year. For instance the FASTCAM SA-Z from Photron [32] could capture 2.1 million fps but at a reduced resolution of 128 × 8 pixels (pixel size = 20 µm). This restricts the field of view in imaging.
Nevertheless a solution for the large exposure time issue of the cameras is to use a short flash or a pulsed illumination source, fast enough to freeze the motion of the moving object with respect to the detector’s sensor chip. Any camera records an image using the tiny light sensors inside it which are arranged in a rectangular grid fashion and usually each of these tiny sensors make up a pixel of the recorded image. So, the pulsed light source must be short enough that the information reaching each of these tiny sensors does not change while the camera is exposed, otherwise what you get is a blurred image of the moving object.
This chapter discusses some of the “classical” techniques1 for imaging of the high-pressure fuel sprays,
their relevance and applicability regime. It describes and uses some image-based processing tools for extracting physical quantities like displacement and velocity patterns, dynamic spatial resolution, spray edge length, etc. from the recorded spray images in order to compare these imaging techniques in the said context.
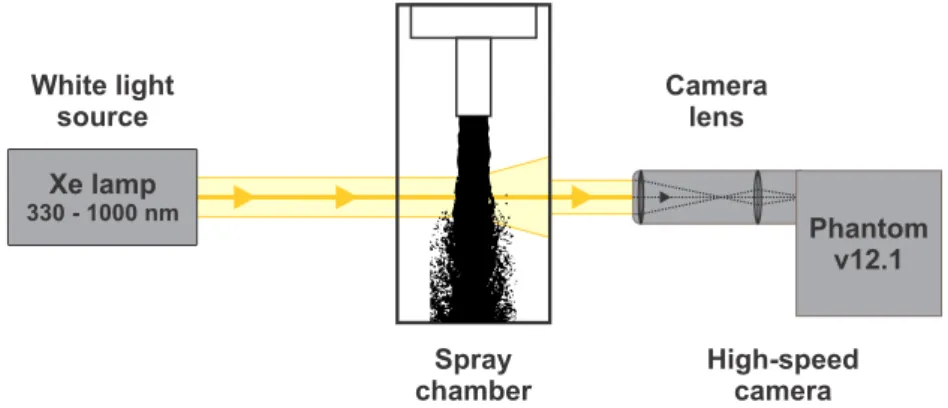
2.1 Imaging with continuous illumination
The schematic of a very straightforward optical setup for imaging of fuel sprays using Xenon lamp as a con-tinuous white-light source for illumination and an high-speed camera Phantom v12.1 to capture the dynamics of the motion is shown in Fig.2.3. A Micro-Nikkor lens from Nikon with focal length f = 200 mm and an
Spray chamber High-speed camera White light source Camera lens Xe lamp 330 - 1000 nm Phantom v12.1
Figure 2.3: Schematic of the optical setup for recording high-speed videos of fuel sprays.
adjustable aperture ranging from f /32 to f /4 was used to adjust optical magnification of the imaging setup. In order to avoid accidental combustion and reduce risks for the experimentalists, a diesel-like surrogate liquid, Castrol calibration oil ISO 4113 was injected in a closed chamber, to avoid any damage to the optical devices in case of a leak, maintained at ATP. The physical properties of the diesel-like fuel are mentioned in Table2.1. Some of the work covered in this thesis used another surrogate oil, Shell NormaFluid ISO 4113 for imaging
Table 2.1: Physical properties of the diesel-like liquid used for recording spray images.
Liquid Density Kinematic viscosity
(ρ) (Kg/m3) (ν) (mm2/s) Diesel fuel [33,34] ∼837 @15◦C ∼2.71 @40◦C Castrol calibration oil - ISO 4113 825 @15◦C 2.53 @40◦C Shell NormaFluid - ISO 4113 [35] 827 @10◦C 2.50 @40◦C
with very similar physical properties as that of Castrol calibration oil as can be seen in Table2.1.
The specifications of the high-speed camera Phantom v12.1 used for recording high-speed videos of the fuel sprays are mentioned in Table2.2.
Figure2.4shows a few frames of the high-speed video recorded for the fuel spray issued using Inj. B2with
an injection pressure of 300 bar. The time between consecutive frames of the recorded high-speed video is 10 µs. However, in Fig.2.4only the alternate frames (1, 3, 5, and so on) are shown with exposure time for each frame e = 300 ns & optical magnification m = 0.6.
Some characteristics of the spray are described below: quasi-ballistic photons for imaging (refer to Chapter4).