HAL Id: hal-02900518
https://hal.archives-ouvertes.fr/hal-02900518
Submitted on 16 Jul 2020
HAL is a multi-disciplinary open access
archive for the deposit and dissemination of
sci-entific research documents, whether they are
pub-lished or not. The documents may come from
teaching and research institutions in France or
abroad, or from public or private research centers.
L’archive ouverte pluridisciplinaire HAL, est
destinée au dépôt et à la diffusion de documents
scientifiques de niveau recherche, publiés ou non,
émanant des établissements d’enseignement et de
recherche français ou étrangers, des laboratoires
publics ou privés.
Automated Backbone NMR Resonance Assignment of
Large Proteins Using Redundant Linking from a Single
Simultaneous Acquisition
Jan Stanek, Tobias Schubeis, Piotr Paluch, Peter Güntert, Loren Andreas,
Guido Pintacuda
To cite this version:
Jan Stanek, Tobias Schubeis, Piotr Paluch, Peter Güntert, Loren Andreas, et al.. Automated Backbone
NMR Resonance Assignment of Large Proteins Using Redundant Linking from a Single Simultaneous
Acquisition. Journal of the American Chemical Society, American Chemical Society, 2020, 142 (12),
pp.5793-5799. �10.1021/jacs.0c00251�. �hal-02900518�
1
Automated backbone NMR resonance assignment of large
proteins using redundant linking from a single
simulta-neous acquisition
Jan Stanek,
#,║,‡Tobias Schubeis,
#,‡Piotr Paluch,
║Peter Güntert,
&,§,=Loren B Andreas,
#,┴and Guido
Pintacuda
#,*
#
Centre de RMN à Très Hauts Champs, FRE (FRE 2034 CNRS, UCB Lyon 1, ENS Lyon), Université de Lyon, 5 rue de la
Doua, 69100 Villeurbanne, France;
║Faculty of Chemistry, University of Warsaw, 02089 Warsaw, Poland;
┴Max Planck
Institute for Biophysical Chemistry, Am Fassberg 11, D-37077 Göttingen, Germany,
&Physical Chemistry, Eidgenössische
Technische Hochschule Zurich, Zurich, Switzerland;
§Center for Biomolecular Magnetic Resonance, Institute of Biophysical
Chemistry, Goethe University Frankfurt, Frankfurt, Germany;
=Department of Chemistry, Tokyo Metropolitan University,
Hachioji, Japan
Supporting Information Placeholder
ABSTRACT:
Thanks to magic-angle spinning (MAS) probes with frequencies of 60–100 kHz, the benefit of high sensitivity 1H detectioncan now be broadly realized in biomolecular solid-state NMR for the analysis of microcrystalline, sedimented, or lipid-embedded prepara-tions. Nonetheless, performing the assignment of all resonances remains a rate-limiting step in protein structural studies, and even the latest optimized protocols fail to perform this step when the protein size exceeds ~20 kDa. Here we leverage the benefits of fast (100 kHz) MAS and high (800 MHz) magnetic fields to design an approach that lifts this limitation. Through the creation, conservation and acquisition of independent magnetization pathways within a single triple-resonance MAS NMR experiment, a single self-consistent dataset can be acquired, providing enhanced sensitivity, reduced vulnerability to machine or sample instabilities, and highly redundant linking that sup-ports fully-automated peak picking and resonance assignment. The method, dubbed RAVASSA (Redundant Assignment Via A Sin-gle Simultaneous Acquisition), is demonstrated with the assignment of the largest protein to date in the solid state, the 42.5 kDa maltose binding protein, using a single fully protonated microcrystalline sample and one week of spectrometer time.
INTRODUCTION
The proton is inherently the most sensitive nuclear spin since it has the highest gyromagnetic ratio among all stable isotopes. This is recognized in solution NMR spectroscopy, where standard acquisition schemes are centered around amide protons for protein resonance assignment and structure determination. For solid-state NMR, following years of pioneering developments,2-5 the benefit
of high sensitivity 1H detection can now be broadly realized
thanks to magic-angle spinning (MAS) probes with frequencies of 60–100 kHz6-7 and beyond.8 With these advances in
instrumenta-tion, high-resolution “fingerprint” correlation spectra can now be obtained for deuterated9-10 and fully protonated proteins11-12 and
RNA13 within minutes using a sub-milligram sample quantity.
This has led to the development of a palette of triple-resonance experiments for accelerating the sequential assignment1,14-17 and
expanding the repertoire of proteins for which nearly complete resonance assignment can be obtained. Currently, however, the complexity of spectra in solids permits the analysis of microcrys-talline, sedimented or lipid-embedded preparations of small pro-teins, and only few examples above 250 amino acid residues (aa) were reported, for which either deuteration18-21 and/or a
combina-tion of differently labeled samples12,22-24 was required.
A potential solution to overcome this size barrier is provided by the study of fully protonated proteins at 100 kHz MAS and above,
with the design of complementary approaches based on the detec-tion of narrow α-proton resonances.25-26 However, the acquisition
of such an expanded dataset also approximately doubles the spec-trometer time required, which makes the entire acquisition vulner-able to machine or sample instabilities,27 and increases severely
the complexity of the data analysis. Deviations in peak position exceeding the linewidth are not unusual in these approaches, in particular if multiple samples are analyzed. While these deviations can sometimes be recognized by expert manual analysis, they can be catastrophic for automated approaches which rely on strict resonance matching thresholds.28 With a manual approach, as-signment of thousands of resonances is cumbersome and time consuming, commonly demanding years of data analysis. We show in the following that these issues can be addressed by auto-mated analysis of a single self-consistent dataset composed of six simultaneously acquired 1H-detected three-dimensional (3D)
spectra employing MAS at frequencies exceeding 100 kHz. The method, hereafter dubbed redundant assignment via a single simultaneous acquisition (RAVASSA), enhances sensitivity, with a 2–3-fold reduction in experimental time, and results in spectra that support fully-automated peak picking and resonance assign-ment. We demonstrate its efficiency with the 371 aa maltose binding protein (MBP), using a single fully-protonated sample (< 1 mg of uniformly 13C,15N-labelled material).
2
RESULTS
Figure 1 depicts the key building blocks needed to implement RAVASSA, by creating, conserving and recording independent magnetization pathways within a single triple-resonance MAS NMR experiment: (A) simultaneous cross-polarization (SIM-CP) from 1H to both 15N and 13C;29-30 (B) co-evolution (time-sharing)
of indirect 15N and 13C chemical shifts;31 (C) bidirectional
cross-polarization allowing simultaneous cross-polarization transfer from 13C
to 15N and vice-versa;29 (D) recovery of orphan terms left over
due to incomplete CP transfers;32-33 and (E) separated acquisition
of 1Hα and 1HN signals, one occurring immediately after the
oth-er.33 In panel (F), we show the simplest case of a co-acquired CP-13C,15N-HSQC31,33 spectrum of MBP which takes advantage of
blocks A, B and E. The amide and aliphatic 2D correlations were acquired simultaneously in 1 hour, as compared to 2 h for record-ing two separate spectra, on a 800 MHz spectrometer at 107 kHz MAS. Samples with 100% abundance of protons, which recently became available to proton-detected NMR analysis with ≥100 kHz MAS, are central to the performance of SIM-CP, since they contain independent reservoirs of 1H magnetization for 1H-15N
and 1H-13Cα pathways as demonstrated both experimentally and
by quantum-mechanical calculations in Fig S1-S3. Note that, while our main focus here is on the backbone nuclei, simultaneous polarization in fully protonated proteins can also be exploited to generate correlations of side-chain spins, e.g. through-space con-tacts using broadband 1H,1H RFDR-techniques.31 Concerning the
mode of detection (Fig 1E), deferring the acquisition of 1HN signal comes at virtually no cost due to very slow relaxation of the 15N
z-polarization in solids (T1 of the order of seconds).29 Additionally,
simpler radiofrequency (RF) conditions are used for separate “back” CP, and the cross-talk between pathways (15N→1Hα and
13Cα→1HN transfers) is avoided. Also, 1Hα and 1HN signals, with
partially overlapping chemical shift ranges, are cleanly separated. These design principles are used to construct the more complex pulse sequences discussed below. Figure 2 shows the pulse se-quence for an implementation of RAVASSA based around a
direct amide-to-amide transfer experiment (NNH).15-16 A compar-ison of panels (A) and (B) shows the additional transfer blocks used to record a total of eight unique transfer pathways. The NNH scheme contains five coherence transfers between consecutive nuclei along the protein backbone and therefore contains multiple opportunities for the incorporation of the building blocks de-scribed above (see SI for detailed description of the pulse se-quences). Simultaneous CP, coevolution and bidirectional CP naturally lead to acquisition of an analogous experiment for Hα-detected inter-residue Cα–Cα correlation (CCH) together with NNH. By retaining orphan spin operators (Fig1D) left after the
13C–15N CP, four additional spectra (and 2-fold redundant
reso-nance linking, as described below) can be co-acquired, namely the intra- and inter-residue N–Cα–Hα and Cα–N–HN correlations. Overall, a total of six useful pathways can be observed.
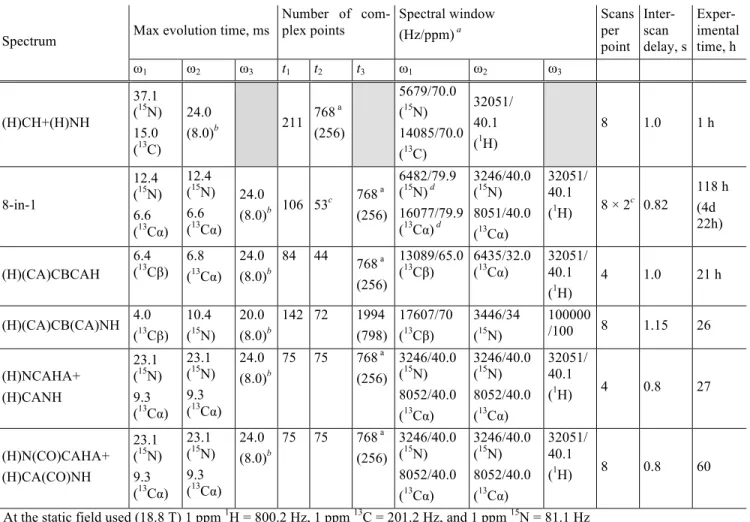
Figure 3 shows the resulting eight co-acquired spectra, together with representative data on MBP. A proper separation of data sets requires only a doubling of a spectral window in dimension ω1,
and one additional phase-cycle to discriminate pairs of pathways, without any impact on sensitivity. A trivial linear combination of data is used to extract the spectra arranged as shown in Figure 3A. Our implementation makes no compromise on resolution in any dimension, due to the possibility to extend periods of low power proton decoupling during each indirect evolution (see SI). Uncon-strained chemical shift evolution times for 15N and 13C nuclei are indeed essential for the resolution of spectra for proteins as large as MBP. The experiment was performed in less than 5 days (in-stead of more than 16 days necessary with a regular acquisition) and showed excellent sensitivity, resolution and high information content, as demonstrated with heteronuclear (ω1-ω2) projections
of component spectra in Figure 3B. Together, the four-fold redun-dant sequential linking of the resulting datasets provide highly fault tolerant data for backbone resonance assignment (Figure 3C). It consists of all combinations: 1HN–detected spectra with sequential correlations through (1) 13Cα or (2) 15N chemical
shifts, and, symmetrically, 1Hα-detected spectra correlated by (3) 15N or (4) 13Cα frequencies. Representative strips from six spectra
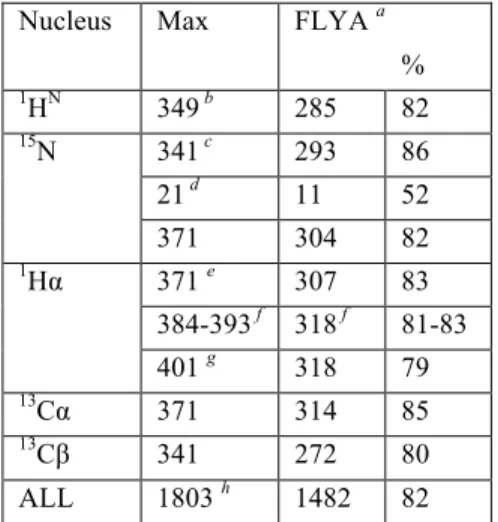
are shown in Figure 3D. Completeness of the spectra is character-ized by automatic identification of 275 to 309 cross-peaks out of a maximum 349 to 371 expected in particular spectra (1770 in total). Peaks were automatically identified using the routine em-bedded in the spectral analysis software CCPN,34 and inevitably
contained a certain fraction (approximately 15%) of noise peaks.
Figure 2. Simplified time diagram of RF irradiation for (A)
con-ventional amide-to-amide proton transfer experiment (NNH)15 and
(B) its expansion using simultaneous excitation, coevolution and bidirectional CP transfers (RAVASSA).
Figure 1. Scheme of radiofrequency building blocks for multiple
pathway coherence transfers: (A) simultaneous cross-polarization of amide 15N and 13Cα spins from spatially proximal protons;
(B) unconstrained co-evolution of 15N and 13C chemical shifts;
(C) bidirectional 15N–13C CP without and (D) with recovery of orphan coherence; (E) a single scan sequential acquisition of α and amide 1H signal following respective CPs from 13Cα and 15N.
(F) Simultaneous dipolar-based 13C,15N-HSQC spectrum of malt-ose binding protein (see SI for a detailed RF scheme of this exper-iment).
3
The redundancy of information and consistency of chemical shifts in four assignment connectivities makes it perfectly amenable to automation and robust in the presence of spurious peaks.
For assignment automation, we turned to the exceptionally flexi-ble automated resonance assignment algorithm FLYA35 that has
been applied to 13C/15N-detected solid state data36 and very large
methyl-labeled proteins.37 The algorithm accommodated unusual
Hα–detected correlations with straightforward extensions of the FLYA library (provided in SI). Given the discontinuities in se-quential linking due to 21 proline residues (6% of the sequence) or otherwise missing correlations, we expanded our data set by intraresidue (but not interresidue) correlations of either amide and α-protons to 13Cβ shifts (namely (H)(CA)CB(CA)NH38 and (H)(CA)CBCAH25 spectra), which provide reliable information
on a specific residue type and thus greatly help to locate frag-ments within the protein sequence. As demonstrated in Figure 4, small deviations of chemical shifts (approximately 0.1 and 0.3 ppm for 1H and 13C/15N shifts) and high redundancy of
infor-mation allowed to overcome critical ambiguity of resonance matching, typically encountered in large proteins, leading to approximately 82% complete assignment. This is in contrast to the previous state of the art based on the 1HN-detection and
match-ing of 13C chemical shifts1 (black curve in Figure 4), which was used to assign a suite of smaller proteins, but fails to assign more than 40% of MBP resonances regardless of matching tolerances. The lower limit for chemical shift tolerances is imposed by exper-imental linewidths and sensitivity, and for many important classes of samples (e.g., for integral membrane or fibrillar proteins) larger
linewidths are typically found than observed for MBP. It is appar-ent from Figure 4 that the inherappar-ent ambiguity of the large protein MBP is beyond the capability for the five 1HN-detected spectra, while the new approach leads to robust assignment. This is partic-ularly apparent for higher tolerance values that correspond to the case of increased linewidths found for many important biological samples.
To further investigate the key component of RAVASSA, we restricted our data set by independently recording joint intra- and interresidue N–Cα–Hα and Cα–N–HN correlations (pulse schemes
provided in SI). This data also benefits from improved chemical shift consistency inherent for simultaneously acquired spectra, thus the limiting tolerances (lower limit) are identical to RAVASSA. In the case of MBP the extent of assignment is al-most as good, however, the restricted data set breaks down rapidly with increasing matching tolerance (blue curve in Figure 4). It is therefore clear that the higher robustness of RAVASSA with respect to large linewidths stems from the NNH and CCH correla-tions. Interestingly, these correlations alone are clearly too am-biguous to yield a complete assignment in an automatic way (cyan curve in Figure 4). In FLYA, the four pathways support each other in resolving assignment ambiguities, with a significant cooperative effect (see supplementary Figure S12 for statistics on how often peaks from the different pathways are assigned for each residue). A relatively wide range of matching tolerances which provide reasonably complete automatic assignment (0.2–0.6 ppm for heteronuclei) not only simplifies the use of RAVASSA for samples different than studied here, but also suggests its power for
Figure 3. (A) The data layout of 8 simultaneously acquired spectra after addition/subtraction of interleaved signals A and B. Separation of
pathways undergoing either 13
Cα or 15
N evolution in ω1 is achieved by doubled spectral window and TPPI-type up- and downfield
frequen-cy shift, while separation in ω2 is unnecessary since the frequency range ( 13
Cα or 15N) is implied from the detected nucleus. (B) Skyline
projections of the 8 spectra onto the ω1-ω2 plane (13Cα or 15N, and combinations thereof). (C) Scheme of simultaneously observed
coher-ence transfer pathways across the protein backbone that give rise to four independent resonance matching methods. (D) Representative strips showing sequential assignment of 15N, 13Cα, 1Hα and 1HN resonances of residues A134-K137 of MBP based on intra- (orange and
blue contours) and interresidue correlations (red and magenta contours) correlations found in six simultaneously acquired 3D spectra
em-ploying 1HN-detection (two top panels, in orange, red and light green) or 1
Hα-detection (two bottom panels, in blue, magenta and brown). For (H)N(CA)(CO)NH (2nd from the top) and (H)CA(N)(CO)CAHA (bottom last) spectra the implied positions of diagonal peaks
(sup-pressed in these experiments) are shown with dots to illustrate the sequential walk. The ω1 (either 13
Cα or 15
N)-ω3(
1H) cross-sections of 3D
4
assignment of larger proteins (since assignment ambiguity is determined by matching tolerances and protein size).
Figure 5 summarizes the automatically obtained resonance as-signment, which is evenly distributed among different structural elements of MBP. About 18% of α and amide 1H remained
unas-signed, which are likely undetectable with CP-based methods due to either increased local dynamics or intermediate conformational exchange as suggested by peak counts in the triple resonance spectra (see SI). In lieu of manual verification of the assignment we performed an unbiased correlation of protein dihedral angles φ and ψ predicted by TALOS-N39 based on the automatically as-signed shifts with respect to those in the X-ray derived structure (PDB 1ANF). A very good agreement (Figure 5D) proves validity of chemical shifts, whereas a very few outliers (1.5% of 470 angles) remain well within the limitations of TALOS predictions. We observe a very good match overall between the newly as-signed chemical shifts and those of MBP in solution, at least for what concerns 13Cα and 13Cβ nuclei (Figure S13). Larger
differ-ences are observed for amide 15N and 1H, which are notoriously
sensitive to the chemical environment, and vary significantly with the ligand complexation state of the protein and with preparations conditions (pH, buffer, precipitant).
In comparison with assignment strategies developed for protein solutions, the solid-state samples present unique challenges. While in solution, a main limitation to tackling larger proteins arises due to the decreased sensitivity of slowly tumbling mole-cules, which is inherently dependent upon particle size. The size limit in solution can, to a certain degree, be extended by increas-ing temperature, reducincreas-ing relaxation via deuteration, as well as implementation of TROSY techniques that select for long-lived spin components.40 While these issues are absent in the solid, the linewidths of solid protein preparations are typically larger than in solution, and unsurprisingly, the limitation in this case becomes resonance overlap and ambiguity in sequential resonance match-ing. (Even with the advantages of proton detection, the sensitivity at present limits acquisitions to 3D or 4D datasets, with 3D data being the most common.) The present approach using a large
number of co-acquired spectra meets these unique challenges encountered in solid protein preparations.
CONCLUSION
We have described a novel strategy for backbone NMR assign-ment of large proteins that does not rely on deuteration, but in-stead is based on automated analysis of high-resolution proton detected 3D spectra obtained at ultrafast MAS with parallel 1HN
and 1Hα-detection. We showed that full occupation of proton sites
Figure 4. Characterization of the sensitivity of the automated
assignment with respect to the matching tolerance. Red, blue, cyan and black dots indicate the assignment completeness, de-fined as the ratio of strongly assigned to all 1HN, 1Hα, 13Cα, 13Cβ and 15N resonances, obtained with the compete and reduced
RAVASSA datasets, as well as with the classical 1HN detected
datasets,1respectively.Points are connected for eye guidance only.
Figure 5. Assigned dipolar heteronuclear correlation spectrum of
maltose binding protein: 15N-1H (red contours) and α-region of 13C-1H correlations (blue contours), acquired simultaneously. (B)
Result of automated FLYA resonance assignment of MBP. Reso-nances with “strongly” determined chemical shifts are marked in blue (or in black, if located in isolated short fragments and thus discarded), while those below confidence threshold are shown in grey. (C) X-ray derived structural model of maltose binding pro-tein (PDB 1ANF) with assigned residues marked in blue. (D) Backbone dihedral angles φ and ψ predicted based on assigned chemical shifts and in the X-ray structure.
5
enables a simultaneous acquisition of six different correlation spectra, which offers significant time savings, or equivalently, sensitivity gains. Inherent consistency and redundancy of the data provides an additional benefit to automatic resonance assignment of otherwise overwhelming complexity, as shown on the example of maltose binding protein (371 residues), which to our knowledge is the largest monomeric protein assigned in the solid state. A single uniformly 13C, 15N-labelled sample (< 1 mg), and
approximately one week of 800 MHz NMR instrument time, using a standard single receiver, were used in this study. We furthermore showed that the assignment strategy is particularly robust against the choice of chemical shift matching tolerance, or linewidths observed for a particular sample. We therefore expect that the approach will open an efficient avenue to access site-specific NMR information in large proteins, and will be readily extended to even larger proteins, or proteins exhibiting more challenging resolution.
EXPERIMENTAL SECTION
Sample preparation
13C,15N-labeled N-terminal His-TEV-tagged Maltose Binding
Protein (MalE 27-396, E. coli) was expressed in E. coli C41 cells and purified on a 5 ml Ni2+-sepharose column (GE Healthcare) using standard methods. The His-tag was removed with TEV-Protease (in-house production) and MBP further purified by size exclusion and ion exchange chromatography. Eventually, the protein was dialyzed against 10 mM HEPES pH 7.5, 1 mM malt-ose. Small platelet-like crystals were produced by sitting drop vapor diffusion in 24-well plates using 600 µl reservoir (10 mM HEPES pH 7.5, 3 M (NH4)2SO4). In each well, 15 µl MBP
solu-tion (c = 5 mg/ml) was mixed with 15 µl reservoir. Crystals grew at room temperature within 3 days. One 24-well plate yielded sufficient material for one NMR sample. (NH4)2SO4 was chosen
as precipitant (instead of e.g. PEG) in order to avoid introduction of naturally abundant 13C nuclei. MBP crystals were packed by
ultracentrifugation at 100,000 × g at 10 °C directly into a 0.7 mm MAS rotor using a 1.3 mm ultracentrifuge tool (Giotto Bio-tech).41
NMR spectroscopy
The experiments were performed on a Bruker AVANCE III 18.8 T spectrometer (1H frequency of 800 MHz) using a 4-channel
(HCND) 0.7 mm MAS probe. Sample rotation frequency was maintained at 107.00 ± 0.02 kHz, and the sample temperature was approximately 15 °C. Details on RF applied during CP transfers, pulse program listings and RF schemes are provided in SI. All spectra were processed with nmrPipe42 using scripts provided in
the SI, peak-picked automatically and converted to Xeasy format in CcpNmr Analysis 2.4.34
SIM-CP simulations
Simulations of simultaneous 1H→13C,15N CP were performed with SIMPSON43 software version 4.0.0c for rotation frequencies between 20 and 125 kHz. Powder averaging was performed with 168×17=2856 Euler angles {αMR, βMR, γMR} that described the
orientation of the molecule in the rotor frame. 168 angle pairs {αMR, βMR} were selected according to the Repulsion method,44
whereas 17 γMR angles were regularly stepped from 0 to 360°.
7 spins were considered to simulate proton bath in the fully proto-nated proteins: 1HN, 1Hα, 1Hβ
2, 1Hβ3, 15N, 13Cα, 13Cβ. The
simula-tion was performed at 18.8 T magnetic field strength (1H
frequen-cy of 800 MHz). The RF irradiation of 15N, 13Cα was considered
on resonance, 13Cβ was assumed -20 ppm off-resonance, and 1HN, 1Hα, 1Hβ
2/1Hβ3 chemical shift offset with respect to RF carrier
(typically 4.7 ppm for solvent signal) was set to 4.0, -0.5 and -2.2
ppm, respectively. Chemical shift anisotropy was neglected for all spins. RF irradiation strength ranges were 0-250 kHz for 1H, 13C
and 15N. RF field inhomogeneity was neglected, thus constant RF amplitude was assumed during CP. Only proton thermally equili-brated magnetization was considered at the starting point of the simulation. To simulate CP transfer the propagator for one rotor period was calculated and reused to reach contact time of 300 µs. The SIM-CP efficiency was evaluated as the 15N and 13Cα
mag-netization at the end of RF irradiation. Further details, including geometry of the restricted spin system and sample scripts, can be found in SI.
Automated assignment
Automated analysis of obtained correlations was performed by FLYA as implemented in CYANA package v. 3.98.5. Library extensions for new types of experiments as well as CYANA batch scripts are provided in SI. Optimal assignment was obtained using matching tolerances of 0.1, 0.3 and 0.3 ppm for 1H, 13C and 15N
frequencies, respectively. A population size of 50 was set for genetic optimization algorithm. 20 independent runs were per-formed to identify consensus chemical shifts, with a threshold of 16 self-consistent chemical shift values for a “strong” assignment. Detailed statistics on the assignment completeness for particular nuclei and peak lists are provided in SI.
ASSOCIATED CONTENT
Supporting Information
Detailed NMR experimental setup, radiofrequency irradiation schemes with Bruker spectrometer implementation, details on data processing and automated analysis (PDF). The Supporting Information is available free of charge on the ACS Publications website.
AUTHOR INFORMATION
Corresponding Author
Guido Pintacuda ([email protected])
Author Contributions
‡These authors contributed equally.
Notes
The authors declare no competing financial interests.
ACKNOWLEDGMENT
The MBP plasmid was kindly provided by Prof. Gottfried Otting (ANU). The work was funded by the European Research Council (ERC) under the European Union’s Horizon 2020 research and innovation programme (ERC-2015-CoG GA 648974). JS was supported with the European Commission’s REA with a MSCA fellowship (GA 661799) and by the Polish National Agency for Academic Exchange (contract No PPN/PPO/2018/1/00098). The computational resources were provided by the Polish Infrastruc-ture for Supporting Computational Science in the European Re-search Space (PLGRID).
REFERENCES
(1) Barbet-Massin, E.; Pell, A. J.; Retel, J. S.; Andreas, L. B.; Jaudzems, K.; Franks, W. T.; Nieuwkoop, A. J.; Hiller, M.; Higman, V.; Guerry, P.; Ber- tarello, A.; Knight, M. J.; Felletti, M.; Le Marchand, T.; Kotelovica, S.; Akopjana, I.; Tars, K.; Stoppini, M.; Vittorio, B.; Bolognesi, M.; Ricagno, S.; Chou, J. J.; Griffin, R. G.; Oschkinat, H.; Lesage, A.; Emsley, L.; Herrmann, T.; Pintacuda, G. Rapid proton-detected NMR assignment for proteins with fast magic angle spinning; J. Am. Chem. Soc.
6
(2) Ishii, Y.; Yesinowski, J. P.; Tycko, R. Sensitivity enhancement insolid-state 13C NMR of synthetic polymers and biopolymers by 1H NMR detection with high-speed magic angle spinning; J. Am. Chem. Soc. 2001, 123, 2921-2922.
(3) Reif, B.; Jaroniec, C. P.; Rienstra, C. M.; Hohwy, M.; Griffin, R. G. 1H-1H MAS correlation spectroscopy and distance measurements in a deuterated peptide; J. Magn. Reson. 2001, 151, 320-327.
(4) Paulson, E. K.; Morcombe, C. R.; Gaponenko, V.; Dancheck, B.; Byrd, R. A.; Zilm, K. W. Sensitive high resolution inverse detection NMR spectroscopy of proteins in the solid state; J. Am. Chem. Soc. 2003, 125, 15831-15836.
(5) Zhou, D. H.; Shea, J. J.; Nieuwkoop, A. J.; Franks, W. T.; Wylie, B. J.; Mullen, C.; Sandoz, D.; Rienstra, C. M. Solid-state protein-structure determination with proton-detected triple-resonance 3D magic-angle-spinning NMR spectroscopy; Angew. Chem. Int. Ed. Engl. 2007, 46, 8380-8383.
(6) Andreas, L. B.; Le Marchand, T.; Jaudzems, K.; Pintacuda, G. High-resolution proton-detected NMR of proteins at very fast MAS; J. Magn. Reson. 2015, 253, 36-49.
(7) Böckmann, A.; Ernst, M.; Meier, B. H. Spinning proteins, the faster, the better?; J. Magn. Reson. 2015, 253, 71-79.
(8) Samoson, A. H-Mas; J. Magn. Reson. 2019, 306, 167-172.
(9) Knight, M. J.; Webber, A. L.; Pell, A. J.; Guerry, P.; Barbet-Massin, E.; Bertini, I.; Felli, I. C.; Gonnelli, L.; Pierattelli, R.; Emsley, L.; Lesage, A.; Herrmann, T.; Pintacuda, G. Fast resonance assignment and fold determination of human superoxide dismutase by high-resolution proton-detected solid-state MAS NMR spectroscopy; Angew. Chem. Int. Ed. Engl. 2011, 50, 11697-11701.
(10) Lewandowski, J. R.; Dumez, J. N.; Akbey, Ü.; Lange, S.; Emsley, L.; Oschkinat, H. Enhanced resolution and coherence lifetimes in the solid-state NMR spectroscopy of perdeuterated proteins under ultrafast Magic-Angle Spinning; J. Chem. Phys. Lett. 2011, 2, 2205-2211.
(11) Andreas, L. B.; Jaudzems, K.; Stanek, J.; Lalli, D.; Bertarello, A.; Le Marchand, T.; De Paepe, D. C.; Kotelovica, S.; Akopjana, I.; Knott, B.; Wegner, S.; Engelke, F.; Lesage, A.; Emsley, L.; Tars, K.; Herrmann, T.; Pintacuda, G. Structure of fully protonated proteins by proton-detected magic-angle spinning NMR; Proc. Natl. Acad. Sci. USA 2016, 113, 9187-9192.
(12) Struppe, J.; Quinn, C. M.; Lu, M.; Wang, M.; Hou, G.; Lu, X.; Kraus, J.; Andreas, L. B.; Stanek, J.; Lalli, D.; Lesage, A.; Pintacuda, G.; Maas, W.; Gronenborn, A. M.; Polenova, T. Expanding the horizons for structural analysis of fully protonated protein assemblies by NMR spectroscopy at MAS frequencies above 100 kHz; Solid State Nucl. Magn. Reson. 2017, 87, 117-125.
(13) Marchanka, A.; Stanek, J.; Pintacuda, G.; Carlomagno, T. Rapid access to RNA resonances by proton-detected solid-state NMR at >100 kHz MAS; Chem. Commun. 2018, 54, 8972-8975.
(14) Penzel, S.; Smith, A. A.; Agarwal, V.; Hunkeler, A.; Org, M. L.; Samoson, A.; Böckmann, A.; Ernst, M.; Meier, B. H. Protein resonance assignment at MAS frequencies approaching 100 kHz: a quantitative comparison of J-coupling and dipolar-coupling-based transfer methods; J. Biomol. NMR 2015, 63, 165-186.
(15) Andreas, L. B.; Stanek, J.; Le Marchand, T.; Bertarello, A.; Paepe, D. C.; Lalli, D.; Krejcikova, M.; Doyen, C.; Oster, C.; Knott, B.; Wegner, S.; Engelke, F.; Felli, I. C.; Pierattelli, R.; Dixon, N. E.; Emsley, L.; Herrmann, T.; Pintacuda, G. Protein residue linking in a single spectrum for magic-angle spinning NMR assignment; J. Biomol. NMR 2015, 62, 253-261.
(16) Xiang, S.; Grohe, K.; Rovó, P.; Vasa, S. K.; Giller, K.; Becker, S.; Linser, R. Sequential backbone assignment based on dipolar amide-to-amide correlation experiments; J. Biomol. NMR 2015, 62, 303-311. (17) Fricke, P.; Chevelkov, V.; Zinke, M.; Giller, K.; Becker, S.; Lange, A. Backbone assignment of perdeuterated proteins by solid-state NMR using proton detection and ultrafast magic-angle spinning; Nat. Protoc.
2017, 12, 764-782.
(18) Wang, S.; Munro, R. A.; Shi, L.; Kawamura, I.; Okitsu, T.; Wada, A.; Kim, S.-Y.; Jung, K.-H.; Brown, L. S.; Ladizhansky, V. Solid-state NMR spectroscopy structure determination of a lipid-embedded heptahelical membrane protein; Nat. Meth. 2013, 10, 1007-1012.
(19) Retel, J. S.; Nieuwkoop, A. J.; Hiller, M.; Higman, V. A.; Barbet-Massin, E.; Stanek, J.; Andreas, L. B.; Franks, W. T.; van Rossum, B. J.; Vinothkumar, K. R.; Handel, L.; de Palma, G. G.; Bardiaux, B.; Pintacuda, G.; Emsley, L.; Kuhlbrandt, W.; Oschkinat, H. Structure of outer membrane protein G in lipid bilayers; Nat. Commun. 2017, 8, 2073.
(20) Vasa, S. K.; Singh, H.; Rovo, P.; Linser, R. Dynamics and Interactions of a 29 kDa Human Enzyme Studied by Solid-State NMR; J. Phys. Chem. Lett. 2018, 9, 1307-1311.
(21) Ward, M. E.; Shi, L.; Lake, E.; Krishnamurthy, S.; Hutchins, H.; Brown, L. S.; Ladizhansky, V. Proton-detected solid-state NMR reveals intramembrane polar networks in a seven-helical transmembrane protein proteorhodopsin; J. Am. Chem. Soc. 2011, 133, 17434-17443.
(22) Gauto, D. F.; Estrozi, L. F.; Schwieters, C. D.; Effantin, G.; Macek, P.; Sounier, R.; Sivertsen, A. C.; Schmidt, E.; Kerfah, R.; Mas, G.; Colletier, J. P.; Güntert, P.; Favier, A.; Schoehn, G.; Schanda, P.; Boisbouvier, J. Integrated NMR and cryo-EM atomic-resolution structure determination of a half-megadalton enzyme complex; Nat. Commun.
2019, 10, 2697.
(23) Gupta, S.; Tycko, R. Segmental isotopic labeling of HIV-1 capsid protein assemblies for solid state NMR; J. Biomol. NMR 2018, 70, 103-114.
(24) Han, Y.; Ahn, J.; Concel, J.; Byeon, I.-J. L.; Gronenborn, A. M.; Yang, J.; Polenova, T. Solid-State NMR Studies of HIV-1 Capsid Protein Assemblies; J. Am. Chem. Soc. 2010, 132, 1976-1987.
(25) Stanek, J.; Andreas, L. B.; Jaudzems, K.; Cala, D.; Lalli, D.; Bertarello, A.; Schubeis, T.; Akopjana, I.; Kotelovica, S.; Tars, K.; Pica, A.; Leone, S.; Picone, D.; Xu, Z.-Q.; Dixon, N. E.; Martinez, D.; Berbon, M.; El Mammeri, N.; Noubhani, A.; Saupe, S.; Habenstein, B.; Loquet, A.; Pintacuda, G. NMR spectroscopic assignment of backbone and side‐ chain protons in fully protonated proteins: microcrystals, sedimented assemblies, and amyloid fibrils; Angew. Chem. Int. Ed. 2016, 128, 15730-15735.
(26) Lalli, D.; Idso, M. N.; Andreas, L. B.; Hussain, S.; Baxter, N.; Han, S.; Chmelka, B. F.; Pintacuda, G. Proton-Based Structural Analysis of a Heptahelical Transmembrane Protein in Lipid Bilayers; J. Am. Chem. Soc.
2017, 139, 13006-13012.
(27) Malmodin, D.; Papavoine, C. H.; Billeter, M. Fully automated sequence-specific resonance assignments of hetero-nuclear protein spectra; J. Biomol. NMR 2003, 27, 69-79.
(28) Niklasson, M.; Ahlner, A.; Andresen, C.; Marsh, J. A.; Lundström, P. Fast and accurate resonance assignment of small-to-large proteins by combining automated and manual approaches; PLoS Comput. Biol. 2015, 11, e1004022.
(29) Gopinath, T.; Veglia, G. Dual acquisition magic-angle spinning solid-state NMR-spectroscopy: simultaneous acquisition of multidimensional spectra of biomacromolecules; Angew. Chem. Int. Ed. Engl. 2012, 51, 2731-2735.
(30) Das, B. B.; Opella, S. J. Multiple acquisition/multiple observation separated local field/chemical shift correlation solid-state magic angle spinning NMR spectroscopy; J. Magn. Reson. 2014, 245, 98-104. (31) Linser, R.; Bardiaux, B.; Higman, V.; Fink, U.; Reif, B. Structure calculation from unambiguous long-range amide and methyl 1H-1H distance restraints for a microcrystalline protein with MAS solid-state NMR spectroscopy; J. Am. Chem. Soc. 2011, 133, 5905-5912.
(32) Gopinath, T.; Veglia, G. Orphan spin operators enable the acquisition of multiple 2D and 3D magic angle spinning solid-state NMR spectra; J Chem Phys 2013, 138, 184201.
(33) Sharma, K.; Madhu, P. K.; Mote, K. R. A suite of pulse sequences based on multiple sequential acquisitions at one and two radiofrequency channels for solid-state magic-angle spinning NMR studies of proteins; J. Biomol. NMR 2016, 65, 127-141.
(34) Vranken, W. F.; Boucher, W.; Stevens, T. J.; Fogh, R. H.; Pajon, A.; Llinas, M.; Ulrich, E. L.; Markley, J. L.; Ionides, J.; Laue, E. D. The CCPN data model for NMR spectroscopy: development of a software pipeline; Proteins 2005, 59, 687-696.
(35) Schmidt, E.; Güntert, P. A new algorithm for reliable and general NMR resonance assignment; J. Am. Chem. Soc. 2012, 134, 12817-12829. (36) Schmidt, E.; Gath, J.; Habenstein, B.; Ravotti, F.; Székely, K.; Huber, M.; Buchner, L.; Böckmann, A.; Meier, B. H.; Güntert, P. Automated solid-state NMR resonance assignment of protein microcrystals and amyloids; J. Biomol. NMR 2013, 56, 243-254.
(37) Pritišanac, I.; Würz, J. M.; Alderson, T. R.; Güntert, P. Automatic structure-based NMR methyl resonance assignment in large proteins; Nat. Commun. 2019, 10, 4922.
(38) Barbet-Massin, E.; Pell, A. J.; Jaudzems, K.; Franks, W. T.; Retel, J. S.; Kotelovica, S.; Akopjana, I.; Tars, K.; Emsley, L.; Oschkinat, H.; Lesage, A.; Pintacuda, G. Out-and-back 13C-13C scalar transfers in protein resonance assignment by proton-detected solid-state NMR under ultra-fast MAS; J. Biomol. NMR 2013, 56, 379-386.
7
(39) Shen, Y.; Bax, A. Protein backbone and sidechain torsion anglespredicted from NMR chemical shifts using artificial neural networks; J. Biomol. NMR 2013, 56, 227-241.
(40) Salzmann, M.; Pervushin, K.; Wider, G.; Senn, H.; Wüthrich, K. TROSY in triple-resonance experiments: new perspectives for sequential NMR assignment of large proteins; Proc. Natl. Acad. Sci. U. S. A. 1998, 95, 13585-13590.
(41) Bertini, I.; Engelke, F.; Gonnelli, L.; Knott, B.; Luchinat, C.; Osen, D.; Ravera, E. On the use of ultracentrifugal devices for sedimented solute NMR; J. Biomol. NMR 2012, 54, 123-127.
(42) Delaglio, F.; Grzesiek, S.; Vuister, G. W.; Zhu, G.; Pfeifer, J.; Bax, A. NMRPipe: a multidimensional spectral processing system based on UNIX pipes; J. Biomol. NMR 1995, 6, 277-293.
(43) Bak, M.; Rasmussen, J. T.; Nielsen, N. C. SIMPSON: a general simulation program for solid-state NMR spectroscopy; J. Magn. Reson.
2000, 147, 296-330.
(44) Bak, M.; Nielsen, N. C. REPULSION, A Novel Approach to Efficient Powder Averaging in Solid-State NMR; J. Magn. Reson. 1997, 125, 132-139.
Supporting Information
Automated backbone NMR resonance assignment of large
proteins using redundant linking from a single
simulta-neous acquisition
Jan Stanek,
#,║,‡Tobias Schubeis,
#,‡Piotr Paluch,
║Peter Güntert,
&,§,=Loren B Andreas,
#,┴and Guido
Pintacuda
#,*
#
Centre de RMN à Très Hauts Champs, FRE (FRE 2034 CNRS, UCB Lyon 1, ENS Lyon), Université de Lyon, 5 rue de la
Doua, 69100 Villeurbanne, France;
║Faculty of Chemistry, University of Warsaw, 02089 Warsaw, Poland;
┴Max Planck
Institute for Biophysical Chemistry, Am Fassberg 11, D-37077 Göttingen, Germany,
&Physical Chemistry, Eidgenössische
Technische Hochschule Zurich, Zurich, Switzerland;
§Center for Biomolecular Magnetic Resonance, Institute of Biophysical
Chemistry, Goethe University Frankfurt, Frankfurt, Germany;
=Department of Chemistry, Tokyo Metropolitan University,
Hachioji, Japan
CONTENTS
A. SIMULTANEOUS CP UNDER ULTRAFAST MAS
2
B. DETAILED RF PULSE SCHEMES
7
C. NMR DATA ACQUISITION PARAMETERS
10
D. SENSITIVITY OF RAVASSA PATHWAYS
13
E. NMR DATA PROCESSING
15
F. JOINT MANUAL ANALYSIS OF INTRA AND INTERRESIDUE H
NAND HΑ-‐DETECTED SPECTRA
17
G. DETAILS OF AUTOMATED ASSIGNMENT
17
H. CHEMICAL SHIFTS OF MBP IN THE SOLID-‐STATE VERSUS IN SOLUTION
20
I. EXTENSIONS OF THE FLYA LIBRARY
21
J. PULSE PROGRAMS IN BRUKER CODE
22
2
A. Sim ultaneous CP under ultrafast M AS
The contribution of amide and aliphatic proton to
15N and
13C pathways in conventional
15N- and
13C-CP-HSQC experiments is
tracked in Figure S1 by frequency encoding the source proton. It can be seen that the two
1H
N→
15N and
1Hα→
13Cα paths are nearly
independent, with for example only about 7 percent of the signal in Fig S1B originating from amide protons (Box B4). In S1A, box
A1 and A2, it can be seen that about 13 percent of the signal in the H-N-H transfer pathway originates from aliphatic protons and
about 5 percent from alpha protons. Lost magnetization in the final CP (Boxes A4 and B1) is also minimal, and is not included in
the determination of total signal. Note that this magnetization leak occurs irrespective of whether conventional or simultaneous CP
is performed, and is generally related to the “cross-talk” between pathways (i.e.
15N→
1Haliphatic and
13Cα→
1H
Ntransfers).
At 100 kHz MAS, we observed a 6 and 16% loss, respectively, in the simultaneous experiments as compared with conventional
13C- and
15N-CP-HSQC spectra recorded separately (Figure S3). The negligible loss for the
13C pathway, and the larger loss for
15N
are in full agreement with previous reports for SIM-CP with heteronuclear detection at slow MAS.
1A somewhat larger impact of
SIM-CP for
15N is fully confirmed by quantum-mechanical simulations
2on a system of 7 spins (Figure S2). These simulations
highlight that the
15N spins are sensitive to drainage of
1Hα (and other aliphatic) polarization during concurrent
1H-
13C CP, while for
13Cα, abundant remote side-chain protons constitute a better polarization reservoir.
Figure S4 shows the performance of
1H-
13C and
1H-
15N (independent) CP transfers measured as the largest magnitude in
13C- and
15N-CP-HSQC 1D experiments as a function of
1H and
13C, or
1H and
15N RF strengths, respectively. This proves that both CPs
exhibit optimal efficiency for analogous conditions, and simultaneous
1H-
13C,
15N CP, which requires a common
1H RF field
strength for both transfers, does not compromise their efficiency.
Figure S1. Investigation of the degree of independence and interference during simultaneous CP by recording the source proton in
normally acquired 2D H(N)H and H(C)H spectra. Optimized contact times of forward CP were 1100 µs (
1H→
15N) and 400 µs
(
1H→
13C), and of backward CP were 900 µs (
15N→
1H) and 200 µs (
13C→
1H) were used.
3
Figure S2. SIMPSON simulations that characterize interference occurring during simultaneous CP, leading to minor loss of transfereffi-ciency. The simulations were performed for 1H-13C (A, B) and 1H-15N CP (C, D) with 13C or 15N detection. Simulation of 1H-13C or 15N CP transfer efficiency is shown in various conditions of different spinning frequencies (νR) equal to 125, 100, 80, 62.5, 40, 20 kHz. In the case
of simulation at νR=20kHz, an RF field of up to only 160 kHz was considered due to general probe limitation when operating typical
de-vices that spin at this frequency. A) Simultaneous 1H-13C/1H-15N CP with 13C detection as a function of ν
4
Dual channel (conventional) 1H-13C CP as a function of ν
1H and ν13C , C) Dual channel 1H-15N CP as function of ν1H and ν15N, D)
Simulta-neous 1H-13C/1H-15N CP with 15N detection as a function of ν
13C and constant ν1H and ν15N . In A) and D), a slight decrease (up to 8%) in
transfer efficiency is observed when the 15N or 13C RF reaches an effective simultaneous CP matching condition with the proton RF. These
conditions are indicated with red and blue dots, according to whether the simultaneous CP is a zero- or double-quantum condition, and labeled with the nucleus name (“C” or “N”).
Listing 1. Sample SIMPSON input for simulation of simultaneous CP (SIM-CP).
#1H-13C CP efficiency simulation as a function of 1H and 13C RF #for 7 spin system (Ca, Cb, N, NH, HA, HB HB')
#parametrs B0=800MHz RO=100kHz crysl_fle=rep168 gamma=17 #with dt=0.1 it is important for long pulse
#PPaluch CBMM PAN Lodz 2019 #PPaluch CNBCH UW Warszawa 2019 # [email protected] spinsys { # 1 2 3 4 5 6 7 # 1C1 2C2 3N3 4H4 5H5 6H6 7H7 # 1) C1 CA # 2) C2 CB # 3) N3 N # 4) H4 NH # 5) H5 HA # 6) H6 CB # 7) H7 CB' channels 13C 15N 1H nuclei 13C 13C 15N 1H 1H 1H 1H shift 1 0 0 0 0 0 0 shift 2 -20.0p 0 0 0 0 0 shift 3 0 0 0 0 0 0 shift 4 4.0p 0 0 0 0 0 shift 5 -0.5p 0 0 0 0 0 shift 6 -2.2p 0 0 0 0 0 shift 7 -2.2p 0 0 0 0 0 dipole 1 2 -2041.67 0 102.41 -87.463 dipole 1 3 981.8 0 113.86 153.22 dipole 1 4 -3178.8 0 137.43 148.67 dipole 1 5 -25134 0 5.1219 131.58 dipole 1 6 -2880.2 0 92.697 -62.075 dipole 1 7 -3039.6 0 84.796 -109.45 dipole 2 3 202.13 0 95.985 120.8 dipole 2 4 -1271.2 0 115.26 119.77 dipole 2 5 -3207 0 48.769 94.695 dipole 2 6 -24653 0 77.589 -23.695 dipole 2 7 -24683 0 60.422 -146.98 dipole 3 4 12939 0 171.41 102.23 dipole 3 5 1374.6 0 37.115 -25.169 dipole 3 6 309.25 0 81.753 -48.817 dipole 3 7 567.95 0 73.565 -79.622 dipole 4 5 -4712.4 0 27.139 -30.137 dipole 4 6 -2211.4 0 67.374 -49.978 dipole 4 7 -3301.1 0 58.021 -79.526 dipole 5 6 -7175.8 0 117.02 -61.512 dipole 5 7 -9219.2 0 111.54 -107.28 dipole 6 7 -21864 0 80.277 -177.13 } par { method dsyev proton_frequency 800e6 spin_rate 1.0e5 gamma_angles 17 np 1 sw spin_rate crystal_file rep168 start_operator I4x+I5x+I6x+I7x
5
detect_operator I1p verbose 0000 variable RF_H 0 variable RF_C 0 variable RF_N 0 ###### variable CT_us 300.0 variable RF_H_min 0.0 variable RF_H_max 240000.0 variable RF_H_step 240 variable RF_C_min 0.0 variable RF_C_max 240000.0 variable RF_C_step 240 } proc pulseq {} { global par maxdt 0.1set Tr [expr 1.0e6/$par(spin_rate)] set nTr [expr int($par(CT_us)/$Tr)] reset
pulse $Tr $par(RF_C) 0 $par(RF_N) 0 $par(RF_H) 0 store 1 reset prop 1 $nTr acq } proc main {} { global par foreach par(spin_rate) {100000.0 } {
set FileRe_Im_Abs [open "$par(name).res" w] for {set a 0} {$a<=$par(RF_H_step)} {incr a} {
set par(RF_H) [expr $par(RF_H_min)+$a*($par(RF_H_max)-$par(RF_H_min))/$par(RF_H_step)] for {set b 0} {$b<=$par(RF_C_step)} {incr b} {
set par(RF_C) [expr $par(RF_C_min)+$b*($par(RF_C_max)-$par(RF_C_min))/$par(RF_C_step)] set f [fsimpson]
set Sr [findex $f 1 -re] set Si [findex $f 1 -im]
puts $FileRe_Im_Abs "[expr $par(RF_H)/1.0e3] [expr $par(RF_C)/1.0e3] [expr $Sr] [expr $Si] [expr sqrt($Sr**2+$Si**2)]" funload $f } puts $FileRe_Im_Abs " " } close $FileRe_Im_Abs } }
6
Figure S3. Quantification of interference between 1H→15N and 1H→13C CP at 107 kHz MAS on a sample of uniformly 13C,15N-labeledmaltose binding protein. (A) 1D (H)NH experiment recorded with (in blue) and without (in black) simultaneous irradiation of 13C nuclei.
(B) 1D (H)CH experiment with a 13Cα-selective refocusing pulse recorded with (in blue) and without (in black) simultaneous irradiation of
15N nuclei. 15N and 13C RF irradiation was applied for the same time in all cases (800 µs).
Figure S4. Standard (sequential) CP conditions for 1H-13C (left) and 1H-15N CP (right) at 107 kHz MAS in a 0.7 mm Bruker HCN probe on a 800 MHz spectrometer. Signal intensity was evaluated by stepwise variation of 1H and either 13C or 15N RF strength during a fixed
contact time CP following the first 1H pulse in a 1D (H)CH or (H)NH experiment (“first FID”). The intensities along detected 1H
dimen-sion were summed over the aliphatic or amide 1H range. Zero-quantum (ZQ) and double-quantum (DQ) CP show opposite signs and are
shown in red and black, respectively. Red disks connected by a horizontal dashed line (i.e. at common 1H RF strength) indicate the optimal
7
B. Detailed RF pulse schem es
Figure S5. Radiofrequency (RF) pulse scheme for the “8-in-1” experiment. Heteronuclear cross-polarization (CP) transfers are shown as
either wide rectangular, trapezoid or tangential orange shapes simultaneously on two or three RF channels. RF strength, duration and de-tailed shapes for CP transfers are provided in Table S2. Solid and open pulses represent high-power 90° and 180° pulses, respectively. Open pulses marked with double star (**) denote composite 180° pulses 90x°180y°90x°, which were used to minimize signal losses on the
pathways other than the decoupled one. In our implementation (see Section J) these pulses are optional, and can be skipped for short evolu-tion times. Open bell shapes on 13C channels represent Q33 (for 13Cα and 13Cʹ′) and ReBURP4 (for 13Cβ) selective pulses. Pulse durations
and peak RF strength were 161.5, 178.5 and 960.9 µs and 20.43, 18.49 and 6.52 kHz for 13Cα, 13Cʹ′ and 13Cβ pulses respectively. Note that
the moderately selective 13Cα pulses affect both 13Cα and 13Cβ spins. Heteronuclear 1H decoupling during indirect evolution or J-transfer
periods is shown in hatched grey. Swept-TPPM5-61H decoupling with RF field of 10 kHz and pulse length of 25 µs was used. WALTZ-167
and DISPI-38 with RF strength of 10 and 20 kHz, and pulse lengths of 25 and 12.5 µs, were used for 15N and 13C decoupling during signal acquisition, respectively. The MISSISSIPPI water suppression,9 with duration τ
SAT of 200 ms and RF strength of 25.4 kHz, is shown as a
composite block of four solid and grey pulses. Relaxation-optimized 13Cα–13Cʹ′ J-transfer delays δ1 and δ2 were 4.2 and 4.3 ms,
respective-ly. They were derived from the formula: δ = ½ tan-1 (π J T
2’) / (π J), where T2’ denotes either the 13Cα or Cʹ′ refocused coherence lifetime
(estimated to 48 and 70 ms, respectively). 13Cα–13Cʹ′ J-coupling constant of 55 Hz was assumed. 13Cα evolution in t
2 (denoted t2B) was
performed in constant- or real-time, depending on whether t2B exceeded the relaxation-optimized transfer delay δ1 or the maximum transfer
time δ* = ½ (2J)-1. Namely, the delays δ
3a, δ3b, δ3c, δ3d were set to respectively δ1 – ½ t2B,¼ t2B + ½ (δ1 – pwCB), ¼ t2B + ½ (δ1 – pwCB) and
0 if t2B < 2(δ1 – pwCB); to respectively pwCB, ½ t2B, ½ t2B and 0 if 2(δ1 – pwCB) ≤ t2B < 2(δ* – pwCB); and to respectively pwCB, ½ t2B, δ* –
pwCB and ½ t
2B– (δ* – pwCB) for t2B ≥ 2(δ* – pwCB), where pwCB stands for the duration of 13Cβ-selective pulse. All pulses have phase x
unless indicated. The phase cycle was (for convenience the numbering of phases is consistent with pulse sequence code provided below): ϕ2 = {y, -y}, ϕ10 = {x, x, -x, -x}, ϕ15 = {x, x, -x, -x}, ϕ16 = {x, -x}, ϕ17 = y, ϕ18 = x, ϕ21 = x, ϕ24 = x, and ϕrec = {y, -y, -y, y}. Quadrature
detec-tion in the indirect dimensions was accomplished using the States-TPPI10 method by incrementing ϕ
2 and ϕ16 (in t1) and decrementing ϕ10
and ϕ15 (in t2), independently from t1 and t2 time incrementation. Additionally, a quarter spectral window upfield and downfield shift for
respectively 15N and 13Cα resonances, was implemented by incrementing ϕ
2 and ϕ16 in synchrony with t1 time incrementation, i.e. ϕ2 = {y,
-y} + 90° × ((t1 sw1) mod 4). The 15N offset was set to 117.5 ppm while the 1H offset was set on resonance with the H2O line (approx. 4.8
ppm). The 13C offset was set to the center of the 13Cα band (56.4 ppm) for the first and last CP transfer, and in-between the 13Cα and 13Cʹ′ regions (116.4 ppm) for the rest of the sequence (as indicated by horizontal arrows). Effectively, both t1 and t213Cα evolution is performed
off-resonance, and the extra acquired phase is compensated by the time-proportional phase incrementation on refocusing pulses with phas-es ϕ21 and ϕ24: ϕ21 = {x} + 180 * ΔΩ * t2, ϕ24 = {x} + 180 * ΔΩ * t1 (in degrees), where ΔΩ = ΩCα – Ω0 (in hertz). Also, all shaped 13C
pulses are performed off-resonance by a stepwise phase modulation with respective offset difference ΩCα – Ω0 = -60 ppm, ΩCʹ′ – Ω0 = 60
ppm or ΩCβ – Ω0 = -91 ppm (where Ω0 stands for the carrier offset). The 13C pulses for 15N-13Cα and 15N-13Cʹ′ CP transfers are performed
with relative offsets ΩCα – Ω0 – 60 ppm = -120 ppm and ΩCʹ′ – Ω0 + 60 ppm = +120 ppm, respectively. The additional ±60 ppm offset is to
minimize undesired 15N-13Cʹ′ and 15N-13Cα transfers during these CP transfers (these lossy transfers arise due to the direction of the 15N ramp enforced by other pathways). Zero phase alignment for the 13C pulses during 15N-13Cα and 15N-13Cʹ′ CP transfers was enforced at the
end and the beginning of the pulse, respectively. While this ensures the phase agreement for 13C pulses between these two CP transfers, a constant phase difference with respect to the 90° pulse before 15N-13Cα CP (causing a zero-order phase for 13Cα in ω
1), and with respect to
the 90° pulse after 15N-13Cʹ′ CP is generated (leading to the loss of signal). It is thus necessary to correct these phase shifts, e.g. by empiri-cally optimizing the phases ϕ16 and ϕ17, while a single pathway is selected (see Section J). In our experiment, the best values of 310° and
75° were found for ϕ16 and ϕ17, respectively. Additionally, as shown in Figure S6, among 8 recorded types of correlations there are four
pairs sharing the same frequency regions in ω1, ω2 and ω3dimensions (e.g. 13Cα(i–1)-15N(i)-1HN(i)and 13Cα(i)-15N(i)-1HN(i)). They can be
discriminated based on which term, i.e. either 15N or 13C, is present between the 15N-13Cα and 15N-13Cʹ′ CP transfers. Here, an extra 180° incrementation of phase ϕ18 is introduced as the innermost loop, and the interleaved data requires a linear combination (addition and
8
Figure S6. Scheme of 8 independent coherence transfer pathways recorded using the experiment described in Figure S5. Pathways
are illustrated as dashed lines superimposed onto a simplified pulse sequence scheme from Figure S5. For clarity, the scheme was
separated into 4 classes of pathways with respect to coherence response to the
15N-
13Cα and
15N-
13Cʹ′ CP transfers: (a) coherence
transferred in both CP steps; (b) coherence transferred only in
15N-
13Cα CP, orphan coherence utilized after
15N-
13Cʹ′ CP; (c) orphan
coherence utilized after
15N-
13Cα CP, transferred coherence during
15N-
13Cʹ′ CP; (d) orphan terms from both
15N-
13Cα and
15N-
13Cʹ′
CPs used. The types of obtained correlations are provided in bottom-right corner of each panel. “–“ and “+” signs denote whether
the particular correlation is observed in the “difference” or “sum” data set after a linear combination of interleaved FIDs. The “+”
pathways are present as
13Cα coherence just after
15N-
13Cα CP and insensitive to
15N 90° pulse phase ϕ
18
, while “–“ pathways are
stored as
15N coherence at this point, thus undergo a phase change according to ϕ
18
. Direct interresidue
1H
N-to-
1H
Nand
1Hα-to-
1Hα
correlations (class “a”) utilize the best possible signal, while intraresidue (class “b”) and interresidue (class “c”)
15N-
13Cα-
1Hα and
13Cα-
15N-
1H
Npathways make use of residual signal in one of
15N-
13C CP. Class “d” pathways are doubly attenuated, however, these
pathways are not useful for sequential assignment (byproducts).
9
Figure S7. RF pulse scheme for the simultaneous dipolar 13C,15N-HSQC experiment. The same convention for pulses and CP steps as inFigure S5 is used. RF strength, duration and detailed shapes for CP transfers are provided in Table S2. The phase cycle was: ϕ1 = {4(y),
4(-y)}, ϕ2 = {y, y, -y, -y}, ϕ4 = {x, x, -x, -x}, ϕ7 = {y, -y}, ϕ11 = {8(y), 8(-y)}, ϕ16 = {x, -x}, ϕ17 = y, ϕ18 = x, ϕ21 = x, ϕ24 = x, and ϕrec = {y, -y, -y,
y}. Quadrature detection in the indirect dimension t1 (t1A for 15N and t1B for 13C) was accomplished using States-TPPI10 method by
simulta-neous incrementation of ϕ2 and ϕ4. Offsets for 13C and 15N channels were set to 40.0 and 117.5 ppm, while 1H offset was set on resonance
with H2O line (approx. 4.8 ppm). Open bell shapes on 13C channels represent Q3313Cʹ′-selective pulses of 178.5 µs duration and peak RF
strength of 18.49 kHz.
Figure S8. RF pulse scheme for the simultaneous (H)CANH and (H)NCAHA experiment (“intra-2in1”). The same convention for pulses and CP steps as in Figure S5 is used. Coherence transfer pathway is shown as dashed orange (for (H)CANH) or blue lines (for (H)NCAHA), and CP and 90° and 180° pulses are colored accordingly. RF strength, duration and detailed shapes for CP transfers are provided in Table S2. All pulses have phase x unless indicated. The phase cycle was: ϕ3 = {x, -x}, ϕ4 = {y, -y}, ϕ5 = x, ϕ6 = y, ϕ8 = {x, x, -x,
-x}, ϕ9 = {4(x),4(-x)}, ϕ10 = y, ϕ11 = y, ϕ12 = x, ϕ18 = {x, y}, ϕ19 = {x, x, y, y} and ϕrec = {2(y, -y, -y, y)}. The minimum phase cycle length is
4 scans. Quadrature detection in the indirect dimensions t1 (t1A for 15N and t1B for 13C) and t2 (t2B for 15N and t2A for 13C) was accomplished
using States-TPPI10 method by simultaneous decrementation of ϕ
5 and incrementation of ϕ6 (in t1) and by simultaneous decrementation of
ϕ11 and incrementation of ϕ12 (in t2). Offsets for 13C and 15N channels were set to 56.4 (center of 13Cα region) and 117.5 ppm, while 1H
offset was set on resonance with H2O line (approx. 4.8 ppm). Open bell shapes on 13C channels represent Q3313Cα and 13Cʹ′-selective
pulses of durations of were 161.5 and 178.5 µs and peak RF strength of 20.43 and 18.49 kHz for 13Cα and 13Cʹ′ pulses respectively. 13
Cʹ′-selective pulses were performed off-resonance by phase modulation corresponding to +120 ppm with respect to 13C offset. 13C pulse during 13Cα-15N CP can be performed on-resonance (with no phase modulation), however, a better selectivity of 15N→13Cα transfer is achieved
(for (H)NCAHA pathway) if additional –60 13C ppm offset is applied (effectively, the pulse is performed at 56.4 – 60 = –3.6 ppm). While
it minimizes the competitive 15N→13Cʹ′ transfer, a constant phase difference acquired over this pulse (w.r.t. the enforced zero phase at the
10
Figure S9. RF pulse scheme for the simultaneous (H)CA(CO)NH and (H)N(CO)CAHA experiment (“inter-2in1”). The same conventionfor pulses and CP steps as in Figure S5 is used. Coherence transfer pathway is shown as dashed red (for (H)CA(CO)NH) or magenta lines (for (H)N(CO)CAHA), and CP and 90° and 180° pulses colored accordingly. RF strength, duration and detailed shapes for CP transfers are provided in Table S2. Open bell shapes on 13C channels represent Q33 (for 13Cα and 13Cʹ′) and ReBURP4 (for 13Cβ) selective pulses. Pulse
durations and peak RF strength were 161.5, 178.5 and 960.9 µs and 20.43, 18.49 and 6.52 kHz for 13Cα, 13Cʹ′ and 13Cβ pulses respectively.
Relaxation-optimized 13Cα–13Cʹ′ J-transfer delays δ
1 and δ2 were 4.3 and 4.2 ms, respectively. They were derived from the formula: δ = ½
tan-1 (π J T
2’) / (π J), where T2’ denotes either the 13Cα or Cʹ′ refocused coherence lifetime (estimated to 48 and 70 ms, respectively). 13Cα– 13
Cʹ′ J-coupling constant of 55 Hz was assumed. 13Cα evolution in t2 (denoted t2B) was performed in constant- or real-time, depending on
whether t2B exceeded the relaxation-optimized transfer delay δ2 or the maximum transfer time δ* = ½ (2J)-1. Namely, the delays δ2a, δ2b, δ2c,
δ2d were set to respectively δ2 – ½ t2B,¼ t2B + ½ (δ2 – pwCB), ¼ t2B + ½ (δ2 – pwCB) and 0 if t2B < 2(δ2 – pwCB); to respectively pwCB, ½ t2B,
½ t2B and 0 if 2(δ2 – pwCB) ≤ t2B < 2(δ* – pwCB); and to respectively pwCB, ½ t2B, δ* – pwCB and ½ t2B– (δ* – pwCB) for t2B ≥ 2(δ* – pwC),
where pwCB stands for the duration of 13Cβ-selective pulse. All pulses have phase x unless indicated. The phase cycle was: ϕ
3 = {x, -x}, ϕ5
= {y, -y}, ϕ7 = x, ϕ8 = x, ϕ10 = {x, y}, ϕ12 = {x, x, -x, -x, -x, -x, x, x}, ϕ14 = y, ϕ15 = {x, x, -x, -x}, ϕ16 = x, ϕ17 = -y, ϕ29 = y, and ϕrec = {y, -y, -y,
y, -y, y, y, -y}. The minimum phase cycle length is 4 scans. Quadrature detection in the indirect dimensions t1 (t1A for 13Cαand t1B for 15N)
and t2 (t2A for 15N and t2B for 13Cα) was accomplished using States-TPPI10 method by the simultaneous incrementation of ϕ5 and ϕ7 and
decrementation of ϕ3 (in t1) and by the simultaneous decrementation of ϕ14 and ϕ17 (in t2). 15N offset was set to 117.5 ppm while 1H offset
was set on resonance with H2O line (approx. 4.8 ppm). 13C offset was set to in-between of 13Cα and 13Cʹ′ regions (116.4 ppm) for the entire
experiment except the Cʹ′-15N CP where it was on-resonance with Cʹ′ (176.4 ppm) and the final 13Cα-1Hα CP where it was at the center of 13Cα band (56.4 ppm) (offset changes on the 13C channel are indicated by horizontal arrows). Effectively, both t
1 and t213Cα evolution is
performed off-resonance, and the extra acquired phase is compensated by the time-proportional phase incrementation on refocusing pulses with phases ϕ8 and ϕ16: ϕ8 = {x} – 180 * ΔΩ * t1, ϕ16 = {x} – 180 * ΔΩ * t2 (in degrees), where ΔΩ = ΩCα – Ω0 (in hertz). Also, all shaped 13C pulses are performed off-resonance by a stepwise phase modulation with respective offset difference Ω
Cα – Ω0 = -60 ppm, ΩCʹ′ – Ω0 =
60 ppm or ΩCβ – Ω0 = -91 ppm (where Ω0 stands for the carrier offset at 116.4 ppm). 13C pulse during 1H-13Cʹ′ CP is performed
off-resonance with respective phase modulation, and zero phase alignment at the end of the pulse is enforced. 13C pulse during 13Cʹ′-15N CP can
be performed on-resonance (with no phase modulation), however, a better selectivity of 15N→13Cʹ′ transfer is achieved (for (H)N(CO)CAHA pathway) if additional ~60 13C ppm offset is applied (effectively, the pulse is performed at 176.4 + 60 = 236.4 ppm).
While it minimizes the competitive 15N→13Cα transfer, a constant phase difference acquired over this pulse (w.r.t. the enforced zero phase at the beginning of this pulse) must be compensated by ϕ29. Empirically, in our conditions we found the best value of 50°.