HAL Id: hal-00534900
https://hal.archives-ouvertes.fr/hal-00534900
Submitted on 13 Dec 2019
HAL is a multi-disciplinary open access
archive for the deposit and dissemination of
sci-entific research documents, whether they are
pub-lished or not. The documents may come from
teaching and research institutions in France or
abroad, or from public or private research centers.
L’archive ouverte pluridisciplinaire HAL, est
destinée au dépôt et à la diffusion de documents
scientifiques de niveau recherche, publiés ou non,
émanant des établissements d’enseignement et de
recherche français ou étrangers, des laboratoires
publics ou privés.
High-pressure behavior of polyiodides confined into
single-walled carbon nanotubes: A Raman study
Laurent Alvarez, Jean-Louis Bantignies, Rozenn Le Parc, Raymond Aznar,
Jean-Louis Sauvajol, Alexandre Merlen, D. Machon, A. San Miguel
To cite this version:
Laurent Alvarez, Jean-Louis Bantignies, Rozenn Le Parc, Raymond Aznar, Jean-Louis Sauvajol, et
al.. High-pressure behavior of polyiodides confined into single-walled carbon nanotubes: A Raman
study. Physical Review B: Condensed Matter and Materials Physics (1998-2015), American Physical
Society, 2010, 82 (20), pp.205403. �10.1103/PhysRevB.82.205403�. �hal-00534900�
High-pressure behavior of polyiodides confined into single-walled carbon nanotubes:
A Raman study
L. Alvarez,1 J.-L. Bantignies,1R. Le Parc,1R. Aznar,1J.-L. Sauvajol,1A. Merlen,2D. Machon,3and A. San Miguel3
1LCVN, University Montpellier 2, UMR 5587, 34095 Montpellier Cedex 05, France 2IM2NP, Université du Sud Toulon-Var, UMR 6242, BP 20132, F-83957 La Garde Cedex, France 3Laboratoire PMCN, UMR 5586, Université Lyon 1, CNRS–Université de Lyon, Villeurbanne 69622, France
共Received 22 July 2010; revised manuscript received 23 September 2010; published 4 November 2010兲
The high-pressure behavior of polyiodides confined into the hollow core of single-walled carbon nanotubes organized into bundles has been studied by means of Raman spectroscopy. Several regimes of the structural properties are observed for the nanotubes and the polyiodides under pressure. Raman responses of both compounds exhibit correlations over the whole pressure range共0–17 GPa兲. Modifications, in particular, take place, respectively, between 1 and 2.3 GPa for polyiodides and between 7 and 9 GPa for nanotubes, depending on the experiment. Differences between one experiment to another are discussed in terms of nanotube filling homogeneity. These transitions can be presumably assigned to the tube ovalization pressure and to the tube collapse pressure. A nonreversibility of several polyiodide mode modifications is evidenced and interpreted in terms of a progressive linearization of the iodine polyanions and a reduction in the charged species on pressure release. Furthermore, the significant change in the mode intensities could be associated to an enhancement of lattice modes, suggesting the formation of a new structure inside the nanotube. Changes in the nanotube mode positions after pressure release point out a decrease in the charge transfer in the hybrid system consistent with the observed evolution of the charged species.
DOI:10.1103/PhysRevB.82.205403 PACS number共s兲: 78.30.Na, 78.70.En
I. INTRODUCTION
Single-walled carbon nanotubes 共SWCNTs兲 represent ideal nanoconfinement systems owing to their one-dimensional 共1D兲 hollow core with diameter comprised be-tween 0.7 and 2 nm.1,2 The introduction of foreign species into these 1D nanocavities leads to novel and exciting effects both for the filling entities and the host carbon matrix.2–4The
physical properties of the confined material can differ signifi-cantly from those of the bulk.2 In fact, original quantum
effects can arise from the low-dimensional confinement im-posed by the nanotubes as well as by guest-host interactions. For instance, Guan et al.5suggest the formation of a really
new iodine phase depending on the tube diameters and due the confinement effect. Furthermore, reducing the tube diam-eters could allow to synthesize a linear atomic wire of iodine, which would be one ultimate quantum object.5
Iodine is a typical p-type dopant very stable inside SWCNT.5–8It gives rise to charge-transfer complexes,
lead-ing to In−m anions 共polyiodides兲 and SWCNT cations. Very
recently, it has been shown that a temperature treatment can allow the tuning of charge transfer on iodine intercalated nanotube.8 Thus, controlling the thermodynamic conditions could allow modifying the nanotube transport properties by switching the charge transfer on the tube, opening a way of getting tunable electronic properties of air stable nanocom-pounds. However, little is known about the physical and es-pecially structural properties of the inserted iodine species. The structural and electronic properties of the confined poly-iodides into SWCNT 共I@SWCNT兲 have been investigated by different experimental methods. Transmission electron microscopy共TEM兲 investigations report the formation of ei-ther helicoidal chains5,6or new crystalline structures
depend-ing on the tube diameter.6By contrast, Raman spectroscopy
measurements suggest the presence of short polyiodide chains 共I3− and I5−兲 in SWCNT 共Refs. 9–13兲 in good
agree-ment with typical iodine charge-transfer complexes in other organic systems.14–19 Furthermore, extended
x-ray-absorption fine structure 共EXAFS兲 studies on I@SWCNT support the presence only of disordered I5−anion chains.12In
summary, the precise structural and electronic properties of the polyiodides within SWCNT still remain under debate. In this context, the application of high pressure, which allows the continuous modification of host-guest interactions, con-stitutes a powerful tool not only for clarifying the ambient conditions of the guest species under nanoconfinement but also to explore new opportunities arising from the modifica-tions caused by these modulated interacmodifica-tions.
Iodine molecule共I2兲 and the Lewis base donors I−and I 3 −
can be regarded as the main building blocks of polyiodides.16–18Polyiodides do not exist as discrete entities
but are always a combination of I2molecules and I−and/or I3−
anion chains.14,18 They can be described by the following
formula: mI2+ nI−→I共2m+n兲n− leading to several possible
struc-tures. For instance, I3−might be a three-body system共I-I-I, I3− entity兲 or an asymmetric anions consisting in I2 molecule weakly interacting with I− ion.14–19 In the same way, an I
5 −
anion can be described as an I3− entity associated to an I2
molecule共I3−· I2兲 or as two I2molecules in interaction with an
I−ion 共2I2· I−兲. In addition, polyiodides can display several
shapes such as linear, V or L shaped. Table I reports the Raman mode frequencies for the main short In
−m
chains re-ported in the literature.14–19
Under high-pressure halogens are known to follow sev-eral phase transformations including a change on the intra-bond characteristics corresponding to a loss of molecular character which has been identified in bromine at 25 GPa.20 The Raman features associated to the 25 GPa phase
transi-tion observed in bromine are found at about 10 GPa in iodine.21 This transition is followed by a incommensurable
modulated phase21,22 and by the dissociation of the diatomic
molecule at higher pressures.23However, the pressure
evolu-tion of the polyiodide species will be also affected by the evolution of the confinement volume of the SWCNT under high pressure.
Only few papers dedicated to polyiodide studies under pressure have been published.11,24Sengupta et al. suggest the
breaking of pentaiodide into I2 and triodide species at low pressure共0.2 GPa兲 in polymers doped with iodine in aqueous solution. Venkateswaran et al. used iodine in a vapor phase to dope SWCNT. No pressure dependence of the In−structural properties is reported. They analyzed their results in terms of different intercalation sites within bundles of SWCNT under pressure.
By contrast, when doping is performed in the liquid phase, recent papers clearly showed that iodine species are located inside the hollow core of SWCNT.5,6 In the present work, using molten iodine for the doping, we explore the structural transformations of confined polyiodides into SWCNT under pressure. Raman spectroscopy investigations are carried out between 0 and 17 GPa.
II. EXPERIMENTAL
Electric arc discharge commercial MER corporation 共http://www.mercorp.com/兲 highly purified SWCNT were outgassed and annealed at 250 ° C for 24 h under dynamical vacuum to remove adsorbed water. Sample characterizations by TEM, x-ray and neutron diffraction reveal a high degree of purity and homogeneity, and a size of bundles around 50 tubes. The diameter distribution is centered at 1.3 nm with a full width of 0.2 nm. A fit of the bare SWCNT diffraction peaks yields a distance between two adjacent nanotubes in a bundle of 17⫾1 Å. Due to the purification process these tubes have many defects and are opened. Iodine doping of the carbon materials is then achieved by immersing the na-nomaterials in molten iodine in evacuated quartz tubes at a temperature of 140 ° C for 3 days to perform a saturation doping. The excess iodine is removed by the cold point method and by washing with ethanol afterwards.
Experiments are performed on a Jobin Yvon T 64000 micro-Raman spectrometer. The Raman spectra are recorded with the 514.5 nm excitation wavelength. The laser power
used was adjusted to 0.7 mW with a spot diameter of about 3 m using a 50⫻ objective. Pressure experiments up to 17 GPa are carried out with a diamond-anvil cell using argon as transmitting medium and the ruby fluorescence method for pressure calibration. Four different samples are investigated in separated pressure cell loadings. Since data from the dif-ferent experiments are comparable, the result of a single rep-resentative pressure experiment is presented herein.
III. RESULTS
Figure 1 displays normalized Raman spectra of the raw nanotubes共line兲 and the iodine intercalated nanotubes 共open circles兲 which exhibit two main regions. The first one is around 1600 cm−1 and assigned to the tangential modes 共G
band兲 of SWCNT. The G band profile clearly corresponds to semiconducting tubes, as expected at this wavelength共541.5 nm兲 for such tube diameters 共around 1.3 nm兲. This band upshifts after intercalation of about 15 cm−1. As
encapsula-tion of various noncharged species having different geom-etries 共C60, conjugated oligomers, etc.兲 inside SWCNT does not alter the G band position, we assign this upshift to a charge transfer between iodine and nanotubes.7,9
The second region共between 100 and 250 cm−1兲 strongly
differs between the pristine and the intercalated tubes. In the case of raw tubes, the radial breathing modes 共RBMs兲 are visible with two modes at 187 and 207 cm−1. The iodine intercalated tubes exhibit two broad and prominent bands 共labeled A and B兲, at lower frequencies 共109 and 174 cm−1兲,
which can be either the signature of short polyiodide chains9–18 共Table I兲 and/or RBM of SWCNT. However the
intensity ratio between the low-frequency modes and the G band is not consistent with usual results obtained on pristine nanotubes. In addition, previous Raman measurements on multiwalled nanotubes 共without RBM兲 clearly showed the appearance of both A and B bands after iodine intercalation.13Consequently, these modes can be
unambigu-ously assigned to the presence of polyiodides 共In−mchains兲. Raman studies on iodine intercalated organic compounds usually report the presence of only two modes located
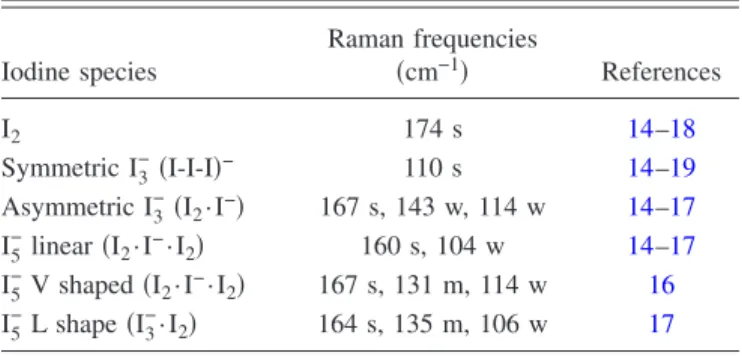
TABLE I. Raman mode frequencies for main short polyiodides reported from literature. s = strong, m = medium, and w = weak.
Iodine species Raman frequencies 共cm−1兲 References I2 174 s 14–18 Symmetric I3−共I-I-I兲− 110 s 14–19 Asymmetric I3−共I2· I−兲 167 s, 143 w, 114 w 14–17 I5−linear共I2· I−· I 2兲 160 s, 104 w 14–17 I5−V shaped共I2· I−· I2兲 167 s, 131 m, 114 w 16 I5−L shape共I3−· I2兲 164 s, 135 m, 106 w 17
FIG. 1. Normalized Raman spectra recorded at 514.5 nm of raw SWCNT共line兲 and I@SWCNT 共open circles兲 at room pressure.
ALVAREZ et al. PHYSICAL REVIEW B 82, 205403共2010兲
around 109 and 174 cm−1, assigned to the vibrations of I3− and I5−polyiodides, respectively.9–13However, the situation is
much more complex as we will observe later on by fitting the data 共Fig. 3, bottom left兲. It turns out that seven peaks lo-cated at 175, 169, 160, 146, 129, 111, and 104 cm−1 are required to fit properly the spectrum, featuring the presence of various polyiodide species in our samples.
Let us now discuss the assignment of the different low-energy modes. The mode at 175 cm−1is usually assigned to the vibration of elongated di-iodine interacting with donors. Solid iodine exhibits a Raman mode at 180 cm−1 but, as I
2
becomes coordinated to a donor, the force constant is re-duced and the mode moves toward lower wave number 共around 175 cm−1兲.14–18 From the inspection of TableI, we
can assume that the remaining peaks contributing to the “B band” located between 120 and 170 cm−1can be associated
to In−species of different geometries共linear, V or L shaped兲. In the case of the “A band” the peak around 110 cm−1can arise either from I3− 共symmetric or asymmetric兲 or from I5− chains共TableI兲. The classical attribution is the symmetric I3−
anion with Raman band at 110 cm−1 which should be very intense. In our sample, this A band intensity is quite weak with respect to the B band intensity indicating that the pres-ence of symmetric I3−anion is very small or negligible. This is in fact, confirmed by EXAFS investigations of I@SWCNT which clearly show no signature of the presence of the ex-panded I-I distance of the symmetric I3−chains.12 In
conclu-sion, the “A band” can be assigned either to I5− anions or asymmetric I3−共see TableI兲. Furthermore, the presence of I5−
polyiodide can also account for the weak peak observed around 104 cm−1.14–17Another possible assignment is lattice
librational modes that are observed for iodine single crystal in a frequency range around 110 cm−1.25,26
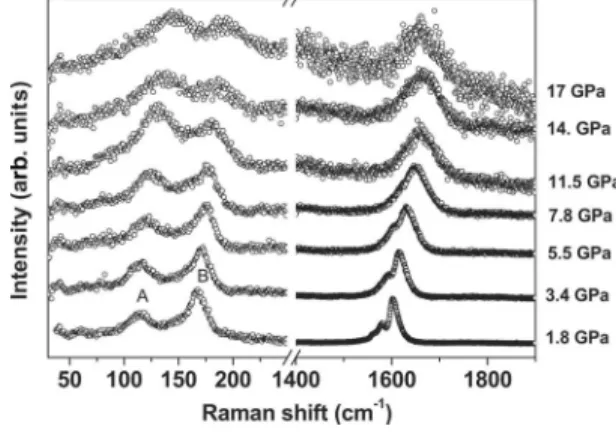
Figure2 displays Raman profiles of our I@SWCNT as a function of the applied pressure. The left part concerns the low-frequency range where the modes corresponding to the iodine chains are observed. Both bands upshift upon pressure and we can also observe a change in the relative intensity of features A and B between 7.8 and 11.5 GPa. It is worth mentioning that our data are surprisingly very different from
those in Ref.11共iodine intercalated nanotubes兲 but similar to
those of Ref. 24共iodine intercalated polyvinyl alcohol兲. We
note that the position of the A and B bands, as well as their pressure evolution, clearly differ from the case of pristine iodine, as an additional proof of the intercalation process.21
The right part of Fig. 2 displays the tangential G modes of SWCNT. The pressure clearly leads to a strong modification of the G band profiles. The peaks become progressively broader under pressure. In addition, without normalization, a progressive decrease in the associated intensities is exhibited 共not shown兲. The loss in intensity is probably due to a loss of the resonance conditions for SWCNT. A similar behavior is generally observed in empty SWCNT.27
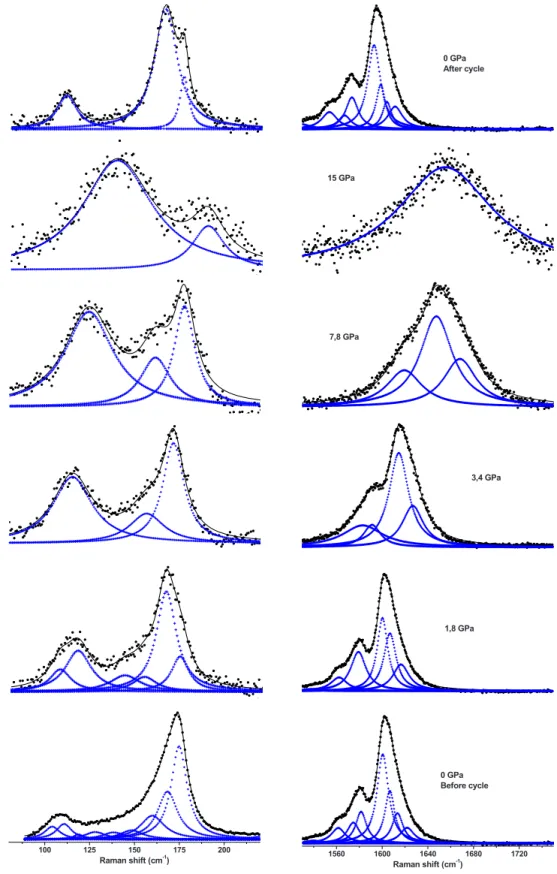
Figure 3 exhibits the fits of the iodine共left part兲 and the SWCNT 共right part兲 modes for some specific values of ap-plied pressure. To follow the peak evolutions, we have to keep in mind that the mode upshift under pressure as evi-denced on Fig.2. The very first pressure effect is to reduce the number of peaks, as observed between 0 and 3.4 GPa. In particular, at 3.4 GPa, the peak at 175 cm−1, assigned to the stretching of I2 molecules in interaction has disappeared.
This change is concomitant with an increase in the intensity of the peak located below 110 cm−1. Increasing the pressure
up to 3.4 GPa induces the merging of the two lowest fre-quencies modes of the A band, giving rise to a single and quite intense peak around 115 cm−1.
Furthermore, some more peaks on the low-frequency side of the B band have disappeared, emphasizing the strong modifications of the polyiodide structural properties. The relative intensity of the main modes共115 and 172 cm−1兲 has
significantly changed with respect to the spectrum at room pressure, meaning that the intensity of the mode located at 115 cm−1increases much more quickly than the peak inten-sity at 172 cm−1. From 3.4 to 15 GPa, the most important change concerns the relative intensity of the remaining peaks. At 12.2 GPa 共not shown兲, there are only two peaks left and the intensities keep changing drastically. At 15 GPa, the peak located at the lowest frequency is much more in-tense than the other one. There is no significant change by increasing the pressure up to 17 GPa. Finally, back to the room pressure, only three peaks 共176, 166, and 111 cm−1兲
are observed. The profiles of the Raman spectra are rather different before and after the cycle, meaning that irreversible significant modifications of the polyiodide structural proper-ties take place. Another important point concerns the polyio-dide peaks which are much less intense after the pressure cycle with respect to the G band intensity. This indicates dramatic changes in the charged species, leading to a de-crease in the charge transfer between the iodine and the nanotubes, in agreement with the G band downshift. For SWCNT, most of the peaks of the G band progressively van-ish under pressure. At 15 GPa, only one peak is required to fit properly the data. However, unlike the polyiodide modes, all the peaks共eight兲 are recovered back to the normal condi-tions, meaning that the modifications are nearly fully revers-ible for SWCNT. In fact, there is a difference concerning the peak positions. Indeed, all the peaks are downshifted 共be-tween 7 and 11 cm−1 depending on the peak兲 back to the ambient pressure with respect to the very first spectrum be-fore the cycle. In this case, the peak positions are very close
FIG. 2. Selected normalized Raman spectra of I@SWCNT un-der pressure 共from 1.8 to 17 GPa兲. Two regions can be distin-guished: the low-energy one with peaks labeled A and B which correspond to polyiodide modes and the high-energy region with the SWCNT G bands.
共1596 cm−1兲 to those measured in the pristine nanotubes
共1592 cm−1兲. This behavior supports a drop in the charge
transfer between iodine species and SWCNT after the cycle, consistent with the important decrease in the polyiodide peak intensities.
In Fig.4are reported the positions of peaks associated to iodine chains 共below 200 cm−1兲 together with the G band
position of I@SWCNT 共above 1550 cm−1兲 under pressure. All the modes reported are derived from the fits displayed on Fig.3. Both polyiodide and SWCNT modes clearly exhibit at least two regimes. For polyiodide species, a clear transition between two regimes occurs around 2.3 GPa and is evi-denced by a merging and/or a disappearance of few modes together with a change in the Raman band pressure depen-dences. The second transition around 9⫾1 GPa concerns the SWCNT and leads to significant changes in the Raman mode pressure dependences. At the first sight, the pressure dependence of the polyiodide modes does not look affected by the SWCNT transition. For SWCNT, between ambient pressure and 9 GPa, an important upshift of the SWCNT G band 共around 8⫾2 cm−1/GPa depending on the peak
stud-ied兲 is observed. Beyond 9 GPa, one of the G band peaks disappears and the positions of the two others are rather con-stant. At 15 GPa, only one peak is observed. This behavior displaying two regimes under pressure has been already ob-served in raw SWCNT28 as well as in SWCNT filled with C70fullerenes29and in double-well carbon nanotubes.30Both
experiments and calculations suggest to associate this behav-ior to a collapse which is defined here as a flattening or a transformation to peanutlike nanotube cross section 共see schematic above Fig. 4兲. The collapse is preceded by the
ovalization of carbon nanotubes at lower pressures. Consid-ering the diameter of our tubes, ovalization is typically ob-served between 1 and 3 GPa and progress continuously up to the collapse pressure. Based on polyiodide Raman mode modifications, we suggest that ovalization takes place around 2.3 GPa and progress up to the collapse transition which takes place at 9⫾1 GPa. It is noteworthy that this transition around 9 GPa is concomitant with a change in the evolution of the relative intensity of the A and B bands in the low frequency range, assigned to the In−mchains fingerprints共Fig.
2兲. To emphasize this point, the relative intensity of both
bands 共integrated intensity of band A over integrated inten-sity of band B, triangles兲 under pressure is reported on Fig.5
together with the frequency of the more intense SWCNT G peak 共circles兲. We can notice a clear relationship in both behaviors as a function of the pressure applied. Indeed, the intensity ratio slightly increases during the ovalization pro-cess, from ambient pressure to 9 GPa. After the nanotube collapse, there is a significant change in the intensity ratio evolution, meaning that the structural transformations of the polyiodides are favored after the nanotube collapse. Thus, the band positions associated to the iodine species do not look affected by the SWCNT transition according to the pressure dependence of the frequencies. By contrast, the in-tensity ratio is very sensitive to the SWCNT collapse.
IV. DISCUSSION
We must first mention high-pressure experiments per-formed on pristine SWCNTs coming from exactly the same
sample source.27,31Results mainly show that at an excitation
wavelength of 541.5 nm with argon as pressure-transmitting medium, no phase transition is observed on the G band po-sition up to 40 GPa.31By contrast, other experiments display
transition around 11 GPa.27 In fact, such a transition is not
systematically observed and when it is, the transition pres-sure values vary between 10 and 15 GPa, depending on sample inhomogeneities or differences in the experimental protocols.27 It has been recently shown that the nanotube
homogeneous filling can dramatically stabilize carbon nano-tubes toward the collapse pressure while inhomogeneous fill-ing can play the reverse role.32 In the case of open-ended SWCNT similar to the ones used in our study, the collapse pressure has been observed from 11 GPa in some cases and in others not observed even up to 40 GPa or higher, which probably can be related to the sample’s argon filling degree and homogeneity. As mentioned in the experimental section, we performed our experiment on iodine inserted SWCNTs several times and we found out a reproducible behavior, in particular, concerning the correlation between tube and poly-iodide responses. However, pressures at which the modifica-tions take place differed from one experiment to another 共from 7 to 9 GPa兲, which probably indicate differences in iodine filling or mixtures or argon/iodine filling.
As previously shown, pressure strongly affects the poly-iodide vibrational properties since we can observe the disap-pearance of many modes between ambient pressure and 3.4 GPa共110, 129, 146, and 175 cm−1兲 together with an inten-sity inversion between the bands A and B共Fig.3兲. Thus, one
of the very first effects of the pressure seems to be the trans-formation of L- or V-shaped polyiodides into linear chains 共Table I兲, accounting for the disappearance of few modes
共129 and 146 cm−1兲 observed at 2.5 GPa 共Fig. 4兲. Between
ambient pressure and 1.8 GPa, a progressive decrease in the peak intensity at 175 cm−1 is concomitant with an increase
in the peak intensity at 117 cm−1. One possible explanation
is the decomposition of I2molecules into I3−and/or I−and I+
ions as proposed by Corban et al.33At 3.4 GPa, both
contri-butions have vanished, suggesting the decomposition of both I2and symmetric I3
−
species.
Further evolutions of the Raman spectra at higher pres-sure can be interpreted with two possible scenarios detailed below. The first possible scenario to account for our data is the following: at 3.4 GPa, there is only one peak left into the A band at 115 cm−1. According to TableI, this feature cor-responds to the symmetric I3−species fingerprint共taking into account the pressure induced shift兲. Since the A over B bands intensity ratio increases, one possible assumption is a trans-formation of I5−polyiodides into I3−chains. The modification of the geometry and volume defined by the nanotubes and their progressive ovalization should account for these changes.
Such a scenario has been already used to explain Raman results obtained on polyiodides in poly共vinyl alcohol兲 films.24 However, this scenario is not fully satisfactory.
In-deed, the symmetric I3− chain is expected to have covalent bonding,17 so that the peak at 110 cm−1 should remain
in-tense back to the ambient conditions, unlike our Raman re-sults. In addition, after releasing the pressure, a peak at 175 cm−1 is observed, suggesting that I
2 molecules are
ALVAREZ et al. PHYSICAL REVIEW B 82, 205403共2010兲
formed again. A similar behavior has been already observed in iodine encapsulated SWCNT under temperature treatment and has been interpreted by structural conversion of polyio-dides into molecular iodine.8However, since our Raman data
show that the peak of the iodine species located at the lowest frequency is a bit more intense and narrower after the pres-sure treatment共Fig.3兲, it is probable that few symmetric I3−
chains are nevertheless formed under pressure.
100 125 150 175 200 Raman shift (cm-1) 1560 1600 1640 1680 1720 Raman shift (cm-1) 0 GPa Before cycle 1,8 GPa 7,8 GPa 15 GPa 0 GPa After cycle 3,4 GPa
FIG. 3. 共Color online兲 Normalized Raman modes 共=514.5 nm兲 of polyiodides 共left兲 and SWCNT 共right兲 as a function of the pressure applied共from bottom to top: 0, 1.8, 3.4, 7.8, 15, and 0 GPa after the cycle兲. Black circles correspond to the experimental data, straight lines correspond to the total fit, and blue crosses are the different peaks used in the fit.
Another possible scenario would consist in considering the A band共around 110 cm−1at ambient pressure兲 as lattice
librational modes as observed in iodine single crystal.25,26
Within this assumption, the huge increase in the intermolecu-lar mode intensity共A band兲 with respect to the intramolecu-lar ones共B band兲 is assigned to the increase in the interaction between polyiodides associated to an electronic rearrange-ment. As the pressure increases, the intermolecular or inter-polyiodide interaction is getting more and more important with respect to the intramolecular ones, leading to a charge delocalization outside the iodine species, giving rise to a huge increase in the intensity ratio between the lattice and the intramolecular modes. This mechanism is described in iodine single crystal as metallization transition under pressure.25,26 This scenario is consistent with the intensity
ratio evolution reported on Fig. 5 and correlated with the transition regime of SWCNT. Thus, the formation of a new iodine structure would be facilitated by the collapse of the tubes. Such a new structure has been already suggested in SWCNT from TEM investigations, even at room pressure, depending on the tube diameter.5Back to the ambient
pres-sure, there is no longer intermolecular interaction and the charge is again localized on “isolated” polyiodides account-ing for the modifications observed by Raman spectroscopy 共Fig.3兲.
Finally, if we consider our data after pressure release, a decrease in the amount of polyiodides signal is accompanied by a reduction in the charge amount transferred to the nano-tube. This could be explained by a scenario in which the collapsed tube bundle geometry combined with probable
ar-gon intrusion inside the tubes could lead to the progressive extraction of iodine from inside the tubes. Under high pres-sure, the strong nanoconfinement imposed by the collapsed geometry inside and outside the tubes would lead then to the observed tendency to polyiodide linearization. On pressure release, the iodine species found outside the tubes will be able to find a new equilibrium form leading to a reduction in charge transfer to the tubes. In order to go further in our understanding, x-ray absorption near-edge structure and EXAFS investigations under pressure are in progress to get some additional information on both electronic structural properties of iodine species.
V. CONCLUSION
We have investigated the pressure-induced effect on io-dine intercalated single-walled carbon nanotubes using Ra-man spectroscopy. The pressure allows modifying the charge transfer in the hybrid system. Both behaviors of nanotubes and polyiodides are strongly correlated and display several regimes under pressure. Between ambient pressure and 3.4 GPa, an irreversible vanishing of some polyiodide modes is exhibited, indicative of iodine polyanion linearization and decomposition of I2 molecules. From 3.4 GPa, important
re-versible changes in the intensity modes are observed. Two scenarios are proposed to account for the modifications un-der nanoconfinement. The first one assumes the transforma-tion of I5− species into I3− polyiodides under pressure. The second scenario suggests a progressive metallization process of the polyiodide. This last hypothesis brings new lighting for the understanding of iodine intercalated compounds.
1N. A. Kiselev, R. M. Zakalyukin, O. M. Zhigalina, N. Grobert,
A. S. Kumskov, Yu. V. Grigoriev, M. V. Chernysheva, A. A. Eliseev, A. V. Krestinin, Yu. D. Tretyakov, B. Freitag, and J. L. Hutchison,J. Microsc. 232, 335共2008兲.
2C. G. Xu, J. Sloan, G. Brown, S. Bailey, V. C. Williams, S.
Friedrichs, K. S. Coleman, E. Flahaut, J. L. Hutchison, R. E. Dunin-Borkowski, and M. L. H. Green, Chem. Commun. 共Cam-bridge兲 2000, 2427. 0 2 4 6 8 10 12 14 16 100 120 140 160 180 1600 1650 1700 0.7 ± 1.4 cm-1/Gpa 0.9 ± 0.6 cm-1/Gpa 10± 0.4 cm-1/Gpa 7.8 ± 0.2 cm-1 /Gpa 6.7 ± 0.2 cm-1/Gpa 1.93 ± 0.08 cm-1 /Gpa 1.6± 0.4 cm-1/Gpa 1.46 ± 0.07 cm-1/Gpa Raman shift (cm -1 ) Pressure (GPa)
FIG. 4. Main Raman band positions of I@SWCNT under pres-sure共from 0 to 17 GPa兲. The hatched regions correspond to transi-tions between different regimes for polyodides and SWCNTs. The different regimes are fitted by straight lines.
2 4 6 8 10 12 14 16 1 2 3 4 5 6 1600 1610 1620 1630 1640 1650 1660 νννν (cm -1 ) Intensity ratio (arb. units ) Pressure(GPa) G band Intensity ratio
FIG. 5. Relative integrated intensity of B and A bands under pressure 共triangles, left scale兲 together with the G band positions 共circles, right scale兲. The integrated intensities are derived from the peak deconvolution shown in Fig.3共a兲. Straight lines are just guides for eyes.
ALVAREZ et al. PHYSICAL REVIEW B 82, 205403共2010兲
3A. Ilie, J. S. Bendall, D. Roy, E. Philp, and M. L. Green,J. Phys. Chem. B 110, 13848共2006兲.
4G. Pagona, G. Rotas, A. N. Khlobystov, T. W. Chamberlain, K.
Porfyrakis, and N. Tagmatarchis,J. Am. Chem. Soc. 130, 6062 共2008兲.
5L. Guan, K. Suenaga, Z. Shi, Z. Gu, and S. Iijima,Nano Lett. 7, 1532共2007兲.
6X. Fan, E. C. Dickey, P. C. Eklund, K. A. Williams, L. Grigorian,
R. Buczko, S. T. Pantelides, and S. J. Pennycook, Phys. Rev. Lett. 84, 4621共2000兲.
7N. Bendiab, R. Almairac, S. Rols, R. Aznar, J.-L. Sauvajol, and
I. Mirebeau,Phys. Rev. B 69, 195415共2004兲.
8Z. Y. Wang, L. Wang, Z. J. Shi, J. Lu, Z. N. Gu, and Z. X. Gao,
Chem. Commun.共Cambridge兲 2008, 3429.
9L. Grigorian, K. A. Williams, S. Fang, G. U. Sumanasekera, A.
L. Loper, E. C. Dickey, S. J. Pennycook, and P. C. Eklund,Phys. Rev. Lett. 80, 5560共1998兲.
10W. Zhou, S. Xie, L. Sun, D. Tang, Y. Li, Z. Liu, L. Ci, X. Zou,
G. Wang, P. Tan, X. Dong, B. Xu, and B. Zhao,Appl. Phys. Lett. 80, 2553共2002兲.
11U. D. Venkateswaran, E. A. Brandsen, M. E. Katakowski, A.
Harutyunyan, G. Chen, A. L. Loper, and P. C. Eklund, Phys. Rev. B 65, 054102共2002兲.
12T. Michel, L. Alvarez, J.-L. Sauvajol, R. Almairac, R. Aznar,
J.-L. Bantignies, and O. Mathon, Phys. Rev. B 73, 195419 共2006兲.
13T. Michel, L. Alvarez, J. L. Sauvajol, R. Almairac, R. Aznar, O.
Mathon, J.-L. Bantignies, and E. Flahaut,J. Phys. Chem. Solids 67, 1190共2006兲.
14P. Deplano, F. Devillanova, J. Ferraro, M. L. Mercuri, V.
Lippo-lis, and E. Trogu,Appl. Spectrosc. 48, 1236共1994兲.
15R. C. Teitelbaum, S. L. Ruby, and T. J. Marks, J. Am. Chem. Soc. 101, 7568共1979兲.
16P. Deplano, F. A. Devillanova, J. R. Ferraro, F. Isaia, V. Lippolis,
and M. L. Mercuri,Appl. Spectrosc. 46, 1625共1992兲. 17P. Deplano, J. Ferraro, M. L. Mercuri, and E. Trogu, Coord.
Chem. Rev. 188, 71共1999兲.
18P. Svensson and L. Kloo,Chem. Rev. 103, 1649共2003兲. 19S. Hsu, A. Signorelli, G. Pez, and R. Baughman,J. Chem. Phys.
69, 106共1978兲.
20A. San-Miguel, H. Libotte, M. Gauthier, G. Aquilanti, S.
Pas-carelli, and J.-P. Gaspard,Phys. Rev. Lett. 99, 015501共2007兲. 21T. Kume, T. Hiraoka, Y. Ohya, S. Sasaki, and H. Shimizu,Phys.
Rev. Lett. 94, 065506共2005兲.
22T. Kenichi, S. Kyoko, F. Hiroshi, and O. Mitsuko,Nature 共Lon-don兲 423, 971 共2003兲.
23Y. Fujii, K. Hase, Y. Ohishi, H. Fujihisa, N. Hamaya, K.
Take-mura, O. ShimoTake-mura, T. Kikegawa, Y. Amemiya, and T. Mat-sushita,Phys. Rev. Lett. 63, 536共1989兲.
24A. Sengupta, E. L. Quitevis, and M. W. Holtz,J. Phys. Chem. B 101, 11092共1997兲.
25H. Olijnyk, W. Li, and A. Wokaun,Phys. Rev. B 50, 712共1994兲. 26A. Congeduti, P. Postorino, M. Nardone, and U. Buontempo,
Phys. Rev. B 65, 014302共2001兲.
27A. Merlen, P. Toulemonde, N. Bendiab, A. Aouizerat, J. L.
Sau-vajol, G. Montagnac, H. Cardon, P. Petit, and A. San Miguel,
Phys. Status Solidi B 243, 690共2006兲.
28M. Yao, Z. Wang, B. Liu, Y. Zou, S. Yu, W. Lin, Y. Hou, S. Pan,
M. Jin, B. Zou, T. Cui, G. Zou, and B. Sundqvist,Phys. Rev. B 78, 205411共2008兲.
29Ch. Caillier, D. Machon, A. San-Miguel, R. Arenal, G.
Montag-nac, H. Cardon, M. Kalbac, M. Zukalova, and L. Kavan,Phys. Rev. B 77, 125418共2008兲.
30A. L. Aguiar et al.共unpublished兲.
31A. Merlen, N. Bendiab, P. Toulemonde, A. Aouizerat, A. San
Miguel, J. L. Sauvajol, G. Montagnac, H. Cardon, and P. Petit,
Phys. Rev. B 72, 035409共2005兲.
32A. San Miguel, C. Caillier, D. Machon, E. B. Barros, A. L.
Aguiar, and A. G. Souza Filho, Crystallography at High
Pres-sure, NATO Science for Peace and Security Series B: Physics
and Biophysics共Springer, Dordrecht, 2010兲, pp. 435–446.
33G. J. Corban, C. Antoniadis, S. K. Hadjikakou, N. Hadjiliadis, J.
F. Meng, and I. S. Butler, Bioinorganic Chem. Applications 1, 68542共2006兲.