ORIGINAL ARTICLE
Fracture hospitalizations between years 2000 and 2007
in Switzerland: a trend analysis
K. Lippuner&A. W. Popp&P. Schwab&M. Gitlin&
T. Schaufler&C. Senn&R. Perrelet
Received: 15 July 2010 / Accepted: 21 October 2010 / Published online: 9 December 2010 # International Osteoporosis Foundation and National Osteoporosis Foundation 2010 Abstract
Summary In Switzerland, the total number and incidence of hospitalizations for major osteoporotic fractures increased between years 2000 and 2007, while hospital-izations due to hip fracture decreased. The cost impact of shorter hospital stays was offset by the increasing cost per day of hospitalization.
Introduction The aim of the study was to establish the trends and epidemiological characteristics of hospitaliza-tions for major osteoporotic fractures (MOF) between years 2000 and 2007 in Switzerland.
Methods Sex- and age-specific trends in the number and crude and age-standardized incidences of hospitalized MOF (hip, clinical spine, distal radius, and proximal humerus) in
women and men aged ≥45 years were analyzed, together
with the number of hospital days and cost of hospitaliza-tion, based on data from the Swiss Federal Statistical Office hospital database and population statistics.
Results Between 2000 and 2007, the absolute number of hospitalizations for MOF increased by 15.9% in women
and 20.0% in men, mainly due to an increased number of non-hip fractures (+37.7% in women and +39.7% in men). Hospitalizations for hip fractures were comparatively stable (−1.8% in women and +3.3% in men). In a rapidly aging
population, in which the number of individuals aged≥45 years
grew by 11.1% (women) and 14.6% (men) over the study period, the crude and age-standardized incidences of hospital-izations decreased for hip fractures and increased for non-hip MOF, both in women and men. The length of hospital stay decreased for all MOF in women and men, the cost impact of which was offset by an increase in the daily costs of hospitalization.
Conclusions Between years 2000 and 2007, hospitaliza-tions for MOF continued to increase in Switzerland, driven by an increasing number and incidence of hospitalizations for non-hip fractures, although the incidence of hip fractures has declined.
Keywords Cost . Epidemiology . Fractures . Hip . Osteoporosis . Switzerland
Introduction
Osteoporosis is defined as “a systemic skeletal disease
characterized by low bone mass and microarchitectural deterioration of bone tissue, with a consequent increase in
bone fragility and susceptibility to fracture” [1]. While
according to this definition a patient with osteoporosis is at
increased risk for fracture at any site,“typical” osteoporotic
fractures occur at the hip, spine, distal forearm, and proximal humerus. The latter are also referred to as major
osteoporotic fractures [2–4].
Several recent publications have indicated a possible
reversal of the secular trend of hip fractures in the USA [5–
K. Lippuner (*)
:
A. W. Popp:
C. Senn:
R. Perrelet Osteoporosis Policlinic, Inselspital, Bern University Hospital, University of Bern,3010, Bern, Switzerland e-mail: kurt.lippuner@insel.ch P. Schwab
Swiss Federal Statistical Office, Neuchâtel, Switzerland M. Gitlin
Amgen (Europe) GmbH, Zug, Switzerland T. Schaufler
Amgen (Switzerland) AG, Zug, Switzerland
7], Canada [8,9], Japan [10], Finland [11], Denmark [12],
France [13], and in the region of Geneva, Switzerland [14,
15] but not in Austria [16], Spain [17], or Germany [18,
19]. None of these publications reported trends of major
osteoporotic fractures other than hip fractures.
The aim of the present analysis was to review the trends and epidemiological characteristics of major osteoporotic fractures in Switzerland, in female and male patients aged 45 years or older, between years 2000 and 2007. Predefined parameters of interest were absolute number and incidence of fracture hospitalizations, number of hospital days due to fractures, and cost of hospitalizations for major osteoporotic fractures.
Methods
We chose to report the characteristics of major osteopo-rotic fractures instead of fractures due to osteoporosis derived from all fractures multiplied by an osteoporosis
attribution rate used in earlier publications [20, 21]. In
year 2000, 51% and 24% of all hospitalizations for fracture in women and men, respectively, were attributed
to osteoporosis [20]. Not using the attribution rates, as in
the present approach, leads to a total number of fractures leading to hospitalization due to major osteoporotic fractures in year 2000 corresponding to only 77% and 72% of the attributed fractures in women and men, respectively. Therefore, the absolute numbers, incidences, hospital days, and related costs detailed in the following analysis should be considered conservative.
Source of hospital statistics
The administrative and medical statistics database of the Swiss Federal Statistical Office (SFSO) was used. All Swiss acute hospitals, rehabilitation centers, and specialized clinics are obliged to supply their administrative (finance, human resources, number of beds, and patient admissions) and medical data (age, sex, number of hospitalized fractures coded in accordance with the International Classification of Diseases 10th Edition (ICD-10) requirements, and duration of hospitalization) to the SFSO. Data collection is initiated and coordinated by the SFSO following stringent quality control measures. Since 1998, each reporting hospital uses a plausibility testing software (currently MedPlaus version
5.0) developed by the SFSO [22]. More than 700
plausibility checks in 4 categories (single variable testing, pooled variable testing (cross-schecks), multiple interde-pendent variable testing, diagnostic code vs. treatment code testing) are performed. Generated log files categorize
findings as “errors” for mandatory correction, “alerts” for
recommended correction, and “notes” for optional
correc-tion. The corrected dataset is sent to the corresponding cantonal health department which ensures consistency in reporting across hospitals within a canton. Inconsistencies are returned to the reporting hospital for correction in line with source data and cantonal requirements. Thereafter, the datasets are sent by all cantons to the SFSO, which performs the last plausibility testing at the federal level, ensuring consistency across cantons. As an example, in year 2001, at the federal level, 4.6% of the diagnostic codes
were identified as not plausible [23]. Only medical data
from Swiss acute hospital settings were retained for the present analysis. Data from rehabilitation centers and specialized clinics were excluded to prevent double count-ing. Although reporting is mandatory, some records were missing; the degree of completeness for all records for years 2000–2007 was 81.2%, 84.9%, 95.0%, 94.1%, 96.2%, 98.2%, 98.5%, and 98.6%, respectively. All raw data were extrapolated pro-rata to 100% to become representative for Switzerland as a whole. Data on the Swiss population structure between 2000 and 2007, split by 5-year age groups and sex, were also obtained from the SFSO.
Hospitalized major osteoporotic fractures in years 2000 through 2007
Raw data for the number of fractures leading to hospital-izations in the acute care setting and the corresponding duration of hospitalization, categorized as described above, were obtained for major osteoporotic fractures (fractures of the hip, spine, distal radius, and proximal humerus), in
women and men aged ≥45 years. Hip fractures were
defined as fractures with ICD-10 codes S72.0 (fracture of the femoral neck), S72.1 (pertrochanteric fracture), and S72.2 (subtrochanteric fracture). Spine fractures were defined as codes S22.0 (fracture of the thoracic spine), S22.1 (multiple fractures of the thoracic spine), S32.0 (fracture of the lumbar spine), S32.7 (multiple fractures of the lumbar spine), and S32.8 (other fractures of the lumbar spine). Fractures of the distal forearm were defined as S52.5 (fracture of the distal radius) and S52.6 (combined fracture of the distal radius/ulna). Finally, fractures of the proximal humerus were identified by the code S42.2 (fracture of the proximal humerus).
Epidemiological and health economic outcomes
The crude and age-standardized incidences of hospital-izations, the number of patient-days spent in the hospital, and the mean length of hospital stay (LOS) per patient were calculated by 5-year age groups starting from age 45 onwards and by sex, for all major osteoporotic fractures grouped into the fracture types defined above. Annual
crude incidences per 100,000 persons in years 2000–2007 were calculated for hip fractures and non-hip major osteoporotic fractures as defined above for each sex and for the predefined 5-year age groups, starting from age 45
onwards. As first suggested by Lewinnek et al. [24], annual
age-standardized fracture incidences per 100,000 persons and related 95% confidence intervals were calculated for the same categories of sex, age, and fractures with direct adjustment to the year 2000 age structure to control for the rapid aging of the Swiss population and to allow for comparison over time. The relevant number of exposed persons was derived from the official population statistics of the SFSO. Incidences by sex and by 5-year age group for hip and non-hip major osteoporotic fractures (MOF) in year 2007 were compared to the corresponding incidences in reference year 2000 by calculating the standardized incidence rate ratio and its 95% confidence interval. Yearly changes in age-specific fracture subgroups (hip and major osteoporotic non-hip fractures) were assessed by sex using a chi-square test for linear trends. All calculations were done with the statistical software StatsDirect version 2.7.7 developed by StatsDirect Ltd, Altrincham, Cheshire, UK.
To assess the costs of fracture hospitalization in 2000– 2007, specific assumptions and methods were applied as described below. As no specific cost data by fracture diagnosis code is available, the average cost per day of acute care hospitalization in Swiss Francs (CHF) was obtained from the yearly hospital statistics database of the
SFSO for each year of analysis [25]. The cost per day
utilized for each year was not inflation adjusted.
Results
Swiss population structure
Between 2000 and 2007, the number of women and men in the Swiss population increased, from 3.67 million to 3.85 million and from 3.51 million to 3.70 million, respectively, representing an average annual population increase during this period of 0.6% for all women and 0.7% for all men. For both sexes, however, the number of individuals aged ≥45 years grew faster than the total population (by 11.1% and 14.6% in women and men, respectively, over the study period), so that as a proportion of the total population, this age group increased from 42.1% to 44.7% (women) and from 37.9% to 41.2% (men).
Hospitalizations for major osteoporotic fractures
Between 2000 and 2007, the absolute number of acute care hospitalizations for major osteoporotic fractures in patients
aged≥45 years increased by 15.9% in women and 20.0% in
men (Table1), driven mainly by increases in the number of
hospitalizations for non-hip fractures (37.7% and 39.7%, respectively). The corresponding changes in the number of
hip fracture hospitalizations were −1.8% in women and
+3.3% in men. The number of hospitalizations for hip fractures decreased by 0.2% per year in women and increased by 0.4% per year in men. In contrast, the number of hospitalizations for major osteoporotic fractures other than hip fractures increased by 4.1% per year in women and by 4.3% per year in men during the same period.
As shown in Tables2(women) and 3 (men), the overall
age-standardized incidence of hospitalizations for hip
frac-tures per 100,000 person-years in patients aged ≥45 years
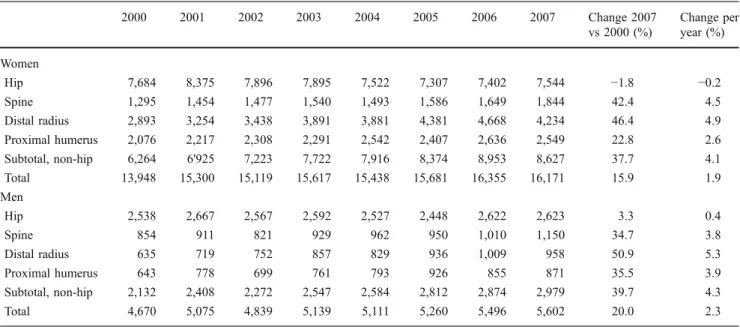
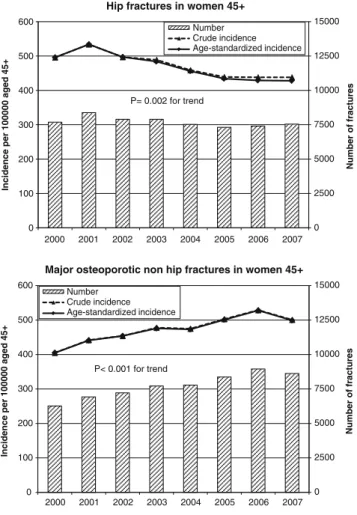
had significantly decreased by 14% in year 2007 compared to year 2000, both in women (from 496 (95% CI 485 to 507) to 428 (95% CI 419 to 438)) and in men (from 191 (95% CI 183 to 198) to 164 (95% CI 158 to 171)). The linear trend of decrease during the 8 years of observation was significant in both sexes (P=0.002 in women and P=0.001 in men, in
Figs. 1 and 2, respectively). Significant decreases in hip
fracture incidences were observed in women older than
65 years of age and in 65–79-year-old men. The largest
decreases in hip fracture incidence were observed in
65–74-year-old women and men, reaching −26% and −24%,
respectively. Conversely, the age-standardized incidence of hospitalizations for non-hip major osteoporotic fractures was significantly increased in year 2007 compared to 2000 in both sexes, by 23% in women (from 405 (95% CI 395 to 415) to 499 (95% CI 488 to 510) per 100,000 person-years) and by 20% in men (from 160 (95% CI 153 to 167) to 193 (95% CI 186 to 200) per 100,000 person-years). The linear trend of increase during the 8 years of observation
was significant in women (P<0.001, Fig. 1) but not in
men (P=0.149, Fig. 2). Significant increases in
age-standardized non-hip MOF were observed in all age
groups in women (Table 2) and in selected age groups
(55 to 59, 65 to 74, and≥80 years) in men (Table3). The
largest increase in non-hip MOF incidence was observed in 55–64-year-old women, reaching +44% and in men after the age of 70, reaching +48%.
Patient-days in hospital and mean length of stay
The number of patient-days per year spent in acute hospital settings for major osteoporotic fractures in patients
aged≥45 years decreased from 224,244 in 2000 to 185,010 in
2007 in women (a decrease of 17.5%) and from 71,477 to
62,904 in men (−12.0%) (Table 4). The decreasing trend
during the 8-year observation period was significant in both sexes (P<0.001). The annual percent change in patient-days
over the period was−2.4% for women and −1.6% for men.
This change was due mainly to steady decreases in both sexes in patient-days attributable to hip fractures. For other
fractures, the changes in number of patient-days over the period were smaller than for hip fractures.
The mean LOS for major osteoporotic fracture treatment steadily decreased between 2000 and 2007, from 16.1 to 11.4 days in women (−29.2%) and from 15.3 to 11.2 days in men (−26.8%). The mean annual change in LOS was −4.2% in women and −3.8% in men, with a similar magnitude across all fractures, so that hip fractures remained the fracture type with the longest hospitalization duration in year 2007.
Cost of hospitalizations for major osteoporotic fractures As described above, the average LOS for patients hospital-ized because of fractures decreased substantially over the period between 2000 and 2007. The effect of this was counterbalanced, however, by rising hospital costs: the mean cost per day of hospitalization increased from CHF 996.00 to CHF 1,543.00, over the same period, a rise of 55%. The combined effect of these two changes was to increase total hospital costs for all major osteoporotic fractures from CHF 223.5 millions in year 2000 to CHF 285.4 (+27.7%) in year 2007 in women and from 71.2 to 97.1 millions (+36.4%) in men during the same period
(Table 4). These increasing trends during the 8-year
observation period did not reach statistical significance, neither in women (P=0.086) nor in men (P=0.258). While the costs of hip fractures increased by 2.0% and 2.5% per year between 2000 and 2007 in women and men, respectively, the corresponding cost of non-hip fractures
increased by 5.0% and 6.4% per year. As shown in Fig.3,
the economic benefit of reductions in the LOS has been
offset by the higher daily cost of hospitalization—indeed,
mean cost per patient increased by 1.2% per year in women and by 1.6% per year in men, corresponding to an overall increase in the cost per patient hospitalized for a major osteoporotic fracture of 10.2% (women) and 13.6% (men) over the 8 years of observation.
Discussion
This epidemiological analysis of the hospitalization rates and characteristics of major osteoporotic fractures (hip, spine, distal radius, and proximal humerus) in acute hospital settings in Switzerland suggests a nationwide reversal of the secular trend of hip fractures. The present results show for the first time that in a rapidly aging population, the incidence of hospitalizations for major osteoporotic fractures other than hip fractures followed an opposite trend. Furthermore, the economic benefit of the reduced duration of hospitalization for all major osteopo-rotic fractures was offset by the simultaneous increase in the cost per day of hospitalization.
Switzerland ranks second worldwide after Japan with regard to the proportion of elderly in the resident population
[26]. In Switzerland, life expectancy at birth is among the
highest worldwide (82.5 years for women and 76.7 years
for men in 2001) [27] and is continuously increasing,
reaching 84.2 and 79.4 years in year 2007 in women and
men, respectively [28]. According to the demographic
scenarios from the SFSO, this increasing trend will not level off before year 2050, by when the population older
than 65 years of age will almost have doubled [29].
Table 1 Absolute number of hospitalized major osteoporotic fractures in women and men from 2000 to 2007
2000 2001 2002 2003 2004 2005 2006 2007 Change 2007 vs 2000 (%) Change per year (%) Women Hip 7,684 8,375 7,896 7,895 7,522 7,307 7,402 7,544 −1.8 −0.2 Spine 1,295 1,454 1,477 1,540 1,493 1,586 1,649 1,844 42.4 4.5 Distal radius 2,893 3,254 3,438 3,891 3,881 4,381 4,668 4,234 46.4 4.9 Proximal humerus 2,076 2,217 2,308 2,291 2,542 2,407 2,636 2,549 22.8 2.6 Subtotal, non-hip 6,264 6'925 7,223 7,722 7,916 8,374 8,953 8,627 37.7 4.1 Total 13,948 15,300 15,119 15,617 15,438 15,681 16,355 16,171 15.9 1.9 Men Hip 2,538 2,667 2,567 2,592 2,527 2,448 2,622 2,623 3.3 0.4 Spine 854 911 821 929 962 950 1,010 1,150 34.7 3.8 Distal radius 635 719 752 857 829 936 1,009 958 50.9 5.3 Proximal humerus 643 778 699 761 793 926 855 871 35.5 3.9 Subtotal, non-hip 2,132 2,408 2,272 2,547 2,584 2,812 2,874 2,979 39.7 4.3 Total 4,670 5,075 4,839 5,139 5,111 5,260 5,496 5,602 20.0 2.3
T able 2 Age-standardized incidence of hospitalizations for hip fractures and non-hip major osteoporotic fractures in women 45 – 49 years 50 – 54 years 55 – 59 years 60 – 64 ye ars 65 – 69 years 70 – 74 years 75 – 79 years 80 – 85 years 85+ years Overa ll 45+ years Incid ence of hip fractures per 100,0 00 perso n-years (95% CI ) b y age categories 2000 18 (14 to 25) 31 (24 to 39) 69 (58 to 80) 106 (92 to 122) 209 (188 to 232) 408 (37 6 to 441) 828 (780 to 877) 1,762 (1,678 to 1,850) 3,443 (3,329 to 3,559 ) 496 (485 to 507) 2001 21 (16 to 28) 40 (32 to 49) 61 (51 to 72) 1 1 5 (100 to 131) 196 (175 to 218) 471 (43 8 to 506) 938 (888 to 991) 1,838 (1,754 to 1,925) 3,693 (3,575 to 3,814 ) 534 (522 to 545) 2002 19 (14 to 25) 34 (27 to 43) 62 (52 to 73) 1 1 8 (103 to 134) 193 (173 to 215) 400 (36 9 to 432) 798 (751 to 846) 1730 (1,651 to 1,813) 3,552 (3,437 to 3,671 ) 497 (487 to 508) 2003 18 (13 to 24) 29 (23 to 37) 84 (73 to 97) 1 1 4 (100 to 131) 170 (151 to 191) 378 (34 9 to 410) 822 (775 to 871) 1,721 (1,643 to 1,801) 3,365 (3,254 to 3,479 ) 484 (473 to 495) 2004 19 (14 to 25) 38 (31 to 47) 62 (53 to 73) 99 (86 to 1 14) 168 (149 to 187) 371 (34 2 to 403) 794 (748 to 843) 1,561 (1,489 to 1,636) 3,183 (3,075 to 3,294 ) 456 (4 46 to 466) 2005 1 1 (7 to 16) 31 (24 to 39) 60 (50 to 70) 96 (83 to 1 10) 182 (162 to 204) 359 (33 0 to 390) 777 (732 to 824) 1,571 (1,499 to 1,645) 2,906 (2,805 to 3,01 1) 434 (42 4 to 444) 2006 21 (16 to 26) 26 (20 to 33) 72 (61 to 83) 95 (83 to 109) 175 (156 to 195) 331 (30 3 to 360) 704 (661 to 749) 1,546 (1,475 to 1,619) 2,977 (2,876 to 3,081 ) 429 (4 20 to 439) 2007 1 1 (8 to 16) 34 (27 to 42) 69 (59 to 81) 104 (91 to 1 18) 155 (138 to 164) 321 (29 4 to 350) 701 (659 to 746) 1,472 (1,403 to 1,544) 3,068 (2,968 to 3,172 ) 428 (4 19 to 438) Incid ence rate ratio (95% CI) 0.62 (0.40 to 0.96) 1.10 (0.81 to 1.50) 1.01 (0.81 to 1.26) 0.98 (0.81 to 1.18) 0.74 (0.64 to 0.87) 0.79 (0.70 to 0.89) 0.85 (0 .78 to 0.92) 0.84 (0.78 to 0.89) 0.89 (0.85 to 0.93) 0.86 (0.84 to 0.89) Incid ence of non-hip m ajor ost eoporotic fractures per 100,000 person-years (95% CI) by age catego ries 2000 72 (62 to 84) 133 (1 18 to 148) 204 (186 to 224) 259 (223 to 284) 381 (352 to 412) 567 (53 1 to 606) 816 (769 to 865) 1,068 (1,003 to 1,137) 1,201 (1,134 to 1,2 70 ) 405 (395 to 415) 2001 109 (97 to 123) 145 (13 0 to 161) 259 (239 to 281) 286 (262 to 31 1) 405 (375 to 437) 619 (58 0 to 659) 893 (845 to 944) 1,130 (1,064 to 1,199) 1,191 (1,125 to 1 ,261 ) 441 (431 to 451) 2002 95 (84 to 108) 152 (13 7 to 169) 240 (220 to 260) 315 (290 to 341) 425 (395 to 458) 642 (60 3 to 683) 903 (854 to 955) 1,192 (1,126 to 1,261) 1,255 (1,186 to 1, 326 ) 454 (443 to 464) 2003 120 (107 to 134) 187 (17 0 to 205) 279 (258 to 302) 364 (338 to 392) 451 (419 to 484) 664 (62 4 to 705) 894 (845 to 945) 1,149 (1,086 to 1,215) 1,250 (1,183 to 1,320 ) 476 (465 to 487) 2004 91 (80 to 103) 175 (15 8 to 192) 282 (261 to 304) 357 (331 to 384) 493 (460 to 527) 645 (60 6 to 686) 916 (866 to 967) 1,164 (1,101 to 1,229) 1,229 (1,162 to 1, 298 ) 473 (462 to 483) 2005 109 (97 to 122) 191 (17 5 to 210) 277 (256 to 299) 407 (380 to 435) 539 (505 to 574) 700 (65 9 to 742) 963 (912 to 1,016) 1,186 (1,124 to 1,251) 1,257 (1,190 to 1,326 ) 501 (491 to 512) 2006 1 1 2 (100 to 125) 233 (21 4 to 253) 320 (298 to 344) 416 (389 to 444) 556 (521 to 592) 713 (67 2 to 755) 974 (923 to 1,027) 1,245 (1,182 to 1,31 1) 1,320 (1,253 to 1,390 ) 528 (517 to 538) 2007 103 (92 to 1 16) 164 (14 9 to 181) 292 (270 to 314) 374 (349 to 400) 493 (461 to 527) 671 (63 1 to 712) 984 (933 to 1,037) 1,237 (1,174 to 1,303) 1,371 (1,304 to 1,441 ) 499 (488 to 510) Incid ence rate ratio (95% CI) 1.43 (1.19 to 1.71) 1.24 (1.07 to 1.43) 1.43 (1.27 to 1.61) 1.44 (1.29 to 1.61) 1.29 (1.17 to 1.43) 1.18 (1.08 to 1.29) 1.21 (1 .12 to 1.30) 1.16 (1.07 to 1.26) 1.14 (1.06 to 1.23) 1.23 (1.19 to 1.27) P value for trend: hip fractures P = 0.002; non-hip fractures P < 0.001
T able 3 Age-standardized incidence of hospitalizations for hip fractures and non-hip major osteoporotic fractures in men 45 – 49 years 50 – 54 years 55 – 59 yea rs 60 – 64 years 65 – 69 years 70 – 74 years 75 – 79 ye ars 80 – 85 years 85+ years Overa ll 45+ years Incid ence of hip fractures per 100,0 00 perso n-years (95% CI ) b y age categories 2000 37 (30 to 46) 48 (40 to 58) 79 (68 to 92) 90 (77 to 106) 159 (13 9 to 181) 225 (199 to 254) 439 (397 to 484) 755 (683 to 832) 1,756 (1,629 to 1,891 ) 191 (183 to 19 8) 2001 38 (31 to 47) 48 (40 to 58) 63 (53 to 75) 99 (84 to 1 15) 121 (10 4 to 141) 226 (200 to 255) 492 (447 to 539) 846 (772 to 926) 1,884 (1,753 to 2,023 ) 196 (189 to 20 4) 2002 31 (25 to 39) 55 (46 to 65) 59 (50 to 70) 93 (80 to 109) 127 (1 10 to 147) 217 (192 to 245) 450 (408 to 496) 742 (674 to 815) 1,817 (1,689 to 1,953 ) 186 (179 to 19 3) 2003 39 (32 to 47) 42 (34 to 51) 65 (55 to 76) 86 (73 to 100) 121 (10 4 to 140) 210 (186 to 238) 443 (401 to 488) 762 (696 to 834) 1,739 (1,616 to 1,869 ) 181 (174 to 18 8) 2004 30 (24 to 37) 48 (40 to 58) 65 (55 to 76) 75 (64 to 89) 120 (10 3 to 139) 21 1 (186 to 238) 392 (353 to 433) 701 (638 to 768) 1,729 (1,608 to 1,857 ) 173 (166 to 180 ) 2005 26 (21 to 33) 39 (32 to 48) 64 (54 to 75) 78 (66 to 91) 126 (10 9 to 145) 169 (147 to 193) 363 (326 to 403) 714 (651 to 781) 1,61 1 (1,496 to 1,733 ) 163 (157 to 169 ) 2006 31 (25 to 38) 44 (36 to 53) 55 (46 to 66) 83 (71 to 96) 123 (10 6 to 142) 186 (164 to 21 1) 358 (322 to 398) 731 (668 to 799) 1,743 (1,626 to 1,866 ) 169 (163 to 176 ) 2007 30 (24 to 37) 39 (32 to 48) 46 (38 to 56) 84 (73 to 97) 121 (10 5 to 139) 176 (154 to 200) 366 (330 to 405) 717 (655 to 784) 1,684 (1,572 to 1,802 ) 164 (158 to 171 ) Incid ence rate ratio (95% CI) 0.80 (0.60 to 1.07) 0.81 (0.63 to 1.06) 0.58 (0.46 to 0.74) 0.93 (0.75 to 1.16) 0.76 (0.63 to 0.92) 0.78 (0.65 to 0.93) 0.83 (0 .72 to 0.96) 0.95 (0.83 to 1.08) 0.96 (0.87 to 1.06) 0.86 (0.82 to 0.91) Incid ence of non-hip m ajor ost eoporotic fractures per 100,000 person-years (95% CI) by age catego ries 2000 136 (122 to 151) 133 (1 19 to 148) 125 (1 1 to 141) 155 (137 to 175) 162 (14 2 to 184) 148 (126 to 171) 216 (187 to 249) 277 (234 to 326) 435 (373 to 505) 160 (153 to 167) 2001 128 (1 15 to 143) 139 (124 to 154) 169 (152 to 187) 157 (139 to 177) 159 (13 9 to 181) 194 (170 to 221) 240 (209 to 274) 353 (306 to 406) 503 (436 to 577) 178 (17 1 to 185) 2002 121 (108 to 135) 139 (125 to 155) 139 (125 to 156) 152 (134 to 171) 140 (12 1 to 160) 191 (167 to 217) 225 (195 to 257) 295 (252 to 342) 492 (426 to 565) 165 (15 8 to 171) 2003 142 (129 to 158) 149 (134 to 165) 159 (143 to 176) 159 (141 to 178) 180 (15 9 to 203) 181 (158 to 207) 266 (234 to 301) 343 (298 to 392) 41 1 (352 to 476) 180 (17 3 to 187) 2004 139 (126 to 154) 145 (130 to 161) 145 (130 to 161) 173 (155 to 193) 179 (15 8 to 202) 187 (164 to 212) 243 (213 to 276) 329 (286 to 376) 489 (425 to 559) 179 (17 2 to 186) 2005 143 (129 to 157) 138 (124 to 154) 156 (140 to 172) 174 (156 to 193) 179 (15 8 to 201) 215 (190 to 242) 270 (238 to 304) 325 (283 to 372) 472 (41 1 to 540) 184 (17 7 to 191) 2006 139 (125 to 153) 159 (144 to 175) 165 (149 to 182) 179 (162 to 198) 190 (16 9 to 213) 205 (182 to 232) 279 (247 to 314) 319 (278 to 365) 508 (446 to 576) 191 (18 4 to 198) 2007 145 (131 to 159) 145 (131 to 161) 169 (153 to 186) 177 (160 to 196) 195 (17 4 to 218) 218 (193 to 245) 230 (202 to 262) 391 (345 to 440) 562 (498 to 632) 193 (18 6 to 200) Incid ence rate ratio (95% CI) 1.06 (0.92 to 1.23) 1.09 (0.94 to 1.27) 1.35 (1.16 to 1.57) 1.14 (0.97 to 1.33) 1.20 (1.01 to 1.42) 1.48 (1.22 to 1.78) 1.06 (0 .88 to 1.28) 1.41 (1.15 to 1.72) 1.29 (1.07 to 1.56) 1.20 (1.14 to 1.27) P value for trend: hip fractures P = 0.001; non-hip fractures P = 0.149
Therefore, the current trend indicating a reduction of hip fracture incidence will not be sufficient to reduce in the number of hip fractures in the coming decades. Further-more, any reduction in hip fracture incidence may be more than offset by the increasing incidences of hospitalizations of major osteoporotic fractures other than hip.
The incidence of hip fractures decreased in all age groups between year 2000 and year 2007, indicating that the reported reversal of the secular trend of hip fractures in
the region of Geneva between years 1991 and 2000 [14]
may be a nationwide phenomenon that continued at least until year 2007. Patients with hip fractures are usually hospitalized for surgical repair, so that the incidence of hospitalizations may be considered as a reliable approxi-mation of their overall incidence. As already done by others
who reported similar findings [8, 12, 14], we can only
speculate about the potential causes of such a reversal. First, this decreasing incidence was observed in both sexes, although more pronounced in women than in men. Second, it was observed in all age groups, although most
pro-nounced in 65–74-year-old women and in 45–64-year-old
men. This is consistent with earlier observations from Sweden that indicated a right-shift of the hip fracture
incidence curve in women [30]. Women in this age group
may have benefited from the “golden days” of hormone
replacement therapy, which was shown to reduce the risk of hip fracture, until safety concerns regarding the HRT-induced increased risk of breast cancer, stroke, nonfatal
myocardial infarction, and pulmonary embolism [31, 32]
gained considerable public attention and led many physi-cians and women, including those in Switzerland, to restrict
their usage [33]. This age group is also the typical category
of the population in which osteoporosis is diagnosed and treated with a bone active substance proven to reduce
fracture risk at the hip, generally a bisphosphonate [34,35].
However, as suggested by others, the decrease in hip fractures may be much too large to be explained solely by
an increase in the use of osteoporosis treatment [8,12,36].
Furthermore, a reduction in hip fracture incidence was also observed in men who are not the primary target group for interventions against osteoporosis in Switzerland. The awareness and use of vitamin D in the elderly and very
0 1500 3000 4500 6000 0 50 100 150 200 250 2000 2001 2002 2003 2004 2005 2006 2007 Number of fractures
Incidence per 100000 aged 45+
Hip fractures in men 45+
Number Crude incidence Age-standardized incidence P= 0.001 for trend 0 1500 3000 4500 6000 0 50 100 150 200 250 2000 2001 2002 2003 2004 2005 2006 2007 Number of fractures
Incidence per 100000 aged 45+
Major osteoporotic non hip fractures in men 45+
Number Crude incidence Age-standardized incidence
P= 0.149 for trend
Fig. 2 Hip fractures and non-hip major osteoporotic fractures in men aged 45 years and older. Total number and crude and age-standardized incidences per 100,000 person-years
0 2500 5000 7500 10000 12500 15000 0 100 200 300 400 500 600 2000 2001 2002 2003 2004 2005 2006 2007 Number of fractures
Incidence per 100000 aged 45+
Hip fractures in women 45+
Number Crude incidence Age-standardized incidence P= 0.002 for trend 0 2500 5000 7500 10000 12500 15000 0 100 200 300 400 500 600 2000 2001 2002 2003 2004 2005 2006 2007 Number of fractures
Incidence per 100000 aged 45+
Major osteoporotic non hip fractures in women 45+
Number Crude incidence Age-standardized incidence
P< 0.001 for trend
Fig. 1 Hip fractures and non-hip major osteoporotic fractures in women aged 45 years and older. Total number and crude and age-standardized incidences per 100,000 person-years
old may have increased, especially in nursing homes, since vitamin D supplementation was first shown to reduce hip
fractures in institutionalized elderly [37]. Similarly, one may
speculate that the use of hip protectors [38–40] and the
dissemination of information about fall prevention measures
[41,42] may have contributed to the decrease. However, the
largest decrease in incidence was not seen in patients aged 85 years or older. Finally, the prevalence of osteoporosis itself may simply be declining, as suggested by the latest findings of the NHANES 2005–2006 survey which showed a decrease of the age-adjusted prevalence of osteoporosis measured by DXA at the femoral neck of 7% in women and 3% in men compared to the NHANES III (1988–1994)
survey [43]. No similar data are available for Switzerland.
The incidence of hospitalizations of major osteoporotic fractures other than of the hip increased during the same period in both sexes and in all age groups. This finding contrasts with earlier reports from Finland which indicated
that low-trauma knee [44], ankle [45], and distal humeral
Table 4 Patient-days spent in acute care hospitals and annual cost of hospitalizations (in millions CHF) for major osteoporotic fractures in Switzerland
2000 2001 2002 2003 2004 2005 2006 2007 Change 2007 vs. 2000 (%) Change per year (%) Patient-days Women Hip 146,302 149,380 141,410 138,974 124,271 116,910 110,475 110,819 −24.3 −3.4 Spine 21,600 21,484 24,630 24,082 20,693 21,279 22,064 22,624 +4.7 +0.6 Distal radius 25,200 26,868 23,929 23,934 24,453 25,003 25,755 23,767 −5.7 −0.7 Proximal humerus 31,143 31,459 30,536 28,520 29,406 27,627 29,777 27,798 −10.7 −1.4 Total days 224,244 229,192 220,506 215,510 198,823 190,818 188,071 185,010 −17.5 −2.4 Men Hip 47,840 45,802 44,625 43,341 40,110 37,144 39,484 37,735 −21.1 −2.9 Spine 11,830 12,300 11,228 11,472 11,073 9,981 11,423 11,901 +0.6 +0.1 Distal radius 3,820 4,372 4,160 4,864 4,427 4,929 5,045 4,559 +19.3 +2.2 Proximal humerus 7,986 8,630 7,255 8,476 8,262 8,517 8,227 8,709 +9.1 +1.1 Total days 71,477 71,105 67,268 68,153 63,872 60,571 64,179 62,904 −12.0 −1.6
Hospitalization cost (CHF, millions) Women Hip 145.8 170.1 174.7 180.3 166.2 165.3 161.9 171.0 +17.3 +2.0 Spine 21.5 24.5 30.4 31.2 27.7 30.1 32.3 34.9 +62.3 +6.2 Distal radius 25.1 30.6 29.6 31.1 32.7 35.3 37.7 36.7 +46.2 +4.8 Proximal humerus 31.0 35.8 37.7 37.0 39.3 39.1 43.6 42.9 +38.4 +4.1 Total 223.5 260.9 272.4 279.6 265.9 269.7 275.6 285.4 +27.7 +3.1 Men Hip 47.7 52.1 55.1 56.2 53.7 52.5 57.9 58.2 +22.0 +2.5 Spine 11.8 14.0 13.9 14.9 14.8 14.1 16.7 18.4 +55.9 +5.7 Distal radius 3.8 5.0 5.1 6.3 5.9 7.0 7.4 7.0 +84.2 +8.0 Proximal humerus 8.0 9.8 9.0 11.0 11.1 12.0 12.1 13.4 +67.5 +6.8 Total 71.2 81.0 83.1 88.4 85.4 85.6 94.0 97.1 +36.4 +3.9
P value for trends: patient-days women (P<0.001) and men (P<0.001); hospitalization cost women (P=0.086) and men (P=0.258)
0 200 400 600 800 1,000 1,200 1,400 1,600 1,800 0.0 2.0 4.0 6.0 8.0 10.0 12.0 14.0 16.0 18.0 2000 2001 2002 2003 2004 2005 2006 2007
Mean cost per hospital day (CHF)
Mean LOS (days)
Mean LOS MOF (women) Mean LOS MOF (men)
Mean cost per day of hospitalization (CHF)
Fig. 3 Opposite trends in mean length of hospital stay (LOS) for all major osteoporotic fractures and in mean cost per day of hospitaliza-tion between years 2000 and 2007
[46] fractures may be stabilizing or even declining in this country. Importantly, the present analysis reports hospital-ized fractures only. In an earlier work, we calculated that the hospitalization rates for all clinical spine fractures, fractures of the distal radius, and fractures of the proximal humerus were 22.3%, 34.1%, and 52.6% in women aged
50 years or older [3]. The corresponding figures in men
aged 50 years or older were 29.1%, 28.2%, and 41.9%,
respectively [3]. Therefore, the probability of being
hospitalized after a fracture may have increased at the expense of ambulatory treatment. This hypothesis may apply to clinical spine fractures, as vertebroplasties and kyphoplasties are increasingly performed in patients with
acute painful fractures of one or more vertebral bodies [47].
However, we are not aware of revisions or extensions of the indications for surgical repair of fractures of the radius and the humerus during the period of observation. In addition, the ongoing health care reform has fostered a shift from traditional inpatient care towards preferred ambulatory outpatient care which would rather plead in favor of a decreasing number of
hospitalizations including for fractures [48].
The cost of all hospitalizations for major osteoporotic fractures increased in women and men over the study period, driven mainly by large increases in the cost of non-hip fractures. On average, the direct medical cost of hospitalized major osteoporotic fractures was CHF 365 million per year between years 2004 and 2007, and the mean cost per patient was approximately CHF 17,000 for both sexes. The length of hospital stay has considerably decreased between 2000 and 2007 for all major osteopo-rotic fractures. While this trend may reflect efforts in optimizing inpatient acute medical care and cost, the present analysis shows that the cost impact of these efforts was totally offset by the parallel increase in the average cost per day of hospitalization. Furthermore, it is reasonable to assume that a minimal duration of hospitalization for surgical fracture repair exists and will be reached during the coming years. Once this floor duration of hospitaliza-tion is achieved, cost optimizahospitaliza-tion will depend on whether the daily cost of per day of hospitalization alone can be reduced and possibly more realistically on the ability to avoid hospitalizations by preventing osteoporotic fractures through targeted interventions in populations at risk.
The present analysis showed that the total number of fractures leading to hospitalization increased from 2000 to 2007 in a population (45 years or older) that increased in number over the same period. This is also the first report of an increase in incidence of major osteoporotic fractures other than the hip, a finding that may be of considerable relevance. Typical sites of osteoporotic fractures may vary in their susceptibility to fracture and their response to
intervention [49–52]. This would suggest that interventions
aimed at reducing fracture risk should not only document
their efficacy against vertebral and pooled non-vertebral fractures (including hip fractures), but also with regard to individual major osteoporotic fractures, namely fractures of the distal radius and the proximal humerus, and possibly other fracture types. As a consequence, certain patients may be shown to benefit more from certain interventions than from others. If so, these patients could be identified by means of a fracture site-specific risk assessment tool that
offers improvements over FRAX [2, 3]. A nationwide
fracture registry recording all hospitalized and non-hospitalized fragility fractures and the specific patient and fracture characteristics, including falls, would contribute to highlight the true changes in incidence of such fragility fractures, to study their correlation with underexplored risk factors such as falls, and to monitor the effects of
interventions over time under “real-life” circumstances.
The present study has some limitations. The degree of completeness of patient records reporting increased from 81.2% in 2000 to 98.6% in 2007, mainly due to new hospitals fulfilling their obligations. A selection bias cannot be excluded if hospitalizations for fractures were signifi-cantly different in these hospitals. However, reporting exceeded 95% as of 2002, so that the magnitude of such a hypothetical bias is expectedly low. Only fracture patients hospitalized in acute settings were considered in the present analysis report, due to the lack of accessible fracture data in the outpatient sector in Switzerland. Therefore, the calcu-lated incidences do not reflect the true incidence of osteoporotic fractures. Whether the proportions of hospital-ized and non-hospitalhospital-ized fractures reported in our earlier
work [53] are still valid also remains unknown. Finally, our
study was neither designed nor able to identify the exact causes of the reported findings.
In the rapidly aging Swiss population, hospitalizations for major osteoporotic fractures increased between years 2000 and 2007. The decreasing incidence of hip fractures was overcompensated by the increasing incidences of hospital-izations for clinical fractures of the spine, distal radius, and proximal humerus. The reduction in the mean length of stay observed for all fractures was offset by the accompanying increase in the daily cost of hospitalization. Further research is needed to confirm and better understand these trends. Acknowledgments This work was supported by a research grant from Amgen Switzerland AG. We are grateful to Dr. Philippe Kress, Kressmed, Glattbrugg, Switzerland for his contribution to data analysis and his critical review of the manuscript. Amgen (Europe) GmbH and GlaxoSmithKline Ltd provided funds to Bioscript Stirling Ltd for editing and styling support.
Conflicts of interest K. Lippuner has received research grants through the Osteoporosis Policlinic, University of Bern from Amgen, Novartis, Roche, Servier, and MSD. He has received speaker fees and/or was a member of a paid advisory board of Amgen, Daiichi Sankyo, Eli Lilly, MSD, Novartis, Nycomed Roche, and Servier. A. Popp has
received consulting fees from Amgen, Eli Lilly, and MSD and also Speakers bureau from Daiichi-Sankyo, and Synthes. P. Schwab, C. Senn, and R. Perrelet have nothing to declare. M. Gitlin and T. Schaufler are employees of Amgen and may own stock and/or stock options.
References
1. (1993) Consensus development conference: diagnosis, prophylaxis, and treatment of osteoporosis. Am J Med 94:646–650
2. Lippuner K, Johansson H, Kanis JA et al (2010) FRAX assessment of osteoporotic fracture probability in Switzerland. Osteoporos Int 21:381–389
3. Lippuner K, Johansson H, Kanis JA et al (2009) Remaining lifetime and absolute 10-year probabilities of osteoporotic fracture in Swiss men and women. Osteoporos Int 20:1131–1140 4. Kanis JA, Burlet N, Cooper C et al (2008) European guidance for
the diagnosis and management of osteoporosis in postmenopausal women. Osteoporos Int 19:399–428
5. Melton LJ 3rd, Kearns AE, Atkinson EJ et al (2009) Secular trends in hip fracture incidence and recurrence. Osteoporos Int 20:687–694
6. Gehlbach SH, Avrunin JS, Puleo E (2007) Trends in hospital care for hip fractures. Osteoporos Int 18:585–591
7. Brauer CA, Coca-Perraillon M, Cutler DM et al (2009) Incidence and mortality of hip fractures in the United States. JAMA 302:1573–1579
8. Leslie WD, O'Donnell S, Jean S et al (2009) Trends in hip fracture rates in Canada. JAMA 302:883–889
9. Jaglal S (2007) Falling hip fracture rates. J Bone Miner Res 22:1098, author reply 1099
10. Orimo H, Yaegashi Y, Onoda T et al (2009) Hip fracture incidence in Japan: estimates of new patients in 2007 and 20-year trends. Arch Osteoporos 4:71–77
11. Kannus P, Niemi S, Parkkari J et al (2006) Nationwide decline in incidence of hip fracture. J Bone Miner Res 21:1836–1838 12. Abrahamsen B, Vestergaard P (2010) Declining incidence of hip
fractures and the extent of use of anti-osteoporotic therapy in Denmark 1997–2006. Osteoporos Int 21:373–380
13. Maravic M, Taupin P, Landais P et al (2010) Change in hip fracture incidence over the last 6 years in France. Osteoporos Int. doi:10.1007/s00198-010-1255-9
14. Chevalley T, Guilley E, Herrmann FR et al (2007) Incidence of hip fracture over a 10-year period (1991–2000): reversal of a secular trend. Bone 40:1284–1289
15. Guilley E, Chevalley T, Herrmann F et al (2008) Reversal of the hip fracture secular trend is related to a decrease in the incidence in institution-dwelling elderly women. Osteoporos Int 19:1741–1747 16. Mann E, Icks A, Haastert B et al (2008) Hip fracture incidence in
the elderly in Austria: an epidemiological study covering the years 1994–2006. BMC Geriatr 8:35
17. Hernandez JL, Olmos JM, Alonso MA et al (2006) Trend in hip fracture epidemiology over a 14-year period in a Spanish population. Osteoporos Int 17:464–470
18. Wildner M, Clark DE (2001) Hip fracture incidence in East and West Germany: reassessement ten years after unification. Osteo-poros Int 12:136–139
19. Icks A, Haastert B, Wildner M et al (2008) Trend of hip fracture incidence in Germany 1995–2004: a population-based study. Osteoporos Int 19:1139–1145
20. Lippuner K, Golder M, Greiner R (2005) Epidemiology and direct medical costs of osteoporotic fractures in men and women in Switzerland. Osteoporos Int 16(Suppl 2):S8–S17
21. Lippuner K, von Overbeck J, Perrelet R et al (1997) Incidence and direct medical costs of hospitalizations due to osteoporotic fractures in Switzerland. Osteoporos Int 7:414–425
22. (2009) Swiss Federal Statistical Office. Plausibility of medical statistics: the MedPlaus 5.0 concept. Available online under≤http:// www.freudiger.com/download/mp5_konzept_D_20091029.pdf≥.
Accessed Oct 2010
23. (2004) Swiss Federal Statistical Office. Data quality evaluation of medical statistics in 1998–2001. Available online under ≤http:// www.bfs.admin.ch/bfs/portal/de/index/themen/14/22/publ.html? publicationID=1306≥. Accessed Oct 2010
24. Lewinnek GE, Kelsey J, White AA 3rd et al (1980) The significance and a comparative analysis of the epidemiology of hip fractures. Clin Orthop Relat Res 152:35–43
25. (2009) Swiss Federal Statistical Office. Hospital statistics between year 2000 and year 2007. Available online underhttp://www.bfs. admin.ch/bfs/portal/de/index/themen/14/03/01/data/01.html and
http://www.bfs.admin.ch/bfs/portal/de/index/themen/14/03/01/key/ 01.html. Accessed 15 Feb 2010
26. Robine JM, Paccaud F (2005) Nonagenarians and centenarians in Switzerland, 1860–2001: a demographic analysis. J Epidemiol Community Health 59:31–37
27. Mathers CD, Murray CJL, Lopez AD et al (2001) World Health Organization global programme on evidence for health policy. Discussion Paper No. 38 http://www.who.int/healthinfo/paper38. pdf. Accessed 13 May 2006
28. Bundesamt für Statistik: Mortality and life expectancy tables.
http://www.bfs.admin.ch/bfs/portal/de/index/themen/01/06/blank/ key/04.html. Accessed 20 Feb 2010
29. Bundesamt für Statistik. Szenarien zur Bevölkerungsentwicklung der Schweiz 2005–2050. http://www.bfs.admin.ch/bfs/portal/de/ index/news/publikationen.Document.83713.pdf. Accessed 14 May 2008
30. Bergstrom U, Jonsson H, Gustafson Y et al (2009) The hip fracture incidence curve is shifting to the right. Acta Orthop 80:520–524
31. Rossouw JE, Anderson GL, Prentice RL et al (2002) Risks and benefits of estrogen plus progestin in healthy postmenopausal women: principal results from the Women's Health Initiative randomized controlled trial. JAMA 288:321–333
32. Beral V, Banks E, Reeves G (2002) Evidence from randomised trials on the long-term effects of hormone replacement therapy. Lancet 360:942–944
33. Meyer HE, Lofthus CM, Sogaard AJ et al (2009) Change in the use of hormone replacement therapy and the incidence of fracture in Oslo. Osteoporos Int 20:827–830
34. Black DM, Cummings SR, Karpf DB et al (1996) Randomised trial of effect of alendronate on risk of fracture in women with existing vertebral fractures. Fracture Intervention Trial Research Group. Lancet 348:1535–1541
35. Black DM, Delmas PD, Eastell R et al (2007) Once-yearly zoledronic acid for treatment of postmenopausal osteoporosis. N Engl J Med 356:1809–1822
36. Melton LJ 3rd, Kanis JA, Johnell O (2005) Potential impact of osteoporosis treatment on hip fracture trends. J Bone Miner Res 20:895–897
37. Chapuy MC, Arlot ME, Duboeuf F et al (1992) Vitamin D3 and calcium to prevent hip fractures in the elderly women. N Engl J Med 327:1637–1642
38. Birks YF, Porthouse J, Addie C et al (2004) Randomized controlled trial of hip protectors among women living in the community. Osteoporos Int 15:701–706
39. Harada A, Mizuno M, Takemura M et al (2001) Hip fracture prevention trial using hip protectors in Japanese nursing homes. Osteoporos Int 12:215–221
40. Kiel DP, Magaziner J, Zimmerman S et al (2007) Efficacy of a hip protector to prevent hip fracture in nursing home residents: the HIP PRO randomized controlled trial. JAMA 298:413–422 41. Tinetti ME, Baker DI, King M et al (2008) Effect of dissemination of
evidence in reducing injuries from falls. N Engl J Med 359:252–261 42. Dargent-Molina P, Favier F, Grandjean H et al (1996) Fall-related factors and risk of hip fracture: the EPIDOS prospective study. Lancet 348:145–149
43. Looker AC, Melton LJ 3rd, Harris TB et al (2010) Prevalence and trends in low femur bone density among older US adults: NHANES 2005–2006 compared with NHANES III. J Bone Miner Res 25:64–71
44. Kannus P, Niemi S, Parkkari J et al (2009) Declining incidence of low-trauma knee fractures in elderly women: nationwide statistics in Finland between 1970 and 2006. Osteoporos Int 20:43–46 45. Kannus P, Palvanen M, Niemi S et al (2008) Stabilizing incidence
of low-trauma ankle fractures in elderly people Finnish statistics in 1970–2006 and prediction for the future. Bone 43:340–342 46. Palvanen M, Kannus P, Niemi S et al (2009) Secular trends in
distal humeral fractures of elderly women: nationwide statistics in Finland between 1970 and 2007. Bone 46:1355–1358
47. Hulme PA, Krebs J, Ferguson SJ et al (2006) Vertebroplasty and kyphoplasty: a systematic review of 69 clinical studies. Spine (Phila Pa 1976) 31:1983–2001
48. (2004) 5-year comparison of the inpatient and outpatient costs between 1999 and 2003. Swiss Health Observatory OBSAN.http:// www.obsan.admin.ch/bfs/obsan/de/index/05/01.Document.105404. pdf. Accessed 16 Jun 2010
49. Cranney A, Tugwell P, Zytaruk N et al (2002) Meta-analyses of therapies for postmenopausal osteoporosis. IV. Meta-analysis of raloxifene for the prevention and treatment of postmenopausal osteoporosis. Endocr Rev 23:524–528
50. Ettinger B, Black DM, Mitlak BH et al (1999) Reduction of vertebral fracture risk in postmenopausal women with osteoporo-sis treated with raloxifene: results from a 3-year randomized clinical trial. Multiple Outcomes of Raloxifene Evaluation (MORE) Investigators. JAMA 282:637–645
51. Siris ES, Harris ST, Eastell R et al (2005) Skeletal effects of raloxifene after 8 years: results from the continuing outcomes relevant to Evista (CORE) study. J Bone Miner Res 20:1514– 1524
52. Tang BM, Eslick GD, Nowson C et al (2007) Use of calcium or calcium in combination with vitamin D supplementation to prevent fractures and bone loss in people aged 50 years and older: a meta-analysis. Lancet 370:657–666
53. Suhm N, Lamy O, Lippuner K (2008) Management of fragility fractures in Switzerland: results of a nationwide survey. Swiss Med Wkly 138:674–683