HAL Id: hal-01161073
https://hal.archives-ouvertes.fr/hal-01161073
Submitted on 8 Jun 2015
HAL is a multi-disciplinary open access
archive for the deposit and dissemination of
sci-entific research documents, whether they are
pub-lished or not. The documents may come from
teaching and research institutions in France or
abroad, or from public or private research centers.
L’archive ouverte pluridisciplinaire HAL, est
destinée au dépôt et à la diffusion de documents
scientifiques de niveau recherche, publiés ou non,
émanant des établissements d’enseignement et de
recherche français ou étrangers, des laboratoires
publics ou privés.
Cynophobic Fear Adaptively Extends Peri-Personal
Space
Marine Taffou, Isabelle Viaud-Delmon
To cite this version:
Marine Taffou, Isabelle Viaud-Delmon. Cynophobic Fear Adaptively Extends Peri-Personal Space.
Frontiers in Psychiatry, Frontiers, 2014, 5, pp.1-1. �10.3389/fpsyt.2014.00122�. �hal-01161073�
Cynophobic fear adaptively extends peri-personal space
Marine Taffou1,2,3,4,5,6,7* and Isabelle Viaud-Delmon1,2,3
1CNRS, UMR 9912, STMS, Paris, France 2IRCAM, UMR 9912, STMS, Paris, France 3
Sorbonne Universités, UPMC Univ Paris 06, UMR 9912, STMS, Paris, France
4
Inserm, U 1127, Paris, France
5
CNRS, UMR 7225, Paris, France
6Sorbonne Universités, UPMC Univ Paris 06, UMR S 1127, Paris, France
7Institut du Cerveau et de la Moelle épinière, ICM, Social and Affective Neuroscience (SAN) Laboratory, Paris, France
Edited by:
Pablo Billeke, Universidad del Desarrollo, Chile
Reviewed by:
Matthew R. Longo, Birkbeck University of London, UK Elisa Canzoneri, EPFL, Switzerland
*Correspondence:
Marine Taffou, UMR 9912 CNRS IRCAM UPMC, Institut de Recherche et Coordination Acoustique/Musique, 1 Place Igor Stravinsky, Paris 75004, France
e-mail: [email protected]
Peri-personal space (PPS) is defined as the space immediately surrounding our bodies, which is critical in the adaptation of our social behavior. As a space of interaction with the external world, PPS is involved in the control of motor action as well as in the protection of the body. The boundaries of this PPS are known to be flexible but so far, little is known about how PPS boundaries are influenced by unreasonable fear. We hypothesized that unreasonable fear extends the neural representation of the multisensory space immedi-ately surrounding the body in the presence of a feared object, with the aim of expanding the space of protection around the body. To test this hypothesis, we explored the impact of unreasonable fear on the size of PPS in two groups of non-clinical participants: dog-fearful and non-fearful participants. The sensitivity to cynophobia was assessed with a question-naire. We measured participants’ PPS extent in the presence of threatening (dog growling) and non-threatening (sheep bleating) auditory stimuli. The sound stimuli were processed through binaural rendering so that the virtual sound sources were looming toward partici-pants from their rear hemi-field. We found that, when in the presence of the auditory dog stimulus, the PPS of dog-fearful participants is larger than that of non-fearful participants. Our results demonstrate that PPS size is adaptively modulated by cynophobia and sug-gest that anxiety tailors PPS boundaries when exposed to fear-relevant features. Anxiety, with the exception of social phobia, has rarely been studied as a disorder of social inter-action. These findings could help develop new treatment strategies for anxious disorders by involving the link between space and interpersonal interaction in the approach of the disorder.
Keywords: emotion, anxiety, cynophobia, auditory–tactile integration, multisensory integration, spatial audition, 3D sound, looming sound
INTRODUCTION
Peri-personal space (PPS) is defined as the space immediately surrounding our bodies (1), through which interaction with the external world occurs. PPS is opposed to the more distant, extra-personal space. Studies on both monkeys and humans have sup-ported this distinction by showing that stimuli within PPS are represented distinctly in the brain from stimuli within extra-personal space (2). In the field of social psychology, this space near the body is referred to as “personal space” and has been described as an area with invisible boundaries that individuals actively maintain around themselves, into which the intrusion of unwanted stimulation causes discomfort (3,4). It has been pro-posed that one of the roles of PPS is to implement a safety margin, which allows for the preparation and coordination of defensive behaviors against unwanted intrusions (2,5).
Recent studies have brought evidence that the boundaries of PPS are flexible. For example, PPS can be extended through tool-use (6–8), by satisfying social interaction with others allowing integrating them to one’s PPS (9) or by depriving individuals of
auditory cues from the external world (10). PPS can also be shrunk by increasing the effort needed to perform a hand movement with wrist weights (11) or by listening to positive emotion-inducing music through headphones leading to a better tolerance of others’ proximity (12).
In the present study, we investigated whether PPS size is influenced by anxiety. We hypothesized that the disproportion-ate experience of fear observed in some anxious disorders may be linked to the introduction of the fear-object in the bound-aries of the individual’s exaggerated PPS. We explored the impact of cynophobic-based anxiety, i.e., the excessive fear of dogs on the size of PPS in two groups of non-clinical participants: dog-fearful and non-dog-fearful participants. We recruited two groups of individuals – individuals sensitive to cynophobia [dog-fearful (DF) group] and individuals non-sensitive to cynophobia [non-fearful (NF) group] – and measured the extent of their PPS in the presence of threatening (dog growling) and non-threatening (sheep bleating) auditory stimuli looming from the rear hemi-field. Participants performed a tactile detection task with their
Taffou and Viaud-Delmon Cynophobic fear and space
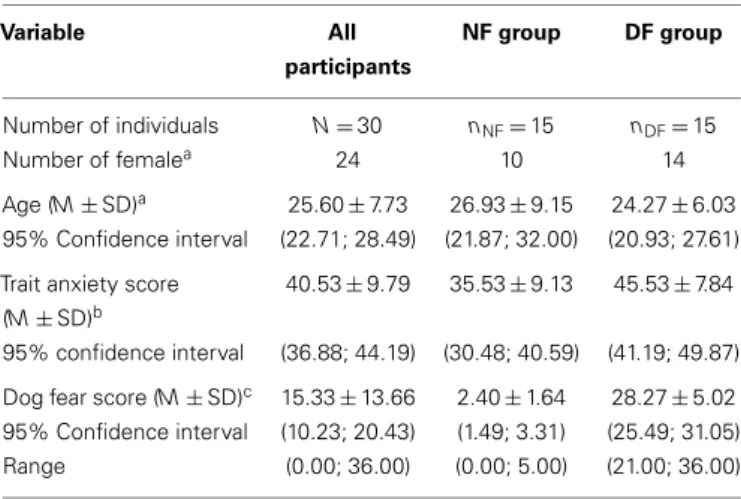
Table 1 | Participants’ characteristics.
Variable All participants NF group DF group Number of individuals N = 30 nNF=15 nDF=15 Number of femalea 24 10 14 Age (M ± SD)a 25.60 ± 7.73 26.93 ± 9.15 24.27 ± 6.03 95% Confidence interval (22.71; 28.49) (21.87; 32.00) (20.93; 27.61)
Trait anxiety score
(M ± SD)b
40.53 ± 9.79 35.53 ± 9.13 45.53 ± 7.84
95% confidence interval (36.88; 44.19) (30.48; 40.59) (41.19; 49.87)
Dog fear score (M ± SD)c 15.33 ± 13.66 2.40 ± 1.64 28.27 ± 5.02
95% Confidence interval (10.23; 20.43) (1.49; 3.31) (25.49; 31.05)
Range (0.00; 36.00) (0.00; 5.00) (21.00; 36.00)
a
Both groups were similar in terms of ratio of female [χ2
test withYates correction: χ2
(1)=1.88, p = 0.171] and age [T-test: t(28)= −0.94, p = 0.354]. b
The trait anxiety score was significantly different between groups [T-test: t(28)=3.22, p = 0.003, d = 1.18].
c
The variance of dog fear scores was different between groups [F(15,15)=9.39,
p = 0.0002], hence a non-parametric test was conducted. The dog fear score was significantly different between groups (Mann–Whitney U-test: U = 0.00, p< 0.001).
left hand while the task-irrelevant sounds were looming toward them from the rear hemi-field. The measure of rear PPS bound-aries with this audiotactile task is particularly appropriate since the auditory component of looming stimuli is especially rele-vant in the rear hemi-field, where the visual monitoring is not possible.
MATERIALS AND METHODS
PARTICIPANTS
Participants were selected on the basis of their scores on a ques-tionnaire exploring the fear of dogs (13). The minimal score on this dog fear questionnaire is 0, with a maximum of 42. Four hundred eighteen individuals (236 females; age: M = 28.87, SD = 10.44) completed this questionnaire. A mean dog fear score (M = 11.67, SD = 9.19) as well as a median dog fear score (Median = 8) were obtained from the questionnaire results, which served as a basis to select participants for the current experiment. Thirty healthy individuals (see details in Table 1) with normal audition and touch participated in the study. All of them were right-handed. None of them had a history of psychiatric disorders, neurological disorders or was currently undergoing medical treatment. Fif-teen individuals had a low dog fear score (score<20th centile) and thus composed the NF group. The remaining 15 individu-als had high dog fear scores (score>80th centile) and composed the DF group. We also used the State Trait Anxiety Inventory (STAI) (14) to measure anxiety levels. Participants completed the trait version several weeks before the experiment. All par-ticipants provided written informed consent prior to the exper-iment, which was approved by the Health Research Ethics Com-mittee (CERES) of Paris Descartes University. Participants were paid 10 C/h.
EXPERIMENTAL SETUP AND STIMULI
We used a modified version of Canzoneri et al.’s audiotactile inter-action task (15). Participants were blindfolded and sat on a chair with their hands palms-down on a table. Both of their hands were aligned with their mid-sagittal plane. Head movements were minimized by means of a headrest.
Auditory stimuli were presented through Sennheiser HD650 headphones. Auditory stimuli were two different (threatening and non-threatening) complex sounds (32 bits, 44100 Hz digitization). The threatening auditory stimulus was dog growling and the non-threatening one was sheep bleating. They were modified using audio editing software (Audacity software)1 to be continuous 3000 ms sounds and to be similar in terms of temporal dynamic and amplitude. The auditory stimuli were then processed through binaural rendering using a non-individual head related transfer functions (HRTF) of the LISTEN HRTF database2. With this
pro-cedure, the virtual sound source location can be manipulated by rendering accurate auditory cues such as frequency spectrum, intensity, and inter-aural differences.
The tactile stimulus was a vibratory stimulus delivered by means of small loudspeaker on the palmar surface of the left index finger of participants. A sinusoid signal was displayed for 20 ms at 250 Hz. With these parameters, the vibration of the loudspeaker was perceivable, but the sound was inaudible. A PC running Pre-sentation® software was used to control the presentation of the stimuli and to record the responses.
DESIGN AND PROCEDURE
First, participants were invited to take part in a 20 min long diag-nostic interview with a clinical psychologist based on the Mini International Neuropsychiatric Interview. This interview was con-ducted to ascertain that no participant met criteria for patholog-ical anxiety disorders. Following this interview, participants were invited to evaluate the valence and arousal of the sounds used in the main experiment. Afterwards they were asked to place their left index finger on the vibrator and to press a button with their right index finger each time a tactile stimulus was detected; this constituted the main experiment. At the end of the experiment, they were asked to again evaluate the valence and arousal of the sounds.
Main experiment
During the main experiment, an auditory stimulus was presented for 3000 ms for each trial. The sound source approached from the rear field, either from the right (135°) or from the left hemi-space (−135°), with a spatial location varying from 520 to 20 cm from the center of the participant’s head. The auditory stimulus was preceded by 1000 ms of silence. A period of silence, with a duration varying between 2700 and 3300 ms, also occurred after the offset of the sound.
In 87.5% of the trials, a tactile stimulus was presented along with the auditory stimuli. The remaining 12.5% trials were catch trials with auditory stimulation only. Participants were instructed to ignore the auditory stimuli and to respond as quickly as possible
1http://audacity.sourceforge.net/
to the tactile stimuli by pressing a button with their right index finger. They were asked to emphasize speed, but to refrain from anticipating. Reaction times (RTs) were measured.
Vibratory tactile stimuli were delivered at different delays start-ing from sound onset. With this procedure, the tactile stimuli were processed when the sound source was perceived at varying dis-tances from participants’ bodies. Given that a looming auditory stimulus speeds up the processing of a tactile stimulus as long as it is perceived near the body, i.e., within PPS (15), we considered the distance at which sounds boosted tactile RTs as a proxy of PPS boundaries.
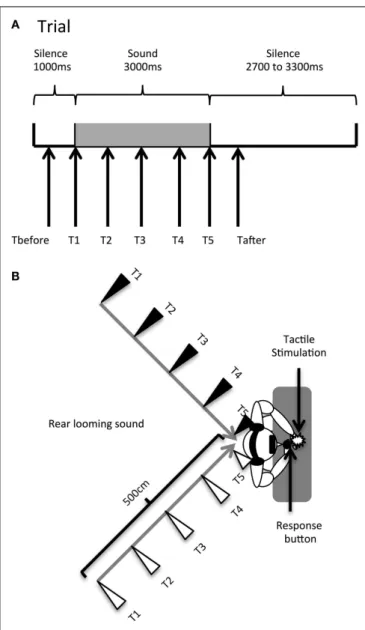
Temporal delays for the tactile stimulus (see Figure 1A) were set as follows: T1 was a tactile stimulation administered simul-taneously with the sound onset (corresponding to 1000 ms from the beginning of the trial); T2, at 750 ms from sound onset (at 1750 ms from trial beginning); T3, at 1500 ms from sound onset (at 2500 ms from trial beginning); T4, at 2250 ms from sound onset (at 3250 ms from trial beginning); and T5, at 3000 ms from sound onset (at 4000 ms from trial beginning). Thus, tactile stim-ulation occurred when the sound source was perceived at different locations with respect to the body, i.e., far from the body at low temporal delays and close to the body at high temporal delays (see Figure 1B). Moreover, in order to measure RTs in the uni-modal tactile condition (without any sound), tactile stimulation was also delivered during the silent periods, preceding or following sound administration, namely at 350 ms (Tbefore) and at 4650 ms
(Tafter) after the beginning of the trial. The total test consisted
of a random combination of eight target stimuli in each of the 28 conditions. The factors were: DELAY (seven levels: Tbefore, T1,
T2, T3, T4, T5, Tafter), HEMISPACE (two levels: left/right), and
SOUND TYPE (two levels: threatening/non-threatening sound). There were a total of 224 trials with a tactile target, randomly intermingled with 32 catch trials. Trials were equally divided in 8 blocks of 32 trials, lasting about 4 min each. After each block, we verified that participants actually perceived the sounds as looming toward them from the rear hemi-field by directly asking them.
Emotional evaluation task
In order to assess any habituation phenomenon and ascertain that participants actually perceived dog growling as threatening and sheep bleating as non-threatening, participants performed a short emotional evaluation task before and after the audiotac-tile test. The two auditory stimuli (non-spatialized) were pre-sented through Sennheiser HD650 headphones; each stimulus was presented only once. The order of stimuli presentation was counter-balanced between subjects. Participants had their eyes closed during the display of the sounds. After the offset of the sound, participants had to indicate the perceived valence and arousal of the sound on a 10 cm visual analogic scale (VAS).
RESULTS
EMOTIONAL EVALUATION TASK
Participants’ responses on the VAS were not normally distributed for each sound stimulus. Hence, we compared the valence and arousal scores between the two sound stimuli and between groups using non-parametric tests.
FIGURE 1 | Audiotactile test. (A). Description of a trial. (B) Experimental
setup. Participants received a tactile stimulus at their hand while task-irrelevant sounds (threatening or non-threatening) approached them from the rear hemi-field, either in the left or the right hemi-space. When participants perceived the tactile stimulation, the looming sounds were located at different distances; this was accomplished by delivering the tactile stimulus at different temporal delays starting from sound onset (Tbefore, T1, T2, T3, T4, T5, Tafter). The sound source location at each temporal
delay condition is indicated by triangles (black triangles for the left hemi-space and white triangles for the right hemi-space).
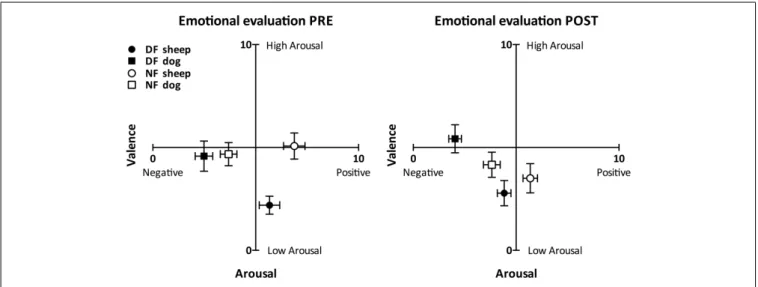
As Figure 2 shows, both groups perceived the dog sound as more negatively valenced than the sheep sound in each emotional evaluation (Wilcoxon test: T< 9.00, p < 0.003 in all cases). The perceived valence of the dog sound was not differ-ent between groups before the audiotactile test (Mann–Whitney test: U = 69.00, p = 0.074) and was significantly more negative in the DF group than in the NF group after the audiotactile test (U = 38.50, p = 0.002). The perceived valence of the sheep sound
Taffou and Viaud-Delmon Cynophobic fear and space
FIGURE 2 | Emotional evaluation task results. This figure depicts the
perceived arousal and valence scores (mean ± SEM) reported by the dog-fearful (in black, nDF=15) and non-fearful (in white, nNF=15) groups in
response to the non-threatening (circles) and threatening (squares) sounds, in the pre- (left) and post-audiotactile task (right) emotional
evaluations. The perceived valence of the dog sound was more negative than the perceived valence of the sheep sound within each group and in both emotional evaluations. Moreover, within each group, while the sheep sound was rated as positive or neutral, the dog sound was rated as negative.
tended to be more positive in the NF group than in the DF group in both emotional evaluations (U = 67.00, p> 0.058 in both cases). The DF group perceived the dog sound as more arousing than the sheep sound (T< 20.00, p < 0.024 in both emotional evalua-tions), while the NF group perceived the two sounds as similarly arousing (T> 38.00, p < 0.211 in both emotional evaluations). There was no significant difference of dog sound arousal scores between the NF and the DF group (U> 77.00, p > 0.146 in both emotional evaluations). As for the sheep sound, it was perceived as more arousing by the NF group compared to the DF group before the audiotactile test (U = 35.00, p = 0.002). After the audiotac-tile test, there was no more significant difference of sheep sound arousal scores between the NF and the DF group (U = 77.00,
p = 0.146).
The results of this control test confirmed that the dog and the sheep sounds were respectively perceived as threatening and non-threatening in both the NF and the DF groups.
MAIN EXPERIMENT
Two participants (one NF and one DF) were excluded from the analyses because they perceived all the stimuli as coming from the frontal hemi-field. Two participants (DF) were also excluded because their mean RTs were substantially elevated, giving us rea-son to suspect that they did not correctly perform the task. As the rates of false alarms and omissions were very low – 0.38 and 0.58%, respectively – participants were extremely accurate in performing the task. Consequently, the performances were only analyzed in terms of RT. One participant (DF), however, had a high rate of misses (8.48%) and was therefore excluded from the RT analy-ses. The analyses on the audiotactile test were conducted on the 25 remaining participants (nNF=14; nDF=11). RTs non-precise
measures due to interruptions from operating systems or device drivers were trimmed from the analyses. Mean RTs to tactile targets
were calculated for each DELAY level and separately for each par-ticipant. RTs exceeding more than two standard deviations from the mean RT were considered outliers and also trimmed from the analyses (4.54% of the trials).
Mean RTs to tactile target were calculated for each of the 28 conditions (2 SOUND TYPE*2 HEMISPACE*7 DELAY). We first conducted an ANOVA on the mean RTs, with the between subject factor GROUP (NF/DF) and the within subject factors SOUND TYPE (threatening/non-threatening stimulus), HEMI-SPACE (left/right) and DELAY (Tbefore, T1, T2, T3, T4, T5, Tafter).
The global effect of DELAY was significant [F(6,138)=31.42, p< 0.001, η2p = 0.577] suggesting that RTs were influenced by
the time of tactile stimulation delivery. RTs in the unimodal con-dition Tbefore(391.69 ± 49.23 ms) were significantly slower than
RTs in the bimodal conditions T1, T2, T3, T4, and T5 (post hoc Newman–Keuls’ test: p< 0.001 in all cases). RTs in the unimodal condition Tafter(353.92 ± 33.77 ms) were significantly faster than
RTs at Tbefore (post hoc Newman–Keuls’ test: p< 0.001). Given
that RTs at Tafterwere significantly slower than RTs at T5 (post hoc
Newman–Keuls’ test: p< 0.001), we can exclude the possibility that participants were faster at late delays because of the increas-ing probability of receivincreas-ing a tactile stimulation along trials. The difference in tactile RTs between Tbeforeand Taftercan be explained
by the semantic content of the looming sounds, which places an animal in the environment; at Tafter, participants potentially
considered the animal as close to them but silent.
We then conducted an ANOVA on the mean RTs measured in the bimodal trials only, with the between subject factor GROUP (NF/DF) and the within subject factors SOUND TYPE (threatening/non-threatening stimulus), HEMISPACE (left/right) and DELAY (T1, T2, T3, T4, T5). The global effect of DELAY was significant [F(4,92)=18.24, p< 0.001,η2p =0.442]. The three-way
[F(4,92)=4.853, p = 0.001,η2p =0.174] suggesting that RTs were
differently modulated in the NF and the DF group depending on the perceived position of sound in space and as a func-tion of whether the auditory stimulus was threatening or not. In the threatening condition, DF group’s RTs were significantly faster when the tactile stimulus occurred at T2, T3, T4, and T5 compared to when the tactile stimulus occurred at T1 (post hoc Newman–Keuls’ test: p< 0.001 in all cases). Contrastingly, in the non-threatening condition, DF group’s RTs were faster when the tactile stimulus occurred at T4 and T5 compared to when it occurred at T1, T2, and T3 (post hoc Newman–Keuls’ test: p< 0.05 in all cases). RTs at T2 were faster in the threatening condition com-pared to the non-threatening condition (post hoc Newman–Keuls’ test: p = 0.038). RTs were not different between the threatening and non-threatening condition for the longest delays, i.e., closest distances (T3, T4, and T5) or for the smallest delay T1, i.e., the greater distance (post hoc Newman–Keuls’ test: p> 0.217 in all cases). These results suggest that, in the DF group, the threatening sound began to affect tactile RTs at further distances compared to the threatening sound. In both the threatening and non-threatening condition, the NF group’s RTs were significantly faster when the tactile stimulus occurred at T5 compared to when the tactile stimulus occurred at T1, T2, T3, and T4 (post hoc Newman– Keuls’ test: p< 0.002 in all cases), suggesting that the distance at which the sound began to affect tactile RTs was similar in both the threatening and the non-threatening conditions.
In order to further investigate the influence of the different sounds on tactile RTs, we fitted participants’ mean tactile RTs at the five delays with a sigmoid function using the same pro-cedure as Canzoneri et al. The sigmoid function was described by the following equation: y(x) = ymin+ymax×e(x−xi/b)
1+e(x−xi/b) where x
represents the independent variable (i.e., the delay of tactile stim-ulation from sound onset in ms), y the dependent variable (i.e., tactile RT), ymin and ymax the lower and upper plateau of the
sigmoid, xi the value of the abscissa at the inflection point of
the sigmoidal curve (i.e., the value of x at which y = ymin+ymax
2 )
and b is the slope at the inflection point. We estimated the para-meters xi and b for each participant’s in each sound condition
(threatening/non-threatening) and assigned a priori ymin and ymax to the minimum and maximum values of each data set.
The sigmoid function better described participants’ data than a linear function [y(x) = y0×x + a, where y0 is the intercept at x = 0 and a is the slope) as indicated by the result of the
com-parison of the root mean square errors (RMSEsigmoid=7.80 ms,
RMSElinear=8.69 ms, Wilcoxon test: T = 149.00, p = 0.001). The
parameter xiwas computed as a measure of the temporal delay,
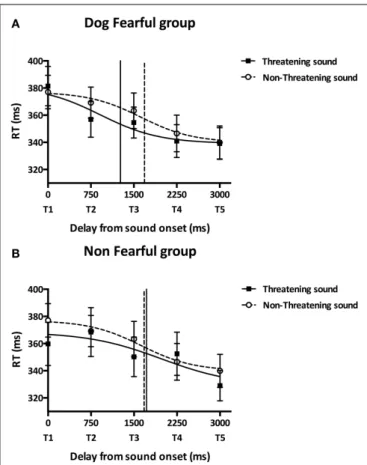
i.e., the distance, at which sound starts affecting tactile RTs and was analyzed in order to quantify PPS boundaries. As Figure 3A shows, DF group’s xiwas lower in the threatening compared to the
non-threatening condition [t(8)= −1.89, p = 0.030, one-tailed,
two participants were excluded due to bad fitting] suggesting that the boundaries of DF group’s PPS in the threatening condition are farther from the participants than in the non-threatening condition. As Figure 3B shows, NF group’s xi did not
signif-icantly differ between sound conditions [t(9)=0.19, p = 0.851,
two-tailed, four participants were excluded due to bad fitting]
FIGURE 3 | Main experiment results. Participants performed the
audiotactile task by responding to a tactile stimulation while a task-irrelevant threatening (dog growling) or non-threatening (sheep bleating) sound was looming toward them. This figure reports the mean tactile reactions times (±SEM) for the dog-fearful (top graph) and non-fearful group (bottom graph) in the threatening (black square) or non-threatening (white circles) sound conditions as a function of the delay of tactile stimulation delivery from sound onset. Reaction times were fitted with a sigmoid function. The inflection point abscissa of the sigmoid curves was computed as a measure of the temporal delay, i.e., the distance, at which sound starts affecting tactile RTs and was analyzed in order to quantify PPS boundaries.(A) Dog-fearful group results. The abscissa of the
curve’s inflection point was lower in the threatening sound condition (1266.81 ± 287.57 ms, black vertical line) compared to the non-threatening sound condition (1685.49 ± 548.41 ms, dashed vertical line) meaning that PPS boundaries were farther from participants in the presence of the dog sound than in the presence of the sheep sound.(B) Non-fearful group
results. The abscissa of the curve’s inflection point did not significantly differ between the threatening (1717.70 ± 413.23 ms, black vertical line) and the non-threatening (1675.15 ± 596.56 ms, dashed vertical line) sound conditions suggesting that participants’ PPS size was similar in the presence of the dog and the sheep sounds. While the dog-fearful group’s PPS was larger than the non-fearful group’s PPS in the presence of the dog sound, there was no significant difference in PPS size between groups in the presence of the sheep sound.
suggesting that the NF group’s PPS size was similar in the threaten-ing and in the non-threatenthreaten-ing conditions. While the DF group’s PPS was larger than the NF group’s PPS in the threatening condi-tion [t(17)= −2.73, p = 0.007, one-tailed], there was no significant
Taffou and Viaud-Delmon Cynophobic fear and space
condition [t(17)=0.04, p = 0.485, one-tailed]. Participants’
dif-ference between xiin the non-threatening condition and xiin the
threatening condition, i.e., the extension of PPS boundaries, was not significantly correlated with trait anxiety scores (r = 0.318,
p = 0.184).
DISCUSSION
Approaching unpleasant sounds trigger a particularly intense emotional response suggesting an activation of defensive responses (16). Previous results demonstrated that at distances wherein indi-viduals non-sensitive to cynophobia still feel comfortable, a virtual visual looming dog triggers high discomfort for individuals sensi-tive to cynophobia (17). This variance in distance, together with PPS’s proposed role of implementing a safety margin around the body, leads us to hypothesize that fear-object looming toward the body will expand PPS boundaries.
Consistently, our results suggest that looming feared elements extend PPS; the space that individuals consider as belonging to themselves enlarges when they perceive a feared object. This result seems consistent with previous results demonstrating that indi-viduals underestimate the time at which a visual looming stimulus will collide with them when the stimulus is threatening (snakes, spiders, angry faces) compared to when it is non-threatening (but-terflies, rabbits, neutral faces) (18,19). Vagnoni et al. also show that this underestimation of time-to-collision is bigger for individuals who are fearful of the threatening stimulus; the size of the underes-timation is linked to individuals’ level of snakes- and spider-related anxiety. If PPS is extended, the distance between the feared object and PPS boundaries is smaller. Consequently, the encounter with PPS occurs sooner. Thus, the fact that an approaching feared stim-ulus is perceived as colliding sooner seems coherent with the PPS boundaries being farther.
Peri-personal space has also been shown as being extended after a satisfying social interaction (9). In our experiment, the expan-sion of PPS seems to aim at keeping unwanted and potentially harmful stimuli far from the body (i.e., outside PPS) and at allow-ing additional time for triggerallow-ing defensive behaviors. In Teneggi et al. study, individuals’ PPS boundaries did not enlarge in order to keep the other individual outside of PPS but rather to integrate them within it. In this case, the expansion of PPS would be linked to the implementation of approach behaviors.
Although PPS seems to be linked to emotional processes (20) and is thought to have a protective function, little is known on how PPS boundaries are influenced by anxiety. It has been shown that sensitivity to claustrophobic fear is related to larger PPS size as measured by a line bisection task (21). In their study, they observed a positive correlation between PPS size and the level of this space-related anxiety that is claustrophobic fear. This link was not observed with PPS size as measured by the hand-blink reflex defensive response (22). They instead observed a link between the size of PPS and trait anxiety. In contrast, results collected dur-ing a stop-approach task did not support a modulation of PPS size by anxiety (23). Our findings suggest that anxiety selectively influences PPS: sensitivity to cynophobia expands PPS boundaries when there is a dog stimulus in the environment. The diversity of results is potentially explained by the variety of experimental settings, which deliver different amount of fear-relevant features.
Though we studied a non-clinical sample, this situation-dependent effect of dog fear suggests that, at least in cynophobia, selective distortion of PPS is involved. Intrusion in PPS triggers high discomfort and regulative behaviors such as flight (5). When not constrained by the physical environment, individuals typically prevent undesired components of the environment from entering their PPS by adjusting their distance from them. Over-projecting PPS could allow more time to prepare defensive or avoidant behav-iors in case of attack. The expansion of PPS in the presence of feared elements fits with the proposed protective function of PPS, i.e., assuring a margin of safety around the body (2, 5). What is perceived to be a disproportionate reaction from cynophobic individuals in the presence of dogs may be partially attributed to a normal reaction to the intrusion of an undesirable stimulus in an enlarged PPS.
Clinical psychology has implicitly used the notion of the influ-ence of anxiety on PPS with the widely used Behavioral Assessment Test (BAT). This test is used to assess the level of fear of the patient in relation to a phobic object that is coming closer to him/her. When comparing the distance between the individual and the feared object at the beginning of therapy to the distance at the end of the therapy, the BAT serves as a measure of success [e.g., Ref. (24)]. A positive treatment outcome, as revealed by the BAT, probably reflects a change in the boundaries of PPS. The accept-able distance with the feared object is therefore a critical criterion in the assessment of severity of phobias. Our results suggest that PPS distortion could play a role in several phobias and that shrink-ing the oversized PPS could be a treatment strategy when facshrink-ing fear-relevant situations.
Because anxiety regulation is shaped by the social context, we think it is important to take social distances into account when appraising anxiety mechanisms. Space is not a unitary construct in the brain and its neural representation is parceled across dif-ferent compartments according to the behavioral interactions we have with them (25). Interactions between self and others can spread across the different compartments of space. It has already been suggested that space perception and representation might be distorted by anxiety [see Ref. (26) for a review]. While it is mainly the influence of anxiety on extra-personal space perception that has been studied [e.g., Ref. (27,28)], it seems that PPS is another compartment of space that is distorted by anxiety.
ACKNOWLEDGMENTS
This research was supported by the EU FP7-ICT-2011-7 project VERVE (http://www.verveconsortium.eu/), grant no. 288910. The research leading to these results has received funding from the program “Investissements d’avenir” ANR-10-IAIHU-06. We are grateful to Emmanuel Fléty for his help with the apparatus for tactile stimulation. We thank Olivier Warusfel and Thibaut Car-pentier for their help on the elaboration of spatialized auditory stimuli through binaural rendering. We thank Cassandra Visconti for proof-reading this manuscript for American English spelling.
REFERENCES
1. Rizzolatti G, Fadiga L, Fogassi L, Gallese V. The space around us. Science (1997)
2. Graziano MSA, Cooke DF. Parieto-frontal interactions, personal space, and defensive behavior. Neuropsychologia (2006) 44(6):845–59. doi:10.1016/j. neuropsychologia.2005.09.009
3. Hall ET. The Hidden Dimension. New York: Doubleday (1966).
4. Hayduk LA. Personal space: an evaluative and orienting overview. Psychol Bull (1978) 85(1):117–34. doi:10.1037//0033-2909.85.1.117
5. Aiello JR. Human spatial behavior. In: Stokols D, Altman I, editors.
Hand-book of Environmental Psychology. New York, NY: John Wiley & sons (1987).
p. 389–504.
6. Bassolino M, Serino A, Ubaldi S, Làdavas E. Everyday use of the computer mouse extends peripersonal space representation. Neuropsychologia (2010)
48(3):803–11. doi:10.1016/j.neuropsychologia.2009.11.009
7. Maravita A, Iriki A. Tools for the body (schema). Trends Cogn Sci (2004)
8(2):79–86. doi:10.1016/j.tics.2003.12.008
8. Serino A, Bassolino M, Farnè A, Làdavas E. Extended multisensory space in blind cane users. Psychol Sci (2007) 18(7):642–8. doi:10.1111/j.1467-9280.2007. 01952.x
9. Teneggi C, Canzoneri E, Di Pellegrino G, Serino A. Social modulation of periper-sonal space boundaries. Curr Biol (2013) 23(5):406–11. doi:10.1016/j.cub.2013. 01.043
10. Lloyd DM, Coates A, Knopp J, Oram S, Rowbotham S. Don’t stand so close to me: the effect of auditory input on interpersonal space. Perception (2009)
38(4):617–20. doi:10.1068/p6317
11. Lourenco SF, Longo MR. The plasticity of near space: evidence for contraction.
Cognition (2009) 112(3):451–6. doi:10.1016/j.cognition.2009.05.011
12. Tajadura-Jiménez A, Pantelidou G, Rebacz P, Västfjäll D, Tsakiris M. I-space: the effects of emotional valence and source of music on interpersonal distance.
PLoS One (2011) 6(10):e26083. doi:10.1371/journal.pone.0026083
13. Viaud-Delmon I, Znaïdi F, Bonneel N, Doukhan D, Suied C, Warusfel O, et al. Auditory-visual virtual environments to treat dog phobia. The Seventh
Interna-tional Conference on Disability, Virtual Reality and Associated Technologies with ArtAbilitation 2008. Porto, Portugal (2008). p. 119–24.
14. Spielberger CD, Gorsuch RL, Lushene PR, Vagg PR, Jacobs AG. Manual for the
State-Trait Anxiety Inventory (Form Y). Palo Alto, CA: Consulting Psychologists
Press (1983).
15. Canzoneri E, Magosso E, Serino A. Dynamic sounds capture the boundaries of peripersonal space representation in humans. PLoS One (2012) 7(9):e44306. doi:10.1371/journal.pone.0044306
16. Tajadura-Jiménez A, Väljamäe A, Asutay E, Västfjäll D. Embodied auditory per-ception: the emotional impact of approaching and receding sound sources.
Emotion (2010) 10(2):216–29. doi:10.1037/a0018422
17. Taffou M, Guerchouche R, Drettakis G, Viaud-Delmon I. Auditory–visual aver-sive stimuli modulate the conscious experience of fear. Multisens Res (2013)
26:347–70. doi:10.1163/22134808-00002424
18. Brendel E, DeLucia PR, Hecht H, Stacy RL, Larsen JT. Threatening pictures induce shortened time-to-contact estimates. Atten Percept Psychophys (2012)
74(5):979–87. doi:10.3758/s13414-012-0285-0
19. Vagnoni E, Lourenco SF, Longo MR. Threat modulates perception of looming visual stimuli. Curr Biol (2012) 22(19):R826–7. doi:10.1016/j.cub.2012.07.053 20. Kennedy DP, Gläscher J, Tyszka JM, Adolphs R. Personal space regulation by the
human amygdala. Nat Neurosci (2009) 12(10):1226–7. doi:10.1038/nn.2381 21. Lourenco SF, Longo MR, Pathman T. Near space and its relation to
claustrophobic fear. Cognition (2011) 119(3):448–53. doi:10.1016/j.cognition. 2011.02.009
22. Sambo CF, Iannetti GD. Better safe than sorry? The safety margin surround-ing the body is increased by anxiety. J Neurosci (2013) 33(35):14225–30. doi:10.1523/JNEUROSCI.0706-13.2013
23. Dosey MA, Meisels M. Personal space and self-protection. J Pers Soc Psychol (1969) 11(2):93–7. doi:10.1037/h0027040
24. Lang PJ, Lazovik AD. Experimental desensitization of a phobia. J Abnorm Soc
Psychol (1963) 66(6):519–25. doi:10.1037/h0039828
25. Previc FH. The neuropsychology of 3-D space. Psychol Bull (1998)
124(2):123–64. doi:10.1037/0033-2909.124.2.123
26. Viaud-Delmon I, Venault P, Chapouthier G. Behavioral models for anxiety and multisensory integration in animals and humans. Prog Neuropsychopharmacol
Biol Psychiatry (2011) 35(6):1391–9. doi:10.1016/j.pnpbp.2010.09.016
27. Jones RB, Humphris G, Lewis T. Do agoraphobics interpret the environment in large shops and supermarkets differently? Br J Clin Psychol (1996) 35(Pt 4):635–7. doi:10.1111/j.2044-8260.1996.tb01220.x
28. Kallai J, Makany T, Csatho A, Karadi K, Horvath D, Kovacs-Labadi B, et al. Cog-nitive and affective aspects of thigmotaxis strategy in humans. Behav Neurosci (2007) 121(1):21–30. doi:10.1037/0735-7044.121.1.21
Conflict of Interest Statement: The authors declare that the research was conducted
in the absence of any commercial or financial relationships that could be construed as a potential conflict of interest.
Received: 02 July 2014; accepted: 21 August 2014; published online: 03 September 2014. Citation: Taffou M and Viaud-Delmon I (2014) Cynophobic fear adaptively extends peri-personal space. Front. Psychiatry 5:122. doi: 10.3389/fpsyt.2014.00122 This article was submitted to Systems Biology, a section of the journal Frontiers in Psychiatry.
Copyright © 2014 Taffou and Viaud-Delmon. This is an open-access article distributed under the terms of the Creative Commons Attribution License (CC BY). The use, dis-tribution or reproduction in other forums is permitted, provided the original author(s) or licensor are credited and that the original publication in this journal is cited, in accordance with accepted academic practice. No use, distribution or reproduction is permitted which does not comply with these terms.