HAL Id: hal-01893580
https://hal-univ-orleans.archives-ouvertes.fr/hal-01893580
Submitted on 20 Mar 2019HAL is a multi-disciplinary open access archive for the deposit and dissemination of sci-entific research documents, whether they are pub-lished or not. The documents may come from teaching and research institutions in France or abroad, or from public or private research centers.
L’archive ouverte pluridisciplinaire HAL, est destinée au dépôt et à la diffusion de documents scientifiques de niveau recherche, publiés ou non, émanant des établissements d’enseignement et de recherche français ou étrangers, des laboratoires publics ou privés.
An experimental study on turbulent premixed
expanding flames using simultaneously Schlieren and
tomography techniques
Pierre Brequigny, Charles Endouard, Christine Mounaïm-Rousselle, Fabrice
Foucher
To cite this version:
Pierre Brequigny, Charles Endouard, Christine Mounaïm-Rousselle, Fabrice Foucher. An exper-imental study on turbulent premixed expanding flames using simultaneously Schlieren and to-mography techniques. Experimental Thermal and Fluid Science, Elsevier, 2018, 95, pp.11 - 17. �10.1016/j.expthermflusci.2017.12.018�. �hal-01893580�
Draft:An experimental study on turbulent premixed expanding
flames using simultaneously Schlieren and Tomography
techniques
Pierre Brequigny*, Charles Endouard*, Christine Mounaïm-Rousselle*, Fabrice Foucher*
* Univ. Orléans, PRISME, EA 4229, F45072 Orléans, France
Abstract
As in most of industrial cases, in Spark-Ignition (SI) engines, the expansion of premixed
flames is strongly affected by turbulence flow fields. However, as the flame radius and
curvature are non-negligible during the combustion development, global stretch effect can
drastically change the turbulent flame propagation speed. In this paper, spherical turbulent
premixed flames are studied inside a constant-volume vessel for a wide range of air-isooctane
mixture and initial turbulence by using simultaneously Mie scattering tomography and 2-views
Schlieren techniques. With the 2-views Schlieren diagnostic, the flame volume can be reconstructed and a more ‘real’ flame radius can be determined. The comparison between this
radius, which is more usually determined by only 1-view Schlieren, and the one obtained by
tomography was possible, and enabled to select non-conveyed flames with a global spherical shape. In the first part, the values of the correction factor for Schlieren images, first introduced
by Bradley et al. in 2003, is discussed as function of the turbulent intensity and initial pressure.
In the second part, the effect of turbulent intensity and initial pressure for isooctane/air mixtures
on flame propagation speed evolution is evaluated as function of the stretch rate.
Keywords
Spherical expanding flame, Turbulent flame speed, iso-octane-air mixture
1. Introduction
As expanding turbulent premixed flames occur in Spark Ignition engines, this flame configuration remains an interesting research issue to globally improve Internal Combustion
high diluted environment, are studied nowadays and still require better knowledge of their
propagation in both laminar and turbulent regimes. The effect of initial conditions on the
laminar burning speed and Markstein length has been previously studied by many authors [1–
5]. The experimental work done with different fuels in a wide range of conditions highlights
strong impact of the stretch on flame propagation. As in the work of Karlovitz et al. [6] and
Markstein [7], the flame stretch can be easily linked to the laminar flame speed [8–10].
However, the acceleration mechanism in the case of expanding turbulent flames is more
complex, since the flame front of turbulent expanding flames is affected both by a mean global
stretch rate due to the growth of the mean flame front radius, and by local stretch rates related
to the wrinkling of the flame front. Several recent studies [11–17] focused on the flame response
to the stretch for different fuels and conditions but investigation is still needed. This paper
presents new experimental turbulent flame speed measurements in a constant-volume
combustion chamber by using simultaneous Mie-scattering tomography and 2-Views Schlieren
technique. Isooctane, usual gasoline surrogate was also chosen due to its dynamic response to
stretch between lean and rich conditions. The objective of this paper is twofold. First, by using
simultaneously Tomography and a 2 Views Schlieren diagnostic, the correction factor proposed
by Bradley et al. [12] to estimate turbulent burning speed from Schlieren images is discussed,
and a first correlation to determine this correction factor is proposed. Secondly, the effect of
initial pressure on the flame speed as function of stretch, for different turbulent intensities is
investigated. And the effect of the correction factor is also discussed.
2. Experimental set-up 2.1. Combustion vessel
Experiments were conducted in a high-pressure/high-temperature combustion vessel used
for both laminar and turbulent premixed flame propagation investigations. Included below is a
in [4]. The combustion chamber is a spherical stainless steel vessel with an inner diameter of
200 mm. A heater wire resistance located on the outer surface of the sphere is used to heat initial
gases until a maximum temperature of 473 K. The temperature fluctuation of the mixture is
estimated less than 2 K for the target initial temperature. Initial pressure inside the vessel is
limited to 10 bar with a maximum deviation between the effective and the set-point initial
pressure of about 3%. The isooctane/air mixture is introduced in the vessel by means of different
flowmeters [4]. The mixture is ignited by a spark produced between two 0.5 mm diameter
tungsten electrodes with a charge time of the ignition coil fixed to 3 ms for all cases.
The vessel is equipped with four optical quartz windows providing optical access for the
implementation of laser diagnostic techniques. Turbulence is generated by six identical
four-blade fans (40 mm diameter) located in a regular octahedral configuration, close to the wall of
the combustion chamber. The fans direct the flow toward the center of the vessel. Each fan
speed can be accurately adjusted between 1000 and 17000 rpm with an accuracy of ±0.1%. The
fans run continuously during combustion propagation.
In previous work [18], the turbulent flow was fully characterized by using Laser Doppler
Velocimetry and Particle Imaging Velocimetry in non-reactive conditions. It was particularly
shown that the fans generated homogeneous and isotropic turbulence in a central portion of 40
mm diameter. In [18], the turbulence intensity was found to be proportional to the rotational
fan speed but the integral length scale 𝐿𝑇 independent of the fan speed and equal to 3.4 𝑚𝑚.
3. High speed image acquisition and post-processing
In the first part of this study, two High Speed (HS) imaging systems were used: first one
consists in 2-Views Schlieren one (Fig. 1). Each Schlieren pathway is made by using a LED
(CBT120), coupling with a 1 mm pin-hole to guarantee a point source and two convex metallic
and two lenses (200 mm and 160 mm) allow the focusing of images directly on the CMOS chip.
With this arrangement, both views can be simultaneously recorded with only one HS camera
(Phantom v1610) at full resolution (1024x800 pixels²) and magnification ratio of 0.1 mm per
pixel. As one objective of this study is to compare the wrinkled radius from the Schlieren
images, resulting of 3D integration along the optical pathway and from planar Mie scattering
images, a second optical arrangement was set-up. A laser sheet from a HS Nd-Yag laser
(Quantronix dual-Hawk HP) passes between both electrodes with a 4° tilt angle to prevent any
interaction with the Schlieren arrangement. A second HS camera mounted with a Scheimpflug
and a 200 mm Nikon macro-lens records Mie scattering images (from silicon oil seeding
droplets) with a delay of only 5 µs relative to Schlieren images to prevent any light interaction.
The optical configuration for the first part of the study is identified as “Setup 1”. The main
advantage of this setup is to select flames that keep a global spherical shape during the
propagation and are not conveyed out of the flame sheet, thus enabling to capture a
representative contour of the whole flame. With such a technique, it is then possible to
determine the correction to be applied to Schlieren images in order to avoid an overestimation
of the radius due to the projection of a 3D flame in a 2D plan. In the second part of this study,
only one Schlieren view, identified as “Setup 2”, was used as it is a simpler setup, but also to
improve the correction factor determined from the first study with the Setup 1.
Schlieren and tomographic images were post-processed by using Matlab routines to extract
the flame contour. As described in [12], mean flame radius 𝑅𝑎 is derived from the circle of area
equivalent to the flame area inside the contour. 𝑅𝐴,𝑆 = √𝐴𝑆/𝜋 and 𝑅𝐴,𝑇 = √𝐴𝑇/𝜋 are
respectively flame radii determined from Schlieren and tomographic techniques based on flame
surface, A and 𝑅𝑉,𝑆 = (3𝑉𝑆⁄4𝜋)1/3 based on the flame volume estimated from 2-Views
Schlieren technique is also defined. As shown in Fig. 2, from both side and front views
function of the z direction. These ellipses, indicated in grey in Figure 2, are fitted through four
points defined as the four points of both Schlieren contours projection.
Figure 1. Experimental setup 1. L1 and L2: LED, PM: parabolic mirror, C1 Phantom v1610
Camera, C2 Phantom v1210 Camera, FM: Dot point, LE: Lenses. Setup 2 uses only the optical path coming from L1.
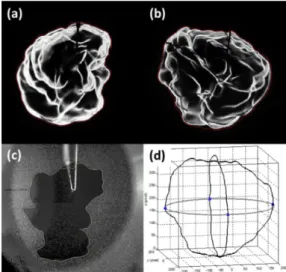
Figure 2. Example of images. (a) front Schlieren image, (b) side Schlieren image, (c) Mie
scattering image from the side view, (d) reconstructed flame volume.
The turbulent burning speed is obtained from the time derivation of the temporal evolution of
radius flame 𝑉𝑇= 𝑑𝑅𝑎/𝑑𝑡. Because a propagating flame surface undergoes global curvature,
local curvature and flow field strain, the total stretch quantifying the turbulence-flame
interaction, can be separated into 3 terms according to Chaudhuri et al. [17]:
𝜅 = 𝑆⏟𝐿𝜅 𝑠𝑡𝑟𝑒𝑡𝑐ℎ 𝑟𝑎𝑡𝑒 𝑏𝑦 𝑐𝑢𝑟𝑣𝑎𝑡𝑢𝑟𝑒: 𝜅𝑐,𝑅 − (v.n)𝜅⏟ 𝑛𝑜𝑟𝑚𝑎𝑙 𝑠𝑡𝑟𝑎𝑖𝑛 𝑟𝑎𝑡𝑒: 𝜅𝑛 ⏞ 𝑠𝑡𝑟𝑒𝑡𝑐ℎ 𝑟𝑎𝑡𝑒 𝑏𝑦 𝑐𝑢𝑟𝑣𝑎𝑡𝑢𝑟𝑒: 𝜅𝜅 + ∇⏟𝑡. vt 𝑡𝑎𝑛𝑔𝑒𝑛𝑡𝑖𝑎𝑙 𝑠𝑡𝑟𝑎𝑖𝑛 𝑟𝑎𝑡𝑒: 𝜅𝑡 (1)
The first term is due to curvature c,R, and the second and third terms of Eq. (1) represent all the
stretch rate contributions by the strain rate, s. The first term c,R could be also split into two
parts: the stretch rate due to local wrinkling and the strain rate due to the macroscopic flame
shape. In the case of spherical flame propagation, the mean radius of the flame during the first
part of the propagation is small but generates strong curvature. This curvature tends to decrease
rapidly with the increase of the flame radius. By considering the contribution of flame
macroscopic geometry, c,R is defined the same way as for spherical laminar flame :
𝜅𝑐,𝑅 = 2 𝑅𝐴
𝑑𝑅𝐴
𝑑𝑡 (2)
4. Results and discussions
4.1. Correction factor estimation
All investigated experimental conditions using the 2 Views-Schlieren technique
simultaneously with Mie-Scattering tomography are summarized in Table 1. Mixtures were
selected because the unstretched laminar burning speed SL0is the same but Lewis numbers Leeff
and Markstein lengths 𝐿𝑏 are different. 𝑆𝐿0 and 𝐿
𝑏 were obtained using data and correlations
from previous studies [4,19,20] except for 𝛷 =1.46 where Markstein length was not determined
due to high cellularity and the correlation is not usable. Lewis numbers were calculated using
the method of Bechtold and Matalon [21]. A synthetic EGR (Exhaust Gas Recirculation)
mixture was used with 12.4% CO2, 14% H2O and 73.6 %N2 in volume. All flames can be
considered between the thin reaction zone and the corrugated flamelet zone, in the flamelet
regime from Borghi-Peters diagram [22,23]. In order to validate the use of an equivalent radius
obtained from the surface of Schlieren contours to estimate turbulent flame speed, the mean
radii (𝑅𝐴,𝑆, 𝑅𝐴,𝑇, 𝑅𝑉,𝑆 ) are displayed in Figure 3. They are given with an uncertainty of +/- 0.2
P (MPa) Φ EGR % SL0 (cm/s) u’ (m/s) Lb (mm) Leeff 𝛿𝐿 [µm] u’/SL 0 L T/𝛿𝐿 Correction factor for Schlieren data 0.1 0.8 0 39.2 0.52 1.1 2.52 95 1.33 35.8 0.77 0.1 0.8 0 39.2 1.04 1.1 2.52 95 2.65 35.8 0.70 0.1 0.8 0 39.2 1.39 1.1 2.52 95 3.55 35.8 0.684 0.5 0.8 0 28.3 0.52 0.34 2.52 26 1.84 130.8 0.715 0.5 0.8 0 28.3 1.04 0.34 2.52 26 3.67 130.8 0.68 0.1 1.0 0 53.6 0.52 0.78 1.98 67.8 0.97 50.1 0.791 0.1 1.0 0 53.6 1.04 0.78 1.98 67.8 1.94 50.1 0.73 0.1 1.0 0 53.6 1.39 0.78 1.98 67.8 2.59 50.1 0.71 0.1 1.0 7.5 39.4 0.52 1 2 93 1.32 36.6 0.71 0.1 1.0 7.5 39.4 1.04 1 2 93 2.64 36.6 0.71 0.1 1.0 7.5 39.4 1.39 1 2 93 3.53 36.6 0.724 0.5 1.0 7.5 28.4 0.52 0.27 2 26 1.83 130.8 0.77 0.5 1.0 7.5 28.4 1.04 0.27 2 26 3.66 130.8 0.67 0.1 1.46 0 39.2 0.52 -1.5 1.3 88 1.33 38.6 0.795 0.1 1.46 0 39.2 1.04 -1.5 1.3 88 2.65 38.6 0.705
Table 1. Experimental conditions for the Setup 1
Figure 3. Example of different radii time evolution for lean and rich mixtures (P= 0.1 MPa,
T=423K, u’=1.04 m/s).
First, it is interesting to note that no difference is distinguishable between the radius
obtained from 2-Views or 1-View Schlieren technique. This confirms that the equivalent radius
evolution obtained with 1-View Schlieren technique enables to characterize the whole volume.
On the other hand, radii calculated from tomography are smaller than those from Schlieren
technique due to the difference in these optical techniques themselves: 2D cut or 3D projection.
sheet plan and that keeps globally a spherical shape during the propagation in order to properly
determine a correction factor for the Schlieren images. Indeed, Bradley et al. [12] suggested to
correct the radius by a correction factor C as 𝑅𝐴 = 𝐶. 𝑅𝐴,𝑆. This correction factor is calculated
by averaging the ratio of the tomographic flame speed to the Schlieren flame speed on the flame
propagation duration as follows:
𝐶 = ⟨𝑑𝑅̅̅̅̅̅̅𝐴,𝑇
𝑑𝑅̅̅̅̅̅̅𝐴,𝑆⟩𝑝𝑟𝑜𝑝𝑎𝑔𝑎𝑡𝑖𝑜𝑛 (3)
Because the mean curvature stretch is although linked to the flame radius, the correcting
radius will be used and in the case of Schlieren images, turbulent propagation speed and c,R
become: 𝑉𝑇 = 𝑑(𝐶.𝑅𝐴,𝑆) 𝑑𝑡 (4) 𝜅𝑐,𝑅 = 2 𝐶.𝑅𝐴,𝑆 𝑑(𝐶.𝑅𝐴,𝑆) 𝑑𝑡 (5)
For all conditions investigated, this coefficient is between 0.7 and 0.8 for 1 bar and between
0.65 and 0.8 bar for 5 bar instead of the value of 0.9 determined by Bradley et al. [12]. Several
reasons can explain this difference. First the definition of the tomography mean radius is
different for both studies. Second, in this work, both techniques, tomography and Schlieren
diagnostics, are simultaneous. Last, the fuel is not the same: propane vs. isooctane, which can
produce different levels of wrinkling.
Table 1 also shows that the correction factor decreases with the increase of the ratio of
turbulent intensity to the unstretched laminar burning speed. As a result, to properly account
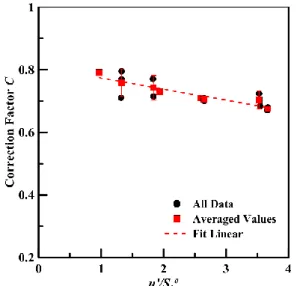
for the effect of turbulence and flame properties, a correlation is proposed in Fig.4 for the
correction factor C as a function of u’/SL0 which appears to be the most impacting parameter in
Table 1. The correction factor can be then calculated as follows:
𝐶 = 𝑎 ∗𝑢′
With 𝑎 = −3.55.10−2and 𝑏 = 0.84.
Figure 4. Correction factor as function of u’/SL0
From Fig. 4, the validity of the correlation can be discussed especially for low u’/SL0.
Indeed in laminar conditions, the correction factor should be equal to 1 because the flame is not
wrinkled by the turbulence and as a result the radius obtained by both optical techniques should
be similar since there is no flame brush in such conditions. Some investigations are therefore
required for values of 𝑢’/𝑆𝐿0 between 0 and 1 and experiments will be carried out in future work
4.2. Influence of initial conditions on flame propagation and the validity of the correlation for the optical correction factor
To study the influence of each initial parameter separately and the validity of the
correlation, the conditions presented in Table 2 were investigated using a single Schlieren view
diagnostic as described before. The following results were corrected using the correlation
shown in Fig.4. P (MPa) Φ 𝑢’ (m/s) 𝑆𝐿0 (cm/s) 𝐿𝑏 (mm) 𝐿𝑒 𝛿𝐿 (µm) 𝑢’/𝑆𝐿 0 𝐿 𝑇/𝛿𝐿 (mm) 𝜆 0.1 1.0 1.39 53.6 0.78 1.98 67.8 2.59 50.1 0.99 0.1 1.0 0.69 53.6 0.78 1.98 67.8 1.29 50.1 1.40 0.1 1.0 1.04 53.6 0.78 1.98 67.8 1.94 50.1 1.15 0.1 1.0 1.73 53.6 0.78 1.98 67.8 3.23 50.1 0.89 0.1 1.0 2.08 53.6 0.78 1.98 67.8 3.88 50.1 0.81 0.1 1.0 2.43 53.6 0.78 1.98 67.8 4.53 50.1 0.75 0.3 1.0 1.39 42.9 0.36 1.98 28.3 3.24 120.1 0.57 0.5 1.0 1.39 38.7 0.25 1.98 18.8 3.59 180.9 0.44 1 1.0 1.39 33.6 0.15* 1.98 10.8 4.14 314.8 0.31
Table 2. Experimental conditions investigated with Setup 2. 𝜆~𝐿𝑇(15 𝑅𝑒⁄ 𝐿)0.5. Symbols (*)
indicate that values are estimated from the correlation in [20].
4.2.1. Turbulence intensity effect
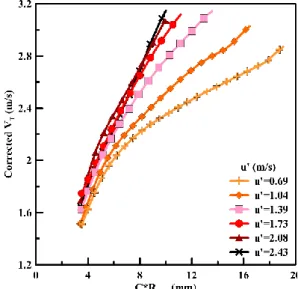
Fig.5 shows the corrected turbulent flame speed as a function of the corrected equivalent
radius. The flame speed increase as a function of the radius can be explained by the increase of
the wrinkling ratio as shown in Fig.6. Indeed the turbulent intensity increase is responsible for
an increase of the wrinkling and therefore of the turbulent flame speed. This rise of the
wrinkling is mainly provoked by the decrease of the small turbulent scales as already shown by
Galmiche et al. [18] and Brequigny et al. [24] on the same vessel. Moreover it is important to
notice that the flame radius observed here are quite small below 20 mm. Usually when the flame
reaches the full spectrum of turbulence, the curve of flame speed as function of radius reaches
a plateau [25]. In this case, due to the small size of the windows (60 mm diameter) and the
greater than 20 mm for the best cases, i.e. without any displacement of the initial flame kernel.
As a consequence, the flame is not yet impacted by the full spectrum of turbulence. Also, it can
be seen that the increase of the slope of the turbulent flame speed with the turbulence intensity appears to be limited for u’ greater than 1.73 m/s. This is mainly due to the fact that the small
turbulent length scales, i.e. Taylor and Kolmogorov reach a plateau for u’ higher than 1.73 m/s.
Figure 5. Corrected flame speed as a function of flame radius for different turbulent
intensities obtained from corrected Schlieren data. P=0.1 MPa, T=423 K, 𝜱 = 𝟏. 𝟎.
Figure 6. Wrinkling ratio as a function of flame radius obtained from Mie scattering images
for turbulent intensities. P=0.1 MPa, T=423K, 𝜱 = 𝟏. 𝟎.
Moreover, as isooctane is known as a flame stretch sensitive fuel contrary to the methane
(Jiang et al. [25]), the flame stretch generated by both flame expansion and turbulence will then
corresponding to high flame stretch. Considering the flame speed as function of the flame
stretch can then highlight those effects. In Fig.7.b, it can be seen how the corrected turbulent
flame speed trajectory as function of stretch is close to the nonlinear model used to describe
laminar cases in same conditions [20]. When the turbulent intensity increases, the agreement
with nonlinear laminar extrapolation model is less convincing. Therefore the flame kernel
develops first like in laminar conditions before being impacted by the turbulence in a second
phase.
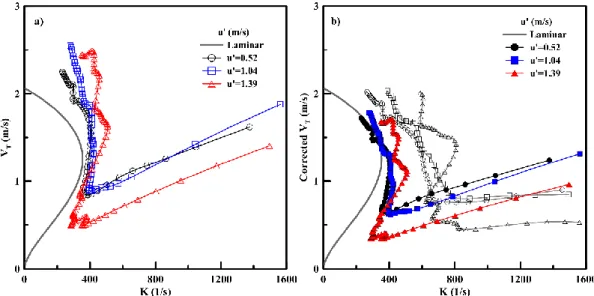
To evaluate the impact of the correlation to correct the Schlieren data, Fig. 7 shows the
same plot for non-corrected and corrected Schlieren data (Fig. 7.a and 7.b respectively).Without
any correction, it can be seen that the flame speed trajectory is close to the nonlinear extrapolation model only at low turbulent intensity. When increasing u’, the flame speed and
flame stretch increase thus moving the trajectory in the upper right part of the graph. When
applying the correlation for the correction factor to the flame speed, all the curves move towards
the nonlinear extrapolation of the corresponding laminar case. The flame speed seems then to
follow a laminar development before being impacted by the turbulence and overpassing the laminar curve especially for u’ higher than 1.04 m/s. For comparison purpose, the corrected
values obtained from the correction proposed by Bradley et al. [12] are added in Fig. 7b. It can
be noticed the Bradley et al. correction enables to decrease the flame speed as for the correction
proposed in the present paper but moreover values are shifted towards higher stretch levels.
This due to the impact of the correction proposed by Bradley et al. on flame stretch since the
radius is corrected using the following relation 0.9 ∗ 𝑅𝐴− 2.1 thus modifying the stretch value
Figure 7. Flame speed as a function of flame stretch for all the turbulent intensities with
non-corrected (a) and non-corrected (b: empty symbols corresponds to Bradley et al. correction, filled symbol corresponds to Eq. 6) Schlieren data. Grey line: nonlinear laminar extrapolation
model for the same initial conditions. 𝑷=0.1 MPa, T=423 K; 𝜱=0.8.
4.2.2. Pressure effect
The effect of the initial pressure on the turbulent flame speed is shown on Fig. 8. The
increase of the turbulent flame speed due the pressure increase can be also explained by the
augmentation of the wrinkling ratio. Galmiche et al. [18] showed that the increase of initial
pressure in the vessel induces a decrease of the small turbulent length scales, i.e. Taylor and
Kolmogorov length scales, especially between 1 and 5 bar. After 5 bar, the small length scales
reach a plateau [18], which can explain the non-effect on the flame speed. Moreover, the flame
thickness decreases also with the pressure as seen in Table 2, so this enlarges the turbulent
scales spectrum that can wrinkle the flame towards the small length scales and leads to an
Figure 8 – Propagation flame versus flame radius obtained from corrected Schlieren data.
T=423 K, 𝜱=1.0, u’=1.39 m/s.
Figure 9. Flame speed versus flame stretch for different initial pressures non-corrected (a)
and corrected (b: empty symbols corresponds to Bradley et al. correction, filled symbol corresponds to Eq. 6). Continuous lines: nonlinear laminar extrapolation model for the same
initial conditions. T=423 K, 𝜱=1; u’=1.39 m/s.
Fig. 9 shows the flame speed as a function of flame stretch for both non corrected (Fig. 9.a)
and corrected (Fig. 9.b) Schlieren data in order to evaluate in terms of pressure the validity of
the correlation with the correction factor presented in Fig. 4. Flame speed as a function of stretch
first decreases or presents a flat evolution before showing an inflexion point and finally
increases for low stretch levels due to the turbulence and wrinkling that accelerates the flame
front. When applying the correction on the Schlieren data, it passes close to the laminar
the correlation in Fig.4. The correction brought to the Schlieren data here is in agreement with
the evolution of flame speed as a function of flame stretch observed in Fig. 7. The turbulent
flame speed presents an evolution similar to the laminar flame speed and is strongly impacted
by the flame stretch before being accelerated thanks to turbulence and wrinkling. Again
corrected values obtained from the correction of Bradley et al. are added to Fig. 9b for
comparison purpose.
Conclusion
In this paper, Mie scattering tomography and Schlieren techniques were set to evaluate the
correction factor suggested by Bradley et al. [12] in order to ensure the validity of the turbulent
propagation flame speed estimate from Schlieren images. First, by using the 2-Views Schlieren
set-up, has been reconstructed in order to confirm the accuracy of the radius value determined
by only one view and its ability to describe the flame propagation. Then by comparing both
Schlieren and tomography radii, the correction factor to correct the flame speed obtained from
Schlieren images has been estimated. Values between 0.65 and 0.8 were determined, not
constant and below the constant value of 0.9 previously determined by Bradley et al. A
correlation has been proposed to estimate the correction factor depending on turbulent and
flame properties, i.e. u’/SL0. Future work will focus on improving this correlation especially for
lower turbulent intensities as well as several pressures and dilution.
In the second part of the paper, the correction factor was applied to the flame speed and
radius obtained from 1-View Schlieren technique. The use of this correlation shows that the
evolution of the flame speed as a function of flame stretch displays a laminar-like evolution,
especially in the early flame development before turbulence acts on the flame front and
accelerates the flame. This behaviour is similar to the evolution observed with Mie-scattering
Finally the influence of turbulent intensity and pressure was investigated in terms of flame
speed as function of radius or as function of stretch to better understand the dynamic of the
flame propagation for the improvement of Spark-Ignition engine modelling. Various optical
diagnostics combined with the deep turbulent characterization done in previous work [18] were
used to propose a detailed analysis of the influence of each parameter on the flame propagation
and therefore on the optical correction required.
Acknowledgements
This work was financed by the MACDOC project from the French National Research
Agency, ANR-12-VPTT-0008.
References
[1] D. Bradley, R.A. Hicks, M. Lawes, C.G.W. Sheppard, R. Woolley, The Measurement
of Laminar Burning Velocities and Markstein Numbers for octane-Air and
Iso-octane-n-Heptane-Air Mixtures at Elevated Temperatures and Pressures in an
Explosion Bomb, Combust. Flame. 115 (1998) 126–144.
doi:10.1016/S0010-2180(97)00349-0.
[2] D. Bradley, M. Lawes, K. Liu, M.S. Mansour, Measurements and correlations of
turbulent burning velocities over wide ranges of fuels and elevated pressures, Proc.
Combust. Inst. 34 (2013) 1519–1526. doi:10.1016/j.proci.2012.06.060.
[3] D. Bradley, M. Lawes, M.S. Mansour, Explosion bomb measurements of ethanol-air
laminar gaseous flame characteristics at pressures up to 1.4 MPa, Combust. Flame. 156
(2009) 1462–1470. doi:10.1016/j.combustflame.2009.02.007.
[4] B. Galmiche, F. Halter, F. Foucher, Effects of high pressure, high temperature and
dilution on laminar burning velocities and Markstein lengths of iso-octane/air mixtures,
[5] B. Galmiche, F. Halter, F. Foucher, P. Dagaut, Effects of Dilution on Laminar Burning
Velocity of Premixed Methane/Air Flames, Energy & Fuels. 25 (n.d.) 948–954.
http://dx.doi.org/10.1021/ef101482d.
[6] B. Karlovitz, D.W. Denniston, D.H. Knapschaefer, F.E. Wells, Studies on Turbulent
flames, Symp. Combust. 4 (1953) 613–620. doi:10.1016/S0082-0784(53)80082-2.
[7] G.H. Markstein, Non-steady Flame Propagation, Pergamon Press, 1964.
[8] P. Clavin, Dynamic behavior of premixed flame fronts in laminar and turbulent flows,
Prog. Energy Combust. Sci. 11 (1985) 1–59. doi:10.1016/0360-1285(85)90012-7.
[9] Z. Chen, Y. Ju, Theoretical analysis of the evolution from ignition kernel to flame ball
and planar flame, Combust. Theory Model. 11 (2007) 427–453.
http://dx.doi.org/10.1080/13647830600999850.
[10] F. Halter, T. Tahtouh, C. Mounaïm-Rousselle, Nonlinear effects of stretch on the flame
front propagation, Combust. Flame. 157 (2010) 1825–1832.
doi:10.1016/j.combustflame.2010.05.013.
[11] R.G. Abdel-Gayed, D. Bradley, M. Lawes, Turbulent Burning Velocities: A General
Correlation in Terms of Straining Rates, Proc. R. Soc. London. A. Math. Phys. Sci. .
414 (1987) 389–413. doi:10.1098/rspa.1987.0150.
[12] D. Bradley, M.Z. Haq, R.A. Hicks, T. Kitagawa, M. Lawes, C.G.W. Sheppard, et al.,
Turbulent burning velocity, burned gas distribution, and associated flame surface
definition, Combust. Flame. 133 (2003) 415–430.
doi:10.1016/S0010-2180(03)00039-7.
[13] L. Gillespie, M. Lawes, C.G.W. Sheppard, R. Woolley, Aspects of Laminar and
Turbulent Burning Velocity Relevant to SI Engines, SAE Tech. Pap. (2000).
doi:10.4271/2000-01-0192.
Flames at Various Lewis Numbers, Combust. Sci. Technol. 162 (2001) 347–370.
doi:10.1080/00102200108952148.
[15] P. Brequigny, F. Halter, C. Mounaïm-Rousselle, Lewis number and Markstein length
effects on turbulent expanding flames in a spherical vessel, Exp. Therm. Fluid Sci. 73
(2016) 33–41. doi:10.1016/j.expthermflusci.2015.08.021.
[16] S. Chaudhuri, F. Wu, D. Zhu, C.K. Law, Flame Speed and Self-Similar Propagation of
Expanding Turbulent Premixed Flames, Phys. Rev. Lett. 108 (2012) 44503.
http://link.aps.org/doi/10.1103/PhysRevLett.108.044503.
[17] S. Chaudhuri, A. Saha, C.K. Law, On flame–turbulence interaction in
constant-pressure expanding flames, Proc. Combust. Inst. 35 (2015) 1331–1339.
doi:10.1016/j.proci.2014.07.038.
[18] B. Galmiche, N. Mazellier, F. Halter, F. Foucher, Turbulence characterization of a
high-pressure high-temperature fan-stirred combustion vessel using LDV, PIV and
TR-PIV measurements, Exp. Fluids. 55 (2013) 1–20. doi:10.1007/s00348-013-1636-x.
[19] G. Broustail, F. Halter, P. Seers, G. Moréac, C. Mounaïm-Rousselle, Experimental
determination of laminar burning velocity for butanol/iso-octane and ethanol/iso-octane
blends for different initial pressures, Fuel. 106 (2013) 310–317.
doi:10.1016/j.fuel.2012.10.066.
[20] C. Endouard, F. Halter, C. Chauveau, F. Foucher, Effects of CO2, H2O, and Exhaust
Gas Recirculation Dilution on Laminar Burning Velocities and Markstein Lengths of
Iso-Octane/Air Mixtures, Combust. Sci. Technol. 188 (2016) 516–528.
doi:10.1080/00102202.2016.1138792.
[21] J.K. Bechtold, M. Matalon, The dependence of the Markstein length on stoichiometry,
Combust. Flame. 127 (2001) 1906–1913.
[22] R. Borghi, Mise au point sur la structure des flammes turbulentes, J. Chim. Phys. 81
(1984) 361–370. http://cat.inist.fr/?aModele=afficheN&cpsidt=8873264 (accessed July
29, 2014).
[23] N. Peters, Laminar flamelet concepts in turbulent combustion, Symp. Combust. 21
(1988) 1231–1250.
http://www.sciencedirect.com/science/article/pii/S0082078488803552.
[24] P. Brequigny, F. Halter, C. Mounaïm-Rousselle, T. Dubois, Fuel performances in
Spark-Ignition (SI) engines: Impact of flame stretch, Combust. Flame. 166 (2016) 98–
112. doi:10.1016/j.combustflame.2016.01.005.
[25] L.J. Jiang, S.S. Shy, W.Y. Li, H.M. Huang, M.T. Nguyen, High-temperature,
high-pressure burning velocities of expanding turbulent premixed flames and their
comparison with Bunsen-type flames, Combust. Flame. 172 (2016) 173–182.