HAL Id: hal-01875420
https://hal.archives-ouvertes.fr/hal-01875420
Submitted on 17 Sep 2018
HAL is a multi-disciplinary open access archive for the deposit and dissemination of sci-entific research documents, whether they are pub-lished or not. The documents may come from teaching and research institutions in France or abroad, or from public or private research centers.
L’archive ouverte pluridisciplinaire HAL, est destinée au dépôt et à la diffusion de documents scientifiques de niveau recherche, publiés ou non, émanant des établissements d’enseignement et de recherche français ou étrangers, des laboratoires publics ou privés.
magnetostrictive-piezoelectric layered structures: FEM
modeling and experimental validation
Meriem Elhosni, Omar Elmazria, Sébastien Petit-Watelot, Laurent Bouvot,
Sergei Zhgoon, Abdelkrim Talbi, Michel Hehn, Keltouma Aït Aïssa, Sami
Hage-Ali, Daniel Lacour, et al.
To cite this version:
Meriem Elhosni, Omar Elmazria, Sébastien Petit-Watelot, Laurent Bouvot, Sergei Zhgoon, et al.. Magnetic field SAW sensors based on magnetostrictive-piezoelectric layered structures: FEM modeling and experimental validation. Sensors and Actuators A: Physical , Elsevier, 2016, 240, pp.41 - 49. �10.1016/j.sna.2015.10.031�. �hal-01875420�
Magnetic field SAW sensors based on magnetostrictive-piezoelectric layered structures:
FEM modeling and experimental validation
Meriem Elhosni
a*, Omar Elmazria
a, Sébastien Petit-Watelot
a, Laurent Bouvot
a, Sergei Zhgoon
b,
Abdelkrim Talbi
c, Michel Hehn
a, Keltouma Ait Aissa
a, Sami Hage-Ali
a, Daniel Lacour
a, Frederic
Sarry
a, Olivier Boumatar
ca Institut Jean Lamour, UMR 7198, Université de Lorraine - CNRS, Vandoeuvre les Nancy, France
b International Research University Moscow Power Engineering Institute, 14 Krasnokazarmennaja,111250 Moscow,
Russia
c International Associated Laboratory LEMAC/LICS - IEMN UMR CNRS 8520, ECLille -USTL, PRES Université
Lille Nord de France, Villeneuve d’Ascq, France
Abstract
This study describes the numerical implementation of accurate and fully coupled physical models in order to investigate the sensitivity of Surface Acoustic Wave (SAW) devices using the magnetoelastic interaction with an external magnetic field. The model was first validated using experimental data previously published by Kadota et al., obtained with SAW resonators based on quartz substrates and nickel InterDigital Transducers (IDTs). The model was then used to optimize the geometry of a new magnetostrictive-piezoelectric layered structure (Ni/ZnO/IDT/LiNbO3), regarding its sensitivity to the magnetic field intensity. The optimized structure was designed and fabricated and experimental results show a good correlation with the numerical modeling. Simulations also show that if alumina is used instead of ZnO, the Ni/Al2O3/IDT/LiNbO3 structure exhibits a sensitivity that is 9 times higher than the one based on ZnO.
Key words: SAW, magnetic field sensor, wireless, FEM Modeling
*Corresponding author.Tel.: +33 3 83 68 49 32
1. Introduction
Because surface acoustic wave devices (SAW) exhibit a high sensitivity to various physical and chemical parameters, they offer innovative and very promising solutions in a wide range of sensing applications [1-3]. In addition to being small, simple and robust, these devices have the advantage of being passive (batteryless), remotely queried (wireless), packageless (when needed), and inexpensive if they are fabricated at a large scale [4-7]. Their use as passive and wireless sensors allows them to operate in rotating parts or in extreme conditions such as high temperature (up to 1000°C) or radioactive environments, in which no other wireless sensor can operate [8,9]. Practical SAW sensor systems have been reported, such as temperature, chemical and pressure sensors [5,10,11]. Recent developments have enabled the elaboration of magnetic field SAW sensors by combining magnetostrictive and piezoelectric materials [12-15]. Magnetic SAW devices such as a SAW delay line made of TbCo2/FeCo/Y-cut
LiNbO3 [13] and SAW resonators with Ni electrodes/quartz [12] were reported. However additional efforts need to
be made in order to increase the sensitivity to the magnetic field of such structures.
Systematic fabrication, test and demonstration of SAW sensors performances are time consuming and expensive, especially when layered structures are considered, and when the sensitivity to external parameters is investigated. Thus, accurate simulation models are required to design optimal SAW magnetic field sensors based on resonators or delay lines. For such devices, the finite element analysis (FEM) is a useful and efficient tool, notably because of the relative ease of implementation of complex geometries. In our study, a single half-period structure has been studied, and the application of inverted periodical boundary conditions allowed us to compute the derived infinite geometry [16]. It should be noted that if extremely precise data are required, FEM will use very important computational resources.
This work presents an accurate and fully coupled model enabling the investigation of magnetoelastic SAW devices sensitivity to an externally applied magnetic field. This model is then validated experimentally. Both the direction and the intensity of the applied magnetic field are considered. The magnetic field dependence of SAW resonators is demonstrated, leading to possible applications as either magnetic field sensors or externally controlled frequency-tunable resonators.
This paper is organized as follows: in section 2, we describe the development of a numerical model to study magnetic field SAW sensors, which is, in a first step, successfully confronted to experimental results previously published by Kadota &al. [12]. In section 3, we use this model to study extensively a new layered structure, in terms of insertion loss, sensitivity to the magnetic field in two in-plane directions, the quality factor and to describe the impact of using harmonics. In section 4 we describe the fabrication and characterization of the new layered structure and provide additional demonstration of the validity of the developed numerical model. To finish, section 5 describes new strategies to yield highly sensitive and high Q wireless magnetic field sensors.
2. Model validation
A FEM computational study was performed using COMSOL Multiphysics considering a magneto-elastic wave in a ferromagnetic film deposited on a piezoelectric substrate.
We consider a magnetoelastic wave in a ferromagnetic thin film deposited on a substrate and magnetized to saturation. In this case, the equations for the mechanical and magnetic systems, the equations of Landau-Lifshitz and motion equations are ([17]):
𝜌"²$% "&' = "*%+ ",+ (1) "𝑴 "& = −𝛾µ12𝑴 × 𝑯𝒆𝒇𝒇7 (2)
Where 𝛾 the gyromagnetic ratio, 𝑢9is is is the ith component of the particle displacement, and 𝑥; denotes the Eulerian
coordinates. The effective magnetic field 𝑯𝒆𝒇𝒇and 𝑇9;is the stress tensor given by [26]:
𝑯𝒆𝒇𝒇 = 𝑯 −>= ? "@ "𝑴 (3) 𝑇9; = "A"@ %+ (4)
where 𝑯 is the Maxwellian magnetic field, and 𝐸CDis the strain tensor
𝐸CD==EF"$",G
H+
"$H ",GJ (5)
U is the local internal energy density written as U=Uan+Ume+Ue, , Uan is the magnetocrystalline anisotropy energy,
Ume is the magneto-elastic coupling energy and Ue is the elastic Energy.
When linearizing the equations (1) and (2) around a ground state position, we obtain the dependence between elastic constants and the magnetic field. ∆𝐶9; is the term dependent to the magnetic field ([18]). The elastic constant 𝐶M9;
of the magnetic film are dependent of the applied magnetic field H. 𝐶M
9;= 𝐶9;+ ∆𝐶9; (6)
The numerical model was generated using the AC/DC and the structural mechanics modules of COMSOL Multiphysics. To introduce the coupling between the two domains, appropriate terms are added to the subdomain variables. The coupling magnetostriction equations are ([19]):
𝑇 = 𝐶N𝑆 − ℎ𝐵 (7)
𝐻 = −ℎ𝑆 + 𝜈T𝐵 (8)
Where 𝑇 is the stress, 𝐶N is the compliance matrix at constant flux density, 𝑆 is the strain, ℎ is the piezo-magnetic
coupling coefficients. 𝐻 is the variable magnetic field, 𝐵 is the flux density, and 𝜈Tis the inverse of the permeability
A FEM computational study was performed using COMSOL Multiphysics. In a magnetostrictive thin film, a coupling between the AC/DC module and the structural mechanics module was implemented. To verify if the magnetoelastic interaction calculation in our model is correct, a half period of Ni-IDT/quartz SAW resonator [12] was first studied (Fig. 1).
Fig. 1
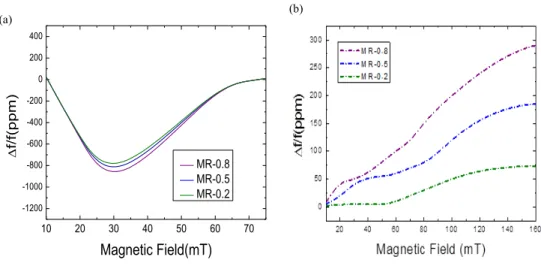
The sensitive element consists of IDTs made in nickel. We investigated the magnetic sensitivity of the SAW sensor by studying the relative frequency shift to the external magnetic field for different IDT features. Figure 2 shows the dependence of the sensitivity to the metallization ratio of the IDTs in X and Y directions, i.e. parallel and perpendicular to the direction of propagation of the acoustic wave, respectively.
As one can observe, the higher the metallization ratio, the higher the sensitivity, particularly in the Y direction. For this reason a metallization ratio of 80%, which is elevated but still compatible with a practical implementation, was used as in [12] to study the magnetic characteristics of the SAW sensor.
Fig. 2
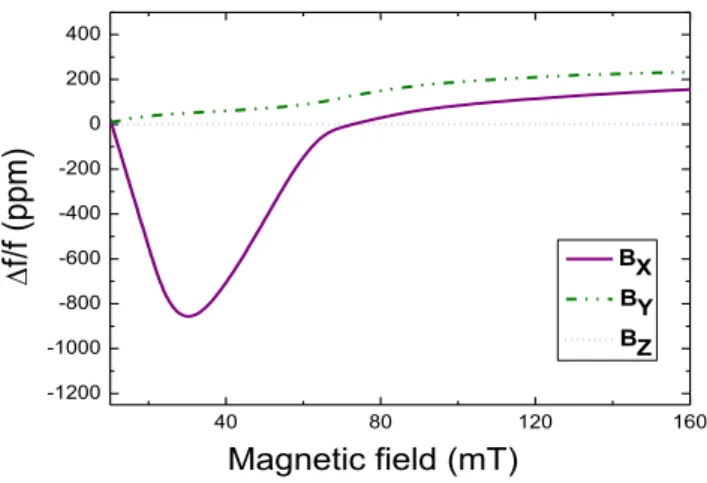
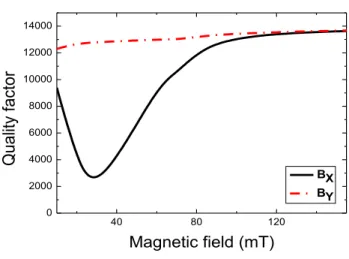
Using a 80% metallization ratio, the relative frequency shift (Fig. 3) and the quality factor (Fig. 4) versus the magnetic field intensity were then calculated for each direction (X, Y, Z) and compared to the experimental results published by Kadota et al. [12]. The obtained results are highly consistent with the experimental ones, thus confirming the validity of our model. As an example, at B=120 mT, Δf =100ppm and 95 ppm for the experiment and the simulation, respectively. As one can observe in figure 4, the sensor is more sensitive to the magnetic field in the X direction. However, the theoretical and experimental results show that the quality factor (Q) is also strongly affected by the magnetic field intensity and direction. Figure 5 shows that the Q value decreases with the intensity of the magnetic field applied in the X direction and reaches a minimum value of 2500 for B=38 mT. This value is too low to enable a remote interrogation of the SAW sensor, thus complicating any use in wireless applications. In the Y-direction, the Q factor gradually increases when magnetic field intensity increases. This explains why this structure was considered as a suitable candidate for testing as a wireless sensor of the magnetic field only in the Y direction. Note that in simulated results, Q is estimated by the inverse of the fractional width between frequencies where the real part of the admittance Y becomes the half height of its peak [20].
Fig. 3 Fig. 4
According to previously published paper [21] the variation of frequency (i.e. phase velocity) and Q factor versus magnetic field intensity shown in Fig. 3 and Fig. 4 respectively are attributed to the ΔE effect, which is a change in Young’s modulus E under magnetic fields, and to a dynamic magnetoelastic coupling, which is the interaction
between acoustic waves and magnetic moments. Indeed, as described by P. Smole et al. [22], applying an external field in hard axis direction leads primarily to a decrease in the elastic modulus towards a local minimum. A further increase of the external field causes a proportional growth of the elastic modulus up to a saturation value where the E modulus is approximately the same as in the initial state. Thus, the Q factor behavior follows the Young Modulus one.
3. Theoretical study of Ni/ZnO/IDT/LiNbO3 structure
3.1 Frequency response of the structure with no magnetic field
After validating our model by analysis of the matching with known results, we extended the use of this model to new structures in order to enhance the sensor sensitivity. A delay line made of a Ni/ZnO/IDT/LiNbO3 layered
structure was considered (Fig. 5 shows a half-period of an IDT). The purpose of this design is to add additional degrees of freedom in the structure by separating the Ni sensitive layer and the metallic IDT layer. The Ni sensitive layer has now a 100 % metallization ratio and the IDTs are made with aluminum, whose conductivity is almost 2.5 times higher than the one of nickel. The IDTs spatial period was fixed to 24µm. Thus the elastic wavelength (l) related to central frequency of the fundamental is equal to 24 µm. If we consider the harmonic n, the related wavelength is ln= l/n. Thin film of zinc oxide (ZnO) was used as insulating layer in order to avoid the shorting of
the IDTs by the nickel layer. Fig. 5
Considering the previously performed optimization of the ZnO and Ni layers regarding the SAW sensor sensitivity to the magnetic field and the electromechanical coupling coefficient (K2), their thicknesses were fixed at 250 nm and
200 nm, respectively [23].
As shown in figure 6, the S21 frequency response of the optimized structure was calculated for each step in our
device modeling: IDT/LiNbO3, ZnO/IDT/LiNbO3, and finally Ni/ZnO/IDT/LiNbO3. As one can observe, the
insertion loss (IL) of the device is slightly affected by the presence of the ZnO and Ni layers. These changes in the insertion losses are due to the dependence of the considered structures on the propagation loss and on the K2 value.
To quantify the contribution of K2 and quality factor (Q) to insertion losses, these parameters were also calculated at
different steps. Table 1 summarizes the calculated values of K2, IL, Q and of the center frequency.
Table 1 Fig. 6
The wideband S11 frequency response of the optimized Ni/ZnO/IDT/LiNbO3 delay line structure was then calculated
identified as the peak of the fundamental Rayleigh mode (H1), of its third spatial pseudo-harmonic (H3) and of the fifth one (H5). The term “pseudo” is used because the frequency values of H3 and H5 are not the exact multiples of H1, which is due to the acoustic wave velocity dispersion induced by the multilayer configuration in the considered structure [24-25]. The identification of the mode and of the spatial pseudo-harmonics is made by analyzing the distribution of the particles displacement. Figure 8-b shows the 2D presentation of the calculated particles displacement distributions in the Ni/ZnO/LiNbO3 layered structure obtained for the H1, H3 and H5 spatial
pseudo-harmonics. The wavelength related to each spatial pseudo-harmonic is clearly observed: the penetration depth of the acoustic wave is inversely proportional to the considered frequency (i.e. the order of the harmonic). Thus, we can expect that, for high frequencies, the sensitivity to magnetic field of the structure will be enhanced. Indeed, the acoustic wave is more confined to the surface and subsequently in the sensitive layer.
Fig .7-a, Fig .7-b
3.2 Behavior of the structure on the presence of the magnetic field 3.2.1 Sensor sensitivity to magnetic field
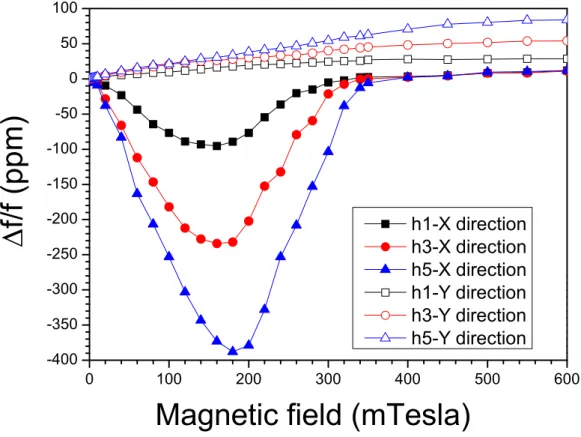
For all the spatial harmonics, the magnetic sensitivity was calculated, when the direction of the applied magnetic field is parallel to the direction of acoustic wave propagation (i.e X direction). Figure 8-a shows that when the magnetic field intensity increases, the resonance frequency of the device first decreases, then reaches a minimum for H= 0.18Tesla, and then increases, trending towards the initial value. We can consider that the studied device could be advantageously used as a magnetic field sensor in the range of intensity between 0 and 160mT in the X direction.
The Ni/ZnO/IDT/LiNbO3 structure shows a relative sensitivity of 0.69ppm/mT for the fundamental mode. This
sensitivity is enhanced by a factor 3 when we consider the third spatial pseudo-harmonic (2.1ppm/mT) and by a factor 5.2 for the fifth one (3.6ppm/mT), as it is shown in figure 9-a. As expected, the sensor sensitivity is enhanced with the order of the considered spatial pseudo-harmonic (i.e. operating frequency). Note that here the sensitivity is expressed in (ppm/mT) in a relative fashion, and if we consider the absolute sensitivity in (Hz/mT) corresponding to the actual frequency shift, the enhancement is of a factor 26 for the fifth harmonic.
The magnetic field was then applied in the Y direction, perpendicular to the acoustic wave propagation. The results obtained for the fundamental mode and for the two nearest spatial pseudo-harmonics are shown in figure 8-b. Similarly to the X direction, the sensitivity increases when the considered operating frequency increases. As we can see, the frequency shift in the Y direction is smaller than the one in the X direction. However, the range of sensitivity that could be considered for sensor applications is almost three times wider in the Y direction (from 0 to 500mT). Moreover, when we compare the frequency shifts for two directions of the magnetic field, X and Y (Fig.
9), we can see that the Y-direction frequency shift presents a better linearity with respect to the field intensity. Even more important for applications is the absence of ambiguous sensor readings that appear in X-direction (i.e. same central frequency for two different magnetic field intensities).
Fig.8 Fig. 9
3.2.2 Quality factor
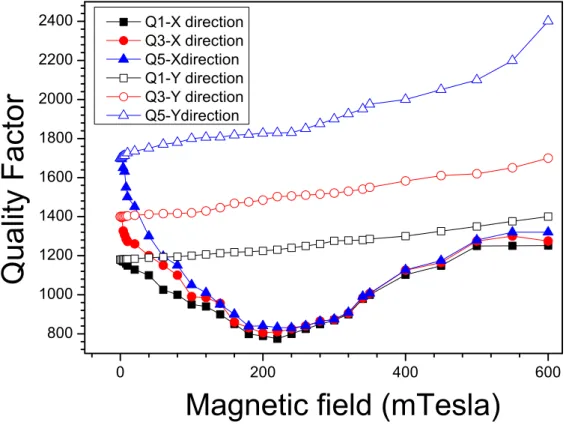
As mentioned before, the quality factor is a critical parameter for SAW devices. The sensor accuracy is directly depending on Q value and in wireless configuration the query distance is also limited by the Q value. A minimum value of 3000 is often required. Q variations versus applied magnetic fields in the X and Y directions were extracted from admittance-frequency response and calculated for all the spatial pseudo-harmonics H1, H3 and H5. The obtained results, summarized in figure 10, show that the Q value decreases with the intensity of the magnetic field in the X-direction and reaches a minimum value of 800 for B=200mT. When the magnetic field is applied in the Y direction, the Q value increases with the magnetic field intensity. A slightly larger value of 2279 is obtained for the fifth harmonic at 600 mT. In many cases, this value is not sufficient for many wireless SAW sensor applications.
Fig. 10
4.
Experimental results 4.1 Electrical characterizationTo confirm our theoretical predictions, a Ni/ZnO/IDT/LiNbO3 structure optimized by FEM modeling was
fabricated. In the first step, the aluminum IDTs of the delay line were fabricated on the surface of a 128°Y-X LiNbO3 substrate using photolithography and wet etching processes. The spatial period of the IDTs that defines the
working wavelength was fixed to 24 µm. Then, according to the modeling results, a 250 nm-thick insulating ZnO layer was deposited over the IDTs and the LiNbO3 substrate by RF magnetron sputtering. Finally, a 200 nm thick
Nickel film was deposited on the ZnO surface using RF magnetron sputtering. Depositions parameters for ZnO and Ni are described in previous work [23].
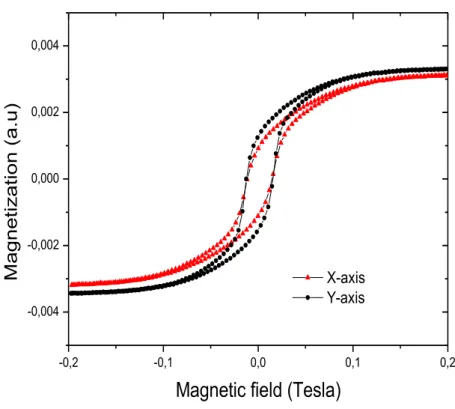
The magnetization of the Ni thin film has been measured with a vibrating sample Magnetometer (VSM). The obtained results along X and Y axis are displayed in figure 9 and they confirm that the deposited Ni film is sufficiently isotropic in X and Y plane.
Frequency responses of the realized delay line SAW structure Ni/ZnO/IDT/LiNbO3 in transmission
configuration (S21) were measured using Network Analyzer (Agilent PNA 5230A, Santa Clara, CA) and RF probe
station RF (PM5Suss Micro-tech PM5). As shown in figure 10, measurement was made before and after ZnO and Ni films depositions. We can observe that after adding the two layers (ZnO and Ni) the fundamental peak shift from 164.9 MHz to 159.4 MHz, the third pseudo-harmonic from 498.8 MHz to 465.5 MHz and the fifth one from805.1MHz from to 753 MHz.
In order to prepare test samples for magnetic characterization, the SAW delay line structure Ni/IT/ZnO/LiNbO3
is bonded to copper-coated printing circuit board (PCB), suitable for microelectronics applications. The connections are established between the PCB and the SAW device using a 20 µm diameter gold wire (Fig. 10). Four RF connectors (SMA) are used in order to characterize simultaneously two independent SAW devices. The S21
frequency response of the mounted device wasmeasured with a network analyzer (see Figure 14). The insertion loss (IL) of the device is slightly affected by the mounting process (+2.8 dB for the fundamental peak). Note that after packaging, only the fundamental and the third pseudo-harmonics appear clearly at 159.4 MHz and 465.5 MHz. Thus, for experimental magnetic characterization, only those two frequencies will be considered.
Fig. 10
4.2 Magnetic characterization
A magnetic field with controlled intensity is applied to the packaged SAW device. The device can be rotated to change the orientation of the applied magnetic field. A Network Analyzer (PNA 5230A) was used to characterize the frequency response of the SAW device and the variation of the center frequency is collected versus intensity and direction of the applied magnetic field. A photo of the experimental set up is shown in Figure 11.
Fig. 11
Note that the maximum external magnetic field reached in our experimental characterization is limited to 0.35mT. The center frequency of the delay line was measured versus the intensity of magnetic field when the field was first applied in X-direction and then in Y-direction. Figure 12, shows the measured and calculated relative center frequency shift (Δf/f) with respect to the applied magnetic field intensity. Both the fundamental wave (H1-159 MHz) and pseudo-harmonic (H3- 465 MHz) were investigated. There is a good agreement between calculated and experimental results, which proves that the developed model leads to a correct prediction of the sensor sensitivity to the magnetic field intensity and direction. When the magnetic field is applied in the same direction as the direction of the acoustic wave propagation (X-direction), the experimental results are compared with the
theoretical predictions, as shown in Figure12-a, for the fundamental spatial pseudo-harmonic. The Ni/ZnO/IDT/LiNbO3 delay line structure shows a sensitivity of 0.65ppm/mT, a value that is enhanced by a factor 3
when it is studied at the third harmonic (2.1ppm/ mT).
When the magnetic field is perpendicular to the acoustic wave propagation (Fig. 12-b) the experimental results confirm the calculated ones. As we can see in figure 18-b, the shift in the Y-direction is smaller than the one in the X direction. However, the range of sensitivity that could be considered for sensor applications is wider in the Y direction (0 to 500mT). Moreover, the absence of ambiguous sensor readings that appear in X-direction is confirmed here experimentally, and it is very important for sensor applications.
Fig. 12
5. Discussion: toward more sensitive magnetic field sensors
The obtained sensitivity and quality factor values are still limited and various paths can be envisioned to enhance them. A strength of our structure is the possibility to use different strategies, separately or altogether to improve the sensor performances. Thus, the sensor sensitivity to magnetic field intensity can be improved by: - Using a more sensitive layer, such as a strongly magnetostrictive layer for example: CoFeB, CoFeTb or the
stacks similar to (TbCo2/FeCo) multilayers [13]. However, the knowledge of physical constants of such layers is required before for theoretical studies and optimization.
- Using higher frequency device leading to better confinement of the acoustic wave near the surface and subsequently inside the sensitive layer.
- Using insulating layer with different properties that presents a higher acoustic velocity, leading to a better confinement of the acoustic wave particularly in the sensitive layer.
Here we will consider the combination of the last two approaches. As insulating layer, we may use alumina (Al2O3)
that presents a lower density and an acoustic velocity that is more than two times higher than that of ZnO. We will consider a device operating at 815 MHz in order to make a qualitative comparison with the spatial pseudo-harmonics 3 and 5 in the two structures previously studied in this paper, Ni/Quartz and Ni/ZnO/IDT/LiNbO3 respectively.
First, we considered alumina (Al2O3) as an insulating layer instead of ZnO and kept all geometric parameters of the
structure unchanged. Calculated results (Fig. 13) show that the particles displacement is larger when considering the structure with Al2O3 layer.
Fig. 13
By substituting ZnO with Al2O3 the sensor sensitivity was also enhanced by a factor 9 in the X direction (Fig. 14-a)
new structure also exhibits a higher quality factor compared to the structure using ZnO as insulator (Fig. 15-a). When the magnetic field is applied in the Y direction (Fig. 15-b), the quality factor increases when the magnetic intensity increases and its value is always over than 5000, making this structure very interesting for wireless magnetic sensing applications. Work is in progress to realize the simulated structures and experimentally confirm the predicted results.
Fig. 14 Fig. 15
Conclusion
To conclude, a theoretical model for the prediction of a SAW sensor sensitivity with respect to the intensity and the direction of externally applied magnetic fields was developed and validated experimentally. For the validation of our model, we used experimental results available in literature as well as our own experimental results. This study confirms that the realization of magnetic wireless sensors combining high sensitivity and high quality factor is achievable by using a layered SAW structure. Three different structures were investigated, demonstrating that a careful choice of properties of considered piezoelectric, insulating and sensitive magnetoelastic layers is very important for the final performance of the sensor.
Aknowledgement
This work was supported in parts by the Institut Jean Lamour 7198, Université de Lorraine - CNRS, by the Ministry of Science and Education of the Russian Federation (123/14-544), International Research University Moscow Power Engineering Institute, 14 Krasnokazarmennaja, 111250 Moscow, by the International Associated Laboratory LEMAC/LICS - IEMN UMR CNRS 8520.
References
[1] A. Lonsdale , B. Lonsdale, Method and apparatus for measuring strain, U.S. Patent US5585571, (1996).
[2] H. Wohltjen, R. Dessy, Surface Acoustic Wave Probe for Chemical Analysis - Introduction and Instrument Design, Ana. Chem., Vol. 51 (9), pp. 1458-1475, (1979).
[3] E. Staples, Electronic Nose Simulation of Olfactory Response Containing 500 Orthogonal Sensors in 10 Seconds, Proc. IEEE Ultrasonics Symp., pp. 417-423, (1999).
[4] L. Reindl, C.C.W. Ruppel, A. Kirmayr, N. Stockhausen and M.A. Hilhorst, Passive Radio Requestable SAW Water Content Sensor, Proc. IEEE Ultrasonics Symp., pp. 461-466, (1999).
[5] V. Kalinin, R. Lohr, A. Leigh , G. Bown, Application of passive SAW resonant sensors to contactless measurement of the output engine torque in passenger cars, Proc. IEEE Frequency Control Symp., pp. 499-504, (2007).
[6] K. Bhattacharjee, A. Shvetsov, S. Zhgoon, Packageless SAW Devices with isolated Layer Acoustic Wave (ILAW) and wave guiding Layer Acoustic Waves (WLAW), Proc. IEEE Frequency Control. Symp., pp. 135-140, (2007).
[7] O. Legrani, O. Elmazria, M. Elhosni, A. Bartasyte, P. Pigeat , S. Zhgoon, Packageless temperature sensor based on AlN/IDT/ZnO/Silicon layered structure, Proc. IEEE Frequency Control Symp., pp. 259-26, (2013).
[8] L. Reindl, C.C.W. Ruppel, A. Kirmayr, N. Stockhausen, M.A. Hilhorst, Passive radio requestable SAW water content sensor, Proc. IEEE Ultrasonics Symp., pp. 461–466, (1999).
[9] T. Aubert, J. Bardong, O. Legrani, O. Elmazria, M.B. Assouar, G. Bruckner, In situ high-temperature characterization of AlN-based surface acoustic waves devices, J. Appl. Phys. 114, 014505, (2013).
[10] T. Aubert, O. Elmazria, B. Assouar, L. Bouvot, M. Oudich, Surface acoustic wave devices based on
AlN/sapphire structure for high temperature applications, Appl. Phys. Lett. 96 203503, (2010).
[11]A. Talbi, F. Sarry, M. Elhakiki, L. Le Brizoual, O. Elmazria, P. Nicolay, P. Alnot, ZnO/quartz structure potentiality for surface acoustic wave pressure sensor, Sensors and Actuators A 128, pp. 78-83, (2006).
[12] M. Kadota, S. Ito, Y. Ito, T. Hand, K. Okaguchi, Sensitivity of surface acoustic wave magnetic sensors composed of various Ni Electrode structures, Jpn. J. Appl. Phys. 51,07GC21, (2012).
[13] H. Zhou, A. Talbi, N. Tiercelin, and O. Bou Matar, Theoretical and experimental study of multilayer piezo-magnetic structure based surface acoustic wave devices for high sensitivity piezo-magnetic sensor, Proc. IEEE Ultrasonics Symp., pp. 212-215, (2013).
[14] M. Weiler, L. Dreher, C. Heeg, H. Huebl, R. Gross, M.S. Brandt, S.T.B. Goennenwein, Elastically Driven Ferromagnetic Resonance in Nickel Thin Films, Phys.Rev. Lett. 106, 117601, (2011).
[15] H. Hauser, R. Steindl, C. Hausleitner, A. Pohl, J. Nicolics, Wirelessly Interrogable Magnetic Field Sensor Utilizing Giant Magneto-Impedance Effect and Surface Acoustic Wave Devices, IEEE Trans. Instrum. Meas. 49, 3, pp. 648-652, (2000).
[16] L. Lebrizoual, F. Sarry, F. Moreira, O. Elmazria, FEM modeling of surface acoustic wave in diamond layered structure, Phys. stat. sol. (a) 203, 12, pp. 3179-3184, (2006).
[17] H. Zhou, A. Talbi, N. Tiercelin, O. Bou Matar, Multilayer magnetostrictive structure based surface acoustic wave devices, Appl. Phys. Lett. 104, 114101, (2014).
[18] O. Bou Matar, J. Robillard, J. Vasseur, A.-C. Hladky-Hennion, P. Deymier, P. Pernod, V. Preobrazhensky, Band gap tunability of magneto-elastic phononic crystal, J. Appl. Phys. 111, 054901, (2012).
[19] C. Slaughter, Coupled Structural and Magnetic Models: Linear Magnetostriction in COMSOL, Excerpt from the Proceedings of the COMSOL Conference 2009 Boston
[20] Ken-ya Hashimoto , Surface Acoustic Wave Devices in Telecommunications; ISBN 3-540-67232-X Springer-Verlag, Berlin Heidelberg New York
[21] M. Yamaguchi, K.Y. Hashimoto, H. Kogo, M. Naoe, Variable SAW delay line using amorphous TbFe2 film, IEEE Trans. Magn. 16, 5, pp. 916-918, (1980).
[22] P. Smole, W. Ruile, C. Korden, A. Ludwig, E. Quandt, S. Krassnitzer, P. Pongratz, Magnetically tunable SAW-resonator, Proc. IEEE Frequency Control Symp., pp. 903-906, (2003).
[23] M. Elhosni, O. Elmazria, A. Talbi, K. Ait-Aissa, L. Bouvot, F. Sarry, FEM modeling of Multilayer Piezo-magnetic Structure Based Surface Acoustic Wave Devices for Magnetic Sensor, Procedia Engineering 87, pp. 408-411, (2014).
[24] A. Talbi, F. Sarry, L. Le Brizoual, O. Elmazria, P. Alnot, Sezawa Mode SAW Pressure Sensors Based on ZnO/Si Structure, IEEE Trans. Ultrason. Ferr., 51, 11, pp. 1421-1426, (2004).
[25] O. Elmazria, M. El Hakiki, V. Mortet, M.B. Assouar, M. Nesladek, M. Vanecek, P. Bergonzo, P. Alnot, Effect of diamond nucleation process on propagation losses of AlN/diamond SAW filter, IEEE Trans. Ultrason. Ferr., 51, pp. 1704-1709, (2004).
Table caption
Table 1. Calculated electro-mechanical coupling coefficient and insertion loss for the considered structures
Structure K2 (%) calculated IL (dB) Q central frequency
IDT/ LiNbO3 0.049 -10 1850 165MHz
ZnO/IDT/ LiNbO3 0.052 -9 1487 164MHz
Figure captions
Fig. 1: Schematic cut view of Ni-IDT/quartz structure.
Fig. 2: Dependence of the relative frequency shift to the magnetic field intensity in the direction parallel to the acoustic wave propagation (X direction) (a) and perpendicular direction Y (b) for different metallization ratios of IDTs.
Fig. 3: Calculated relative frequency shift versus magnetic field intensity of Ni-IDT/quartz sensor in X, Y and Z directions.
Fig. 4: Calculated quality factor (Q) versus the magnetic field intensity of a Ni-IDT/quartz resonator. Fig. 5: Schematic view of a Ni/ZnO/IDT/LiNbO3 SAW structure.
Fig. 6-a: Wideband S11 frequency response of Ni/ZnO/IDT/LiNbO3 layered SAW structure.
Fig. 6-b: 2D representation of the calculated displacement of the particles in the Ni/ZnO/LiNbO3 heterostructure
obtained for the fundamental mode (1), third (2) and fifth (3) pseudo-harmonics.
Fig. 7: Calculated sensitivity of the Ni/ZnO/IDT/LiNbO3 structure to an applied magnetic field in the X (close
symbols) and Y (open symbols) directions for the fundamental (square) the third (circle) and the fifth (triangle) harmonics
Fig. 8: Calculated quality factor Q of Ni/ZnO/IDT/LiNbO3 structure when the magnetic field is applied in X (close
symbols) and Y (open symbols) directions for the fundamental (square) the third (circle) and the fifth (triangle) harmonics.
Fig. 9: Magnetization of the nickel thin film measured with a Vibrating Sample Magnetometer.
Fig. 10: Frequency response of IDT/LN structure (Top), Ni/ZnO/IDT/LiNbO3 characterized before (Middle) and after packaging (bottom). Note that for more clarity for reader, the first and the second curves were shifted by 120 and 60 dB respectively.
Fig.11: Experimental setup used to characterize the sensitivity of magnetic SAW sensor: (a) Magnetic filed generator, (b) Packaged SAW device under test inside the gap, (c) Network analyzer connected to the SAW device.
Fig.12: Comparison between calculated and measured relative frequency shift (Δf/f) versus the magnetic field intensity applied in the X direction (a) and the Y direction (b). Both fundamental (H1) and spatial pseudo-harmonic (H3) frequencies are investigated.
Fig.13: Calculated wave displacement in Ni/ZnO/IDT/LiNbO3 and Ni/Al2O3/IDT/LiNbO3 structured
Fig.14: Comparison between calculated and measured relative frequency shift (Δf/f) versus the magnetic field intensity applied in the X direction (a) and the Y direction (b). Both fundamental (H1) and spatial pseudo-harmonic (H3) frequencies are investigated.
Fig. 15: Evolution of Quality factor of layered structures Ni/ZnO/IDT/LiNbO3 (Square) and Ni/Al2O3/IDT/LiNbO3
(circle) versus intensity of magnetic field applied in the X (close symbols) and Y (open symbols) directions. For both structures, harmonic 5 is considered and resonance frequency is around 810 MHz for structure with ZnO and 815 MHz for the one with Al2O3.
Fig. 2: Dependence of the relative frequency shift to the magnetic field intensity in the direction parallel to the acoustic wave propagation (X direction) (a) and perpendicular direction Y (b) for different metallization ratios of IDTs.
10 20 30 40 50 60 70 -1200 -1000 -800 -600 -400 -200 0 200 400 D f/ f(pp m) Magnetic Field(mT) MR-0.8 MR-0.5 MR-0.2 (a) (b)
Fig. 3: Calculated relative frequency shift versus magnetic field intensity of Ni-IDT/quartz sensor in X, Y and Z directions. 40 80 120 160 -1200 -1000 -800 -600 -400 -200 0 200 400 D
f/f
(p
pm)
Magnetic field (mT) BX BY BZFig. 4: Calculated quality factor (Q) versus magnetic field intensity of layered magnetostrictive-piezoelectric Ni-IDT/quartz sensor. 40 80 120 0 2000 4000 6000 8000 10000 12000 14000
Q
ual
ity
factor
Magnetic field (mT) BX BYFig. 5: Schematic view of a Ni/ZnO/IDT/LiNbO3 SAW structure.
LiNbO3 ZnO
Fig. 6-a: Wideband S11 frequency response of Ni/ZnO/IDT/LiNbO3
layered SAW structure.
100 200 300 400 500 600 700 800 900 1000 1100 -6 -5 -4 -3 -2 -1 0 1 H5 H3 H1
S
11
(dB)
Frequency(MHz)Fig. 6-b: 2D representation of the calculated displacement of the particles in the Ni/ZnO/ LiNbO3 heterostructure obtained
for the fundamental mode (1), third (2) and fifth (3) harmonics.
(a) (b)
Fig. 7: Calculated sensitivity of the Ni/ZnO/IDT/LiNbO3 structure to an applied magnetic field in the X (close symbols) and Y (open symbols)
Fig. 8: Calculated quality factor Q of Ni/ZnO/IDT/LiNbO3 structure when the magnetic field is applied in X (close symbols) and Y (open
Fig. 9: Magnetization of the nickel thin film measured with a Vibrating Sample Magnetometer.
-0,2 -0,1 0,0 0,1 0,2 -0,004 -0,002 0,000 0,002 0,004
Ma
g
n
e
ti
z
a
ti
o
n
(
a
.u)
Magnetic field (Tesla)
X-axis Y-axisFig. 10: Frequency response of IdT/LN structure (top), Ni/ZnO/IDT/LiNbO3 characterized before (middle) and after packaging (dottom). Note that for more clarity for reader, the first and the second curves were shifted by 120 and 60 dB respectively.
Fig.11: Experimental setup used to characterize the sensitivity of magnetic SAW sensor: (a) Magnetic filed generator, (b) Packaged SAW device under test inside the gap, (c) Network analyzer connected to the SAW device.
Packaged SAW
sensor
(a) (b)
Fig.12: Comparison between calculated and measured relative frequency shift (Δf/f) versus the magnetic field intensity applied in the X direction (a) and the Y direction (b). Both fundamental (H1) and spatial pseudo-harmonic (H3) frequencies are investigated.
0,0 0,1 0,2 0,3 0,4 -250 -200 -150 -100 -50 0 50 100 150
D
f/
f
(pp
m)
Magnétic field (Tesla)
H1:Theoretical result H3:Theoretical result H1:Experimental result H3:Experimental result 0,0 0,1 0,2 0,3 0,4 0 10 20 30 40 50 60
D
f/f (ppm)
Magnetic field (Tesla)
H3: Theoretical result H1: Theoretical result H3: Experimental result H1:Experimental result 0,0 0,1 0,2 0,3 -250 -200 -150 -100 -50 0 50 100 150
D
f/f
(pp
m)
Magnétic field (Tesla)
H1:Theoretical result
H3:Theoretical result
H1:Experimental result
H3:Experimental result
Fig.13: Calculated wave displacement in Ni/ZnO/IDT/LiNbO3 and Ni/Al2O3/IDT/LiNbO3 structured -7 -6 -5 -4 -3 -2 -1 0 5 3 1 2 4 Ni/ZnO/IDT/LiNbO3 Ni/Al2O3 /IDT/LiNbO3 Thick ness (µm) Wave Displacement*10-11 (m) 0 Ni ZnO or Al2O3 LiNbO 3
Fig. 14: Calculated relative frequency shift in layered sensors (Circle: Ni/ZnO/IDT/LiNbO3) and (Square : Ni/Al2O3/IDT/LiNbO3) in the X (close
Fig. 15: Evolution of Quality factor of layered structures Ni/ZnO/IDT/LiNbO3 (Square) and Ni/Al2O3/IDT/LiNbO3 (circle) versus intensity of
magnetic field applied in the X (close symbols) and Y (open symbols) directions. For both structures, harmonic 5 is considered and resonance frequency is around 810 MHz for structure with ZnO and 815 MHz for the one with Al2O3.