HAL Id: hal-01709681
https://hal.archives-ouvertes.fr/hal-01709681v2
Submitted on 29 Jul 2019HAL is a multi-disciplinary open access archive for the deposit and dissemination of sci-entific research documents, whether they are pub-lished or not. The documents may come from teaching and research institutions in France or abroad, or from public or private research centers.
L’archive ouverte pluridisciplinaire HAL, est destinée au dépôt et à la diffusion de documents scientifiques de niveau recherche, publiés ou non, émanant des établissements d’enseignement et de recherche français ou étrangers, des laboratoires publics ou privés.
In-house time-resolved photocrystallography on the
millisecond timescale using a gated X-ray hybrid pixel
area detector
Nicolas Casaretto, Dominik Schaniel, Paul Alle, Emmanuel Wenger, Pascal
Parois, Bertrand Fournier, El-Eulmi Bendeif, Cyril Palin, Sébastien Pillet
To cite this version:
Nicolas Casaretto, Dominik Schaniel, Paul Alle, Emmanuel Wenger, Pascal Parois, et al.. In-house time-resolved photocrystallography on the millisecond timescale using a gated X-ray hybrid pixel area detector. Acta Crystallographica Section B, Structural Science, Crystal Engineering and Materials, International Union of Crystallography, 2017, 73 (4), pp.696 - 707. �10.1107/S2052520617009234�. �hal-01709681v2�
In-house time-resolved photocrystallography on the millisecond
timescale using a gated X-ray hybrid pixel area detector
Nicolas Casarettoab, Dominik Schanielab, Paul Alleab, Emmanuel Wengerab, Pascal Paroiscab,
Bertrand Fournierdab, El-Eulmi Bendeifab, Cyril Palinab and Sébastien Pilletab*
aCRM2, UMR 7036, Université de Lorraine, Vandoeuvre-les-Nancy, 54506, France b
CRM2, UMR 7036, CNRS, Vandoeuvre-les-Nancy, 54506, France
c
Chemistry research laboratory, University of Oxford, 12 Mansfield road, Oxford, OX1 3TA, United Kingdom
d
UFR Pharmacie, Institut Galien Paris-Sud, 5, rue J.B. Clément, Chatenay-Malabry, 92296, France
Correspondence email: sebastien.pillet@univ-lorraine.fr
Funding information Agence Nationale de la Recherche (award No. ANR-12-BS07-0030-02); Centre
National de la Recherche Scientifique; Université de Lorraine.
Synopsis We report a new experimental methodology for time-resolved X-ray diffraction after pulsed laser excitation using a gated hybrid pixel X-ray detector with dedicated pump probe mode, and implemented on a laboratory diffractometer.
Abstract With the remarkable progresses of accelerator-based X-ray sources in terms of intensity and brightness, the investigation of structural dynamics from time-resolved X-ray diffraction methods is becoming widespread in chemistry, biochemistry, and materials science applications. Diffraction patterns can now be measured down to the femtosecond time-scale using X-ray free electron lasers or table-top laser plasma X-ray sources. On the other hand, the recent developments in photon counting X-ray area detectors offer new opportunities for time-resolved crystallography. Taking advantage of the fast read-out, the internal stacking of recorded images, and the gating possibilities (electronic shutter) of the XPAD hybrid pixel detector, we implemented a laboratory X-ray diffractometer for time-resolved single crystal X-ray diffraction after pulsed laser excitation, combined with transient optical absorption measurement. The experimental method and instrumental setup are described in details, and validated using the photoinduced nitrosyl linkage isomerism of sodium nitroprusside Na2[Fe(CN)5NO].2H2O as a proof of principle. Light induced Bragg intensity relative variations
∆I(hkl)/I(hkl) of the order of 1%, due to the photoswitching of the NO ligand, could be detected with 6 ms acquisition window. The capabilities of such a laboratory time-resolved experiment are critically evaluated.
2
1. Introduction
There is a strong demand in broad areas of today’s physics, chemistry, and biology on the precise characterization of the structure of materials and its evolution in time. The structural dynamics of complex systems built from many atoms involve intermediates and transition states on a multidimensional energy landscape. In the solid state, the whole processes may cover 15 orders of magnitude in time, from femtoseconds to seconds. Electronic motions are the fastest processes in the femtosecond and femtosecond regime, atomic motions and molecular vibrations occur in the sub-picosecond time scale (Bertoni et al., 2015; Collet et al., 2012; Lorenc et al., 2009; Lorenc et al., 2012), optical and acoustic phonons (lattice vibration) occur in the ps time scale (Lindenberg et al., 2000; Sokolowski-Tinten & von der Linde, 2004), while heat diffusion and thermal transfers in crystalline solids happen in slower time scale (Bertoni et al., 2015; Collet et al., 2012; Lorenc et al., 2009; Lorenc et al., 2012). The μs-ms range is dominated by macroscopic transformations in crystals, such as domain and domain wall dynamics in ferroic crystals (polarization switching in ferroelectrics) (Grigoriev et al., 2006; Issenmann et al., 2012), propagation of macroscopic elastic deformations (ref); this timescale corresponds also to the lifetime of long-lived molecular metastable states. In the past decade, time-resolved laser pump/X-ray probe techniques proved to be important approaches for investigating structural dynamics in gases, solids and liquids down to the femtosecond time scale (Chen, 2004; Kim
et al., 2015; Dwayne Miller, 2014; Chergui & Zewail, 2009, Patterson, 2014). The common
measurement method consists in aligning jointly a pulsed laser and pulsed X-ray beam on the sample, and synchronizing the two pulses with an adjustable time delay ∆t between laser pump and X-ray probe. Varying the time delay, the corresponding X-ray scattered or absorbed signal provides a direct monitoring of the light-induced structural evolution of the sample as a function of time delay. Dedicated time-resolved X-ray absorption and X-ray diffraction instruments have been developed at synchrotron radiation facilities, where the effective highest time resolution is defined by the synchrotron bunch duration, typically in the 50-100ps range (Chollet et al., 2015; Ejdrup et al., 2009; Ichiyanagi et al., 2009; Wulff et al., 2002; Nozawa et al., 2007). The frequency of the pump-probe cycles is given by the orbit time (2.82 s at ESRF, 1.18 s at SOLEIL, 3.68 s at APS for instance) and the filling mode of the storage ring (uniform filling, single bunch mode, …), and make use of phase-locked mechanical choppers to select individual X-ray pulses (Cammarata et al., 2009; Gembicky et al., 2009). Recently, time resolution in the femtosecond time regime has been achieved using the slicing technique at synchrotron radiation facilities, (Beaud et al., 2007; Laulhé et al., 2015) or X-ray free electron lasers (XFEL) operating in the hard X-ray regime (Patterson, 2014). Efforts have been made also on the laboratory scale, with laser-driven plasma table-top sources offering an attractive
3 alternative to accelerator-based sources (Zamponi et al., 2009; Elsaesser & Woermer, 2014). Monochromatic X-ray pulses are generated by focusing very intense femtosecond optical laser pulses onto a metallic target (Cu or Ti), producing characteristic K hard X-ray pulses of typically 100 fs duration. These plasma sources are however rather complex and laborious to operate.
Two different instruments for measuring the X-ray diffraction pattern of optically excited crystals based on a conventional in-house diffractometer have been reported by the group of P. Coppens. The very first experiment reported in 1994 used a high power continuous laser, a conventional X-ray diffractometer and a gated X-ray scintillation point detector (White et al., 1994). The laser beam was chopped with a mechanical chopper, which consisted of a slotted blade rotating in front of the laser to produce periodic laser pulses of frequency and width adjustable through the blade rotation speed and slot width respectively. The X-ray detector was synchronized with the rotation of the chopper to adjust the pump-probe time delay ∆t. The technique was appropriate for 0.1-10 ms time resolution.
The second technique, reported in 2014, used a pulsed laser, a conventional X-ray diffractometer equipped with an integrating Charge Coupled Device detector (CCD), and an optical chopper located in the X-ray beam path (Kaminski et al., 2014). Contrary to the initial approach, the X-ray beam was chopped to produce X-ray pulses of adjustable frequency and time width. The laser pulses were synchronized with the X-ray pulses to adjust the pump-probe time delay ∆t. The advantage of this setup is the use of an area X-ray detector which covers reciprocal space more efficiently than a point detector.
The last years have seen the revolution in X-ray diffraction introduced by the novel generation of photon counting Hybrid Pixel Area Detectors (HPAD) (XPAD, PILATUS…) (Henrich et al., 2009; Pangaud
et al., 2007; Medjoubi et al., 2010; Dinapoli et al., 2011; Johnson et al., 2012; Alle et al., 2016). These
detectors can be considered as a matrix of hundred thousands of independent point detectors. Their electronics allow frame rates up to the kHz regime, and an internal time-resolution down to a hundred nanoseconds. This kind of detector may therefore be efficiently used to isolate single X-ray bunches from the pulse train of synchrotron radiation sources in stroboscopic pump-probe measurements (Lauhé et al., 2012; Jacques et al., 2016). We implemented a hybrid pixel detector on our laboratory diffractometer, originally for the study of electric-field induced structural changes (Fertey et al., 2013), and recently demonstrated also its excellent potential for high-resolution X-ray diffraction studies (Wenger, 2015; Wenger et al., 2014). Here, we report on the extension of this setup to laser pump/X-ray probe time-resolved crystallography in the millisecond time scale. We demonstrate the feasibility of this kind of experiments using the photo-induced linkage-isomerisation in Na2[Fe(CN)5NO].2H2O
4 capabilities of our setup: photo-induced variations of Bragg intensities of the order of 1% have been detected within acquisition windows as short as 6 ms, limited only by counting statistics.
The paper is organized as follows. In the first section, we describe the different elements of the experimental setup and the appropriate measurement methods for millisecond time-resolved photocrystallography. In the second part, the results of photo-induced linkage-isomerisation in SNP is reported.
2. X-ray diffractometer for in-house time-resolved photocrystallography
We have initially designed an experimental approach to perform X-ray diffraction on single crystal under in situ electric field perturbation using a specific pump-probe mode called the field-switching method (Fertey et al., 2013). It consists in the application of a periodic four-step electric field (E=E+,
0+, E-, 0-) on the sample, and measuring the diffraction signal in a quasi-static mode sequentially during
the four steps. The corresponding structural response of the crystal can be investigated through the electric field induced position shift ∆θ and relative intensity variation ∆I/I of Bragg peaks. A setup based on a laboratory X-ray diffractometer was elaborated using a fast hybrid pixel area detector XPAD gated in synchronization with the four electric field steps applied on the crystal. A dedicated firmware allowing adapted architecture of the internal electronics of the detector permitted multiplexing and stacking inside the detector of the four different diffraction frames corresponding to the four measurement steps. An appropriate statistics was achieved by the internal summation of numerous pump-probe cycles leading to four images read out of the detector as a final result of the experiment.
Based on this operational experiment and methodology, a new setup has been developed for light-induced time-resolved crystallography. The approach combines two experiments performed simultaneously on the same single crystal sample on the diffractometer : (1) time-resolved light-induced X-ray diffraction, and (2) transient optical absorption spectroscopy. These two experiments provide the optical and structural response of the crystal under in situ pulsed laser excitation as a function of time.
2.1. The pump-probe approach using a gated X-ray photon counting XPAD detector
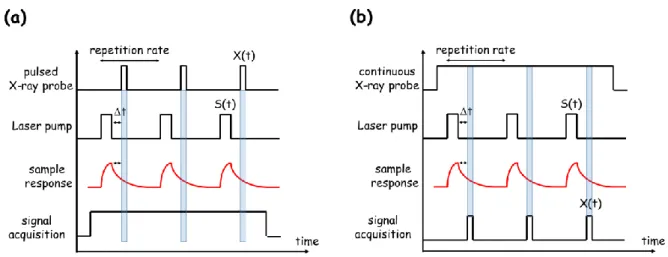
Time resolved X-ray photocrystallographic experiments are conveniently performed using a sequential stroboscopic scheme. Depending on the type of X-ray source, laser pump, and X-ray detector, there are essentially two different schemes for performing pump-probe measurements, as illustrated in figure 1.
5 (1) In the first case (fig. 1 left), the X-ray probe beam consists of a sequence of short X-ray pulses X(t), whose frequency defines the overall time scale of the experiment. During an individual cycle, a dynamical process is initiated by applying a short laser pulse to the crystal, whose response is monitored after a tunable time delay Δt through the X-ray scattered signal. The sample response may be of different kinds, such as transient
population of metastable state species, change of crystal
symmetry, whose signature is detected by a transient modification of Bragg peak intensity,
shape or position.
Pump laser pulses S(t) are accurately synchronized with the train of X-ray pulses, adjusting the desired time delay Δt. The signal scattered by the crystal sample occurs only during the X-ray pulses X(t), so that a conventional integrating CCD or Image Plate detector is convenient. The pump-probe cycles are repeated until a satisfactory signal to noise ratio is achieved to provide on the detector a summed scattered signal, signature of the transient structure of the sample averaged over X(t). These experiments are typically based on the intrinsic time structure of synchrotron radiation, plasma sources, or XFELs, and make use of phase-locked mechanical choppers to select X-ray pulses ; the X-ray pulse duration X(t) is in the range of hundreds of picoseconds to femtoseconds. The time resolution is controlled by the pump and probe pulse widths 𝜏𝑝𝑢𝑚𝑝 and 𝜏𝑝𝑟𝑜𝑏𝑒respectively), themismatch in the temporal overlap between the pump and probe pulses (𝜏𝑚𝑖𝑠𝑚𝑎𝑡𝑐ℎ), and the timing
jitter between the pump and probe pulses (𝜏𝑗𝑖𝑡𝑡𝑒𝑟) :
𝜏 = (𝜏𝑝𝑢𝑚𝑝2 + 𝜏𝑝𝑟𝑜𝑏𝑒2 + 𝜏𝑚𝑖𝑠𝑚𝑎𝑡𝑐ℎ2 + 𝜏𝑗𝑖𝑡𝑡𝑒𝑟2 )1 2⁄ .
(2) In the second approach (fig. 1 right), a continuous X-ray beam is delivered by a rotating anode or a conventional X-ray tube. During the pump-probe cycle, the structure of the crystal sample is continuously changing, as well as the scattered signal on the X-ray detector. In order to probe the transient structure, the scattered signal is sampled by using a fast-gated detector such as a hybrid pixel photon counting detector, a streak camera, or an avalanche photodiode. The effective recording of the signal by the detector occurs only during a short adjustable window X(t). In that case, the laser pulse serves as a trigger for the gating of the detector, and synchronization with a tunable time delay Δt. The maximum time resolution is in that case also dependent of the electronic response time of the X-ray detector:
𝜏 = (𝜏𝑝𝑢𝑚𝑝2 + 𝜏𝑝𝑟𝑜𝑏𝑒2 + 𝜏𝑚𝑖𝑠𝑚𝑎𝑡𝑐ℎ2 + 𝜏𝑗𝑖𝑡𝑡𝑒𝑟2 + 𝜏𝑑𝑒𝑡𝑒𝑐𝑡𝑜𝑟2 ) 1 2⁄
6 Figure 1 Principle of time-resolved X-ray scattering pump-probe measurement with (a) an intrinsically pulsed ray beam (e.g. synchrotron, plasma source or XFEL), (b) a quasi-continuous X-ray beam with a scattered signal sampled by a fast-gated detector (only one delay is depicted here). The sample response may be considered as a metastable state population
These two schemes have a different impact on the X-ray scattered signal-to-noise ratio (noise is here considered as the estimated standard deviation on the measured signal). In the first case, the X-ray detector acquires the signal continuously, but scattering from the sample occurs only during X(t) (blue areas in figure 1). If a CCD detector is used, the statistics of the experiments suffers from CCD read-out noise and dark current. On the contrary, a gated hybrid pixel detector, such as our XPAD detector, is governed by photon counting statistics, and does not suffer from dark current and read-out noise. Signal acquisition is defined by tuneable measurement time windows (X(t) in figure 1 right) whose temporal width is only limited by the detector response time (150 ns for XPAD). For a laboratory based time-resolved experiment, a hybrid pixel detector is therefore very advantageous.
Another major difference between the two schemes is the possible number of simultaneous measurement windows. In the first case, only one X(t) window, corresponding to one delay Δt can be acquired by the detector at the same time. The experiment should be reproduced for different delays to collect a complete temporal dynamics. In the case of the XPAD detector, the firmware allows collecting and stacking simultaneously four different images, as described above for the sequential four-step electric field measurement. The adaptation to the present photocrystallographic method leads to four different time delays being acquired simultaneously and stacked inside the detector; figure 1 right illustrates only one measurement window, the principle for the four-delays measurement is shown in figure 2 and 3.
7
2.2. Layout of the instrument
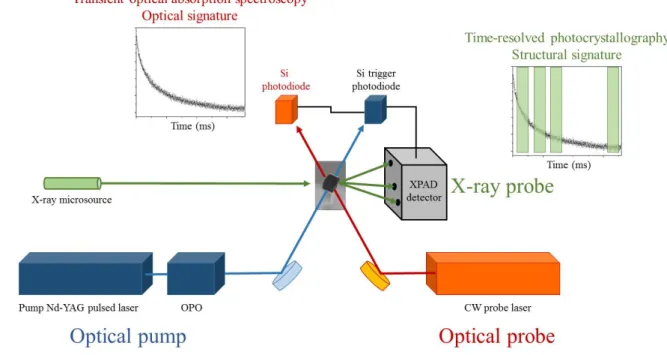
Our time-resolved light-induced diffraction setup is following the second scheme described in the previous section, using a gated hybrid pixel area detector XPAD. The instrument consists of several elements combined in two simultaneous experiments : time resolved diffraction and transient absorption spectroscopy. A layout of the instrument is given in figure 2.
Figure 2 Schematic of the combined time-resolved X-ray diffraction and transient absorption spectroscopy experiments.
The pump system consists of a Surelite II-10 Nd-YAG pulsed laser equipped with an optical parametric oscillator (OPO, model SLOPO+). The system delivers laser pulses with 3-5 ns duration at a frequency of 10 Hz. The OPO is tuneable in the range 400-700 nm. The laser beam is directed to the single crystal sample on the diffractometer using a series of silver-coated mirrors and precisely adjusted and focussed through appropriate lenses to illuminate the crystal uniformly (i.e. the beam is larger than the crystal). A pump-probe cycle is defined by the time between two laser pulses (100 ms at 10 Hz frequency of the Surelite II-10 system). During 100 ms, the single crystal sample is excited once at t=0, followed by a temporal evolution. The molecules in the sample are for instance excited by the pump laser pulses at t=0, and then recover the ground state within 100 ms through possible intermediate transient states, so that the sample is recovering the ground state before the next laser pulse; this is mandatory for such a stroboscopic scheme. If a lower repetition rate, corresponding to a longer pump-probe cycle is required, a fast shutter can be installed at the output of the pump laser to select a fraction of the pulses out of the pump laser sequence (e.g. one pulse over two, …).
8 Using a pinhole of 110 µm in diameter (typical of a single crystal sample size and X-ray beam size of our diffractometer), the pump laser photon flux on the sample position has been evaluated to 9.1018
photons.cm-2 per pulse at 450 nm. For the SNP crystal that we chose for our subsequent validation,
this corresponds to nearly 2000 photons per molecule per laser pulse.
2.2.1. Single crystal transient absorption spectroscopy
It is usually convenient to completely characterize the photo-physical properties of the sample using transient optical absorption spectroscopy or luminescence as a function of temperature in a prior experiment to prepare the subsequent photocrystallographic investigation. Such optical studies of the photoexcitation process allow defining important parameters such as : photoexcitation efficiency, thermal relaxation properties (activation energy, frequency factor), number of transient excited states, population evolution of the excited states, reversibility of the complete process, bleaching effects. It is especially important to assess the reversibility of the photoexcitation with respect to the frequency of the envisioned pump-probe measurement (repetition rate in figure 1). For our purpose, we decided to develop a transient optical absorption spectroscopy experiment centred on the crystal mounted on the X-ray diffractometer, allowing performing the optical measurement simultaneously with the photocrystallographic one. The system consists of a continuous optical probe laser aligned on the crystal sample, and focussed to a diameter smaller than the diameter of the pump laser at the sample position, in order to achieve a perfect spatial overlap. The transmitted light is detected with a 200 MHz Si-Pin diode from Femto Messtechnik GmbH. Interference filters are mounted in front of the probe diode to attenuate the pump laser light.
2.2.2. Time-resolved photocrystallography with the XPAD detector
The X-ray diffraction experiment is based on a modified Bruker-Nonius Mach3 four-circle diffractometer equipped with a molybdenum Incoatec microfocus X-ray source, and a nitrogen gas flow cryogenic system (Wenger, 2015). The typical X-ray beam size at the sample position is of the order of 100 µm, and the photon flux is estimated to 2.109 ph.s-1.cm-2. The complete goniometer
movements are controlled by a prototype software to avoid any collisions with all the optics, optics holders, and X-ray source elements. This is automatically taken into account in the preparation of the optimized diffraction data collection strategy.
The most important element of the setup is the X-ray hybrid pixel area detector XPAD S270. We have previously presented the working principle of hybrid pixel detectors and compared their
9 characteristics with CCD and CMOS detectors (Allé et al., 2016), and we described the specific stacking pump-probe mode of the detector (Fertey et al., 2013), so that only the main characteristics for the present photocrystallographic concerns are recalled here. The XPAD consists of 4 modules arranged horizontally in a flat geometry. Each module contains seven chips each consisting of 9600 pixels (pixel size 130×130 µm2). The resulting images have a size of 75×73 mm2, including blind areas separating
the different modules. The X-ray photons are absorbed by the upper 300 µm thick silicon sensor layer with 37% absorption efficiency for Mo energy. Each X-ray photon is converted into one electrical pulse that is individually counted for each pixel by an independent counting channel (12-bit counter value). Each pixel counting channel is controlled by an electronic gate, so an electrical gate signal (logical value 1 or 0) enable or disable the counting process (open or close the gate), this function is the so-called electronic shutter and can switch as fast as 150 ns (which sets the shortest possible image X-ray exposure time and is short enough for single bunch experiment at synchrotron). Once the acquisition is over, the counter values of the pixels (9600 for each electronic chip) are transferred (read) to the electronic board in tR = 1.7 ms. Once the reading is done, the image can be processed on the board
inside the detector, independently of what occurs on the chip, so that the chip can start immediately a new acquisition while the previous image is processed. The electronic board consists of a FPGA (Field Programmable Gate Area) and fast memory (SRAM). A dedicated firmware configures the architecture of the electronic inside the FPGA to allow controlling and reading of all the pixels as well as multiplexing, summing and storing images in four different channels modulo 4 in synchronization with the gate signal (fig 3). This is the so-called IPI (Image Plus Image) mode. Hereafter, we consider a complete acquisition as a repetition of N pump-probe cycles. Four frames are collected during each cycle, separately summed (in the FPGA) with the frames measured during the previous cycles and stored in the SRAM, this is called stacking. The output of the measurement is therefore simply four different summed images. This stacking processing in the FPGA is performed in tS = 3.7 ms. This process
is illustrated in figure 4. The stacking is independent of the photon counting process in the chip, so that the stacking stage can be initiated while the next image is exposed to X-rays. The blind time between two successive image measurements is the read time tR (1.7 ms). The reading-stacking
process is triggered by the end of the gate and before reading a new image the FPGA must have finish the stacking of the previous one so that the minimum delay between the end of two successive images (minimum sampling period) is the read time tR plus the stacking time tS 1.7+3.7 = 5.4 ms. For the
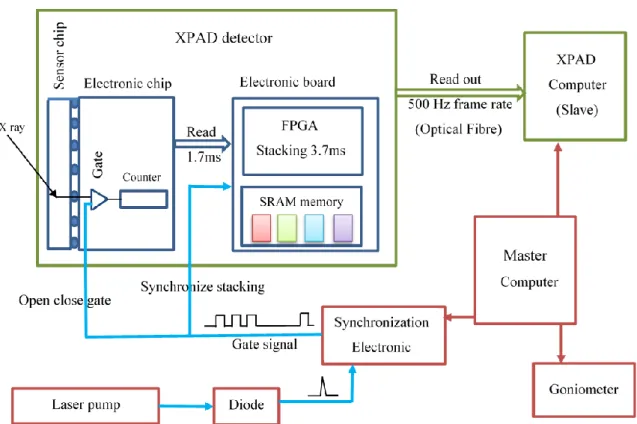
time-resolved X-ray diffraction experiment, the XPAD computer is in slave mode and is driven by a master computer that also controls the goniometer and a specific electronic to generate the gate signals (fig 3). The pump signal is monitored with a Si-Pin diode located in the OPO system. For each laser pump
10 pulse the diode generates an output voltage which triggers the electronic to generate the four gate signals with adjustable time and delay.
Figure 3 Instrumental setup. A master computer drives the goniometer, the XPAD computer and a synchronization electronic. The pump laser works at 10 Hz, the master computer positions the XPAD detector in stacking mode (waiting for acquisition) and then sends the start scan to the goniometer and the start acquisition to the electronic. The electronic triggered by the diode pulse generates the gate signal to open and close the electronic shutter, and to synchronize the stacking processing. At the end of the scan the XPAD computer reads out the four images resulting from the internal stacking.
11 Figure 4 Schematic time structure of the laser pump-X-ray probe measurement strategy. The laser frequency is 10Hz, corresponding to 100 ms between two laser pulses. The laser pulse duration is 4 ns. The Image Plus Image (IPI) mode of the XPAD offers at present the acquisition and internal stacking of 4 frames (noted F#1…F#4 and colour coded red, green, blue and pink in the figure). F#4 is taken as the reference frame just before the laser pulse. “R” is the read time of each frame (tR = 1.7 ms). “S” is
the internal stacking of each frame (tS = 3.7 ms). tf is the exposure time, which could be as short as 150
ns, the time resolution of the internal electronics of the detector. The minimum sampling period is 5.4 ms.
12 The investigation of light-induced structural dynamics requires a precise measurement of the Bragg intensities I(hkl) as a function of time. As explained above, the XPAD detector allows collecting four different frames sampled between one pump-probe cycle. One frame (F#4 in figure 4) is systematically adjusted exactly at the end of the cycle, just before the next laser pulse. This frame is used as a reference for the ground state, for instance to compute I#1(hkl)/I#4(hkl) intensity ratios, where I#4(hkl) (resp. I#1(hkl)) Bragg intensities are obtained from integration of the Bragg peaks in frame F#4 (resp. F#1). Two scanning modes are implemented, corresponding to two different types of measurement as illustrated in figure 5.
In the first type of measurement, the goniometer holding the single crystal sample is continuously rotated while the pump-probe cycles are collected (continuous rotation scan mode). This is similar to the crystal rotation method in conventional single crystal X-ray crystallography. The maximum rotation speed of our MACH3 goniometer is nearly 2deg/min, so that even a very narrow Bragg peak with a mosaïcity of 0.1deg will be accurately sampled at 10 Hz : the complete peak profile will span at minimum 30 pump-probe cycles, and therefore 30 times (F#1…F#4).
For the second type of measurement, the crystal is rotated step by step (M’ different steps), and for each step, N’ complete pump-probe cycles are recorded (the total number of cycles is therefore M’×N’). A very fine slicing of the Bragg peak profile may thus be achieved.
Figure 5 Chronogram of the measurement sequence in the (left) continuous rotation scan (CRS) mode, and (right) step scan (SS) mode. In the CRS mode, the images are measured “on the fly” during the rotation of the crystal, therefore corresponding to N pump-probe cycles. In the step scan mode, an acquisition consisting of N’ pump-probe cycles is measured for each of the M’ goniometer rotation positions.
13
2.2.3. Intensity statistics of time-resolved photocrystallography with the XPAD detector
The XPAD detector is a photon counting hybrid pixel detector. Using diffraction measurement tests, we have verified that the intensity statistics of the XPAD detector obeys the main characteristic of Poissonian statistics, in particular the intensity variance is equal to the mean intensity (Wenger, 2015). As a matter of fact, the measured intensity on a given pixel 𝐼𝑖 corresponds to the number 𝑁𝑖 of
absorbed photons (37% efficiency for 300 µm thick silicon sensor at Mo Kα radiation) above the discrimination threshold collected during the X-ray exposure time X(t), and the signal variance is 𝜎2(𝐼
𝑖) = 𝑁𝑖 (Alle et al., 2016). The total intensity of a Bragg reflection is in a first approximation a
direct summation of the intensity of all the pixels under the peak I𝑝𝑒𝑎𝑘 = ∑𝑝𝑖𝑥𝑒𝑙𝑠𝐼𝑖 = ∑𝑝𝑖𝑥𝑒𝑙𝑠𝑁𝑖, and
the corresponding variance is 𝜎2(𝐼𝑝𝑒𝑎𝑘) = ∑𝑝𝑖𝑥𝑒𝑙𝑠𝑁𝑖 = 𝐼𝑝𝑒𝑎𝑘 if one assumes no pixel to pixel correlations. This is true if one works directly on the raw frames without applying any distortion or flat field calibrations.
In the context of time-resolved photocrystallography using a photon counting hybrid pixel detector, the important issue is the detection of a significant scattered (relative) intensity difference. The total intensity of a Bragg peak is directly proportional to the exposure time and angular rotation speed of the crystal, which are tuneable parameters of the experience. It is also common to repeat the pump-probe cycles until a satisfactory statistics is achieved. In our experience, we want to detect an intensity difference between frame F#1, F#2, F#3 with respect to frame F#4. For a given Bragg peak, if one wants to detect a 1% intensity difference with a 3σ confidence level, the minimum intensity of the ground state (F#4) peak is nearly 180000 counts.
𝐼#1− 𝐼#4 = 0.01 × 𝐼#4
𝜎2(𝐼
#1− 𝐼#4) = 𝐼#1+ 𝐼#4 if one assumes no correlation between I#1 and I#4.
𝐼#1− 𝐼#4 > 3 × 𝜎(𝐼#1− 𝐼#4)
𝐼#4 > 180900
This value is quite general, and may be used systematically as an indicator for the preparation of a real experiment with our system.
3. Experimental validation : time resolved crystallography of photo-induced linkage isomerism in sodium nitroprusside Na2[Fe(CN)5(NO)].2H2O
To assess the possibilities and limitations of such pump-probe X-ray diffraction experiments based on a laboratory setup, we have designed a validation experiment using a prototype molecular photoswitchable material, namely sodium nitroprusside Na2[Fe(CN)5(NO)].2H2O (SNP). SNP exhibits
14 light-induced linkage isomerism, a photochemical effect, which results in the rotation of the nitrosyl ligand NO upon visible photon absorption, and formation of two long-lived metastable states. MS2 is formed by a rotation of the nitrosyl by nearly 90 degrees, leading to a side-bonded coordination mode, while MS1 results from a nearly 180 degrees rotation to an isonitrosyl Fe-ON coordination mode as revealed by photocrystallographic techniques (Carducci et al., 1997; Fomitchev & Coppens, 1996; Schaniel et al., 2005a; Schaniel et al., 2006). The complete photophysics of SNP is well understood from time-resolved UV-visible absorption spectroscopy and time-resolved infrared spectroscopy (Schaniel & Woike, 2009; Schaniel et al., 2010). The mechanism involves a direct Fe(3d) to π*(NO) metal-to-ligand charge transfer transition (MLCT) or indirect transition as a relaxation from excited higher lying d-states into the π*(NO). After such an electronic excitation, the NO ligand undergoes a rotation by about 90° within 300 fs (Schaniel et al., 2010). This fast internal conversion from the excited GS potential into the MS2 potential is followed by a vibrational relaxation to the MS2 minimum, which occurs within about 10 ps (Gallé et al., 2012). MS1 and MS2 are local minima on the potential energy surface of the ground electronic state, they lay about 1.05 eV (MS1) and 0.95 eV (MS2) above the GS minimum, and they are separated by an energy barrier of 0.69 eV (MS1) and 0.43 eV (MS2) from the GS (Woike et al., 1993).
The validation measurement has been conducted as follows. In the first step, X-ray diffraction measurements have been performed at T=100 K in the ground state and long lived metastable state MS2 in order to get complete X-ray diffraction data sets which could be used to simulate the time-resolved photocrystallographic experiment, and select the Bragg intensities which exhibit the highest GS to MS2 intensity contrast. In the second step, a complete stroboscopic time-resolved measurement was conducted to derive the optical response (transient absorption spectroscopy measurement) and structural response of the sample.
3.1. X-ray diffraction of the GS and MS2 states in photostationnary conditions
In a first step, a conventional measurement in the ground state (GS) has been performed at T=100 K. The diffraction frames have been indexed and integrated using the Crysalis software (Agilent, 2014) yielding 12675 (2658 unique) measured reflections up to a maximum resolution of sin(θ)/λ = 0.82 Å−1 (Rint = 0.013). The corresponding crystal structure has been refined using the Shelxl software
(Sheldrick, 2008). In a second step, the crystal was irradiated with a photodiode at 445 nm during 4 hours, populating MS1 and MS2 states at the same time. The crystal was subsequently irradiated at 1064 nm during 10 minutes to transfer MS1 molecular states to MS2 and to the ground state. The final single crystal contains therefore only molecules in the ground state and molecules in the metastable state MS2 (Schaniel et al., 2002). Diffraction data have been collected in this state up to a maximum
15 resolution of sin(θ)/λ = 0.82 Å−1 (9586 measured reflections, 2630 unique reflections, R
int = 0.016). A
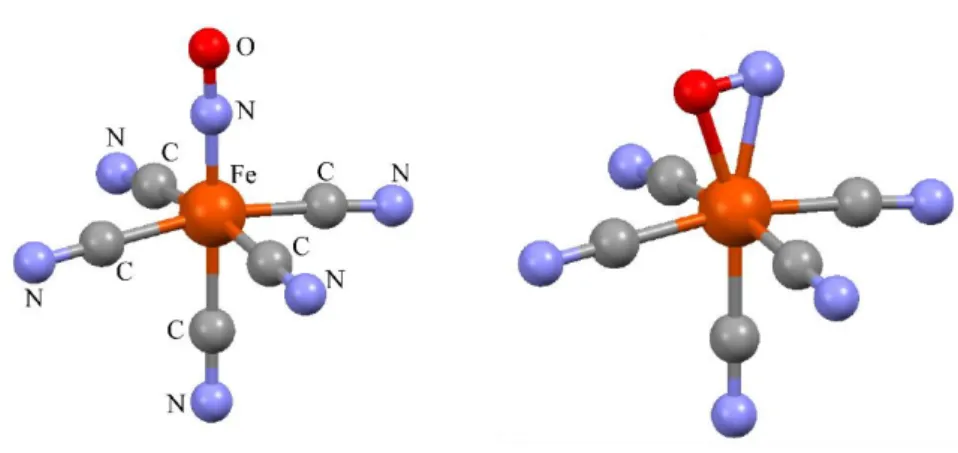
numerical absorption correction has been performed for the two data sets. The excellent internal agreement factors attest of the high accuracy of the corresponding data. The crystal structure of the GS+MS2 state has been refined assuming two molecular configurations GS and MS2. A simple model was constructed to refine the structure: the basis structure was derived from the ground state structure. The nitrosyl atoms were separated in two configurations : GS N-O, and MS2 side bonded N-O. The positions of all the atoms except N-O correspond therefore to an average position between the ground state and MS2 positions. The atomic displacement parameters of N and O in the two configurations were constrained to be identical. The refinement converged to R1 = 0.022 and wR2 = 0.057. The refined population of MS2 is only 2(1)%. The GS and MS2 structural models are shown in figure 6.
Figure 6 Refined structural models of the ground state (GS, left) and metastable state (MS2, right) of SNP.
3.2. Simulation of structural changes and diffracted intensity contrast factors
In order to assess the contrast in Bragg peak intensity difference we might expect from the time-resolved X-ray diffraction experiment, we have performed the following analysis. Starting from the measured Bragg intensities in the ground state and in the metastable state MS2 in the photostationnary state presented in the previous section, we have calculated the corresponding normalized intensity difference:
∆𝐼 𝜎(∆𝐼)=
𝐼𝑀𝑆2(ℎ𝑘𝑙) − 𝐼𝐺𝑆(ℎ𝑘𝑙)
𝜎(𝐼𝑀𝑆2(ℎ𝑘𝑙)) + 𝜎(𝐼𝐺𝑆(ℎ𝑘𝑙))
As discussed above, the intensity statistics on the hybrid pixel detector XPAD follows counting statistics, so that the previous equation is simply:
16 ∆𝐼
𝜎(∆𝐼)=
𝐼𝑀𝑆2(ℎ𝑘𝑙) − 𝐼𝐺𝑆(ℎ𝑘𝑙)
√(𝐼𝑀𝑆2(ℎ𝑘𝑙)) + √(𝐼𝐺𝑆(ℎ𝑘𝑙))
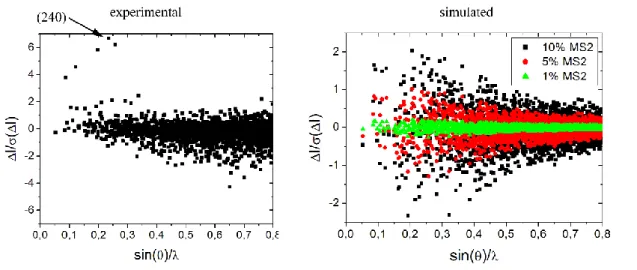
This experimental intensity contrast is shown in figure 7.
Figure 7 (left) Experimental contrast ∆𝐼
𝜎(∆𝐼) as a function of sin(𝜃)
𝜆 for SNP calculated from the measured
ground state and metastable state MS2 in the photostationnary state. The arrow points to the (240) reflection whose intensity is monitored in the time-resolved photocrystallographic experiment. (right) simulated contrast calculated from the ground state and MS2 state refined structural models for hypothetical 1%, 5% and 10% populations of the metastable state MS2.
A similar analysis was performed for the simulated intensity contrast, calculated from the ground state and MS2 state refined structural models for hypothetical 1%, 5% and 10% populations of the metastable state MS2. As can be seen in figure 7 (right), at PMS=10% MS2, the intensity contrast is
significant for sodium nitroprusside between the ground state and metastable state MS2. 104 reflections over 2616 analysed reflections have intensity variation greater than the estimated standard deviation. This becomes much more challenging at PMS=1%, at which a very high accuracy is
required to detect the structural reorganisation characterizing MS2. No reflections exhibit signal to noise ratio better than 0.2. This simulation shows that an extremely high accuracy will be required in the time-resolved measurement.
According to this simulation, we identified the (240) reflection (see figure 7 left), which is one of the strongest Bragg reflection, at low angle, and with a high intensity difference between the ground state and the metastable MS2 state. This reflection will be monitored precisely in the time-resolved photocrystallographic experiment.
17
3.3. Results from transient absorption spectroscopy
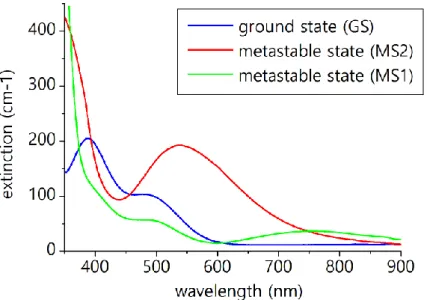
The optical absorption spectra of the three states of SNP (GS, MS1, and MS2) are given in figure 8. The absorption spectrum of the ground state is dominated by two bands located at 388 nm and 495 nm, corresponding to Fe(3d) to π*(NO) metal to ligand charge transfer (Schaniel et al., 2002). In the MS1 and MS2 states, new bands appear at 755 nm and 560 nm respectively owing to the shift in energy of the molecular orbitals (Schaniel et al., 2002). In view of these spectra, appropriate wavelength for the pump and optical probe lasers can be chosen. The OPO of the pump system has been tuned to 450 nm, while a probe laser at 633 nm was selected, at which MS2 state exhibits a high absorption and at the same time MS1 and GS exhibit a low absorption. 633 nm is therefore very sensitive to the population of MS2.
Figure 8 Optical absorption spectra of SNP in the different states. (adapted from Schaniel et al., 2002).
Transient optical measurements have been conducted as a function of temperature over the 150-250K temperature range with the pump laser polarization direction oriented along the crystalline c axis in order to enhance the optical response (Schaniel et al., 2005b); the corresponding trace at 150K is shown in figure 9. As can be seen, a rapid decrease of transmitted intensity occurs, which recovers in a second step. The decrease can not be resolved with the resolution of our setup; it has been shown by Schaniel et al. (2010) that the population of MS2 state occurs on the femtosecond time scale. The intensity decrease at 633 nm corresponds to an increase of absorption, consistent with a population of MS2 state (see figure 8). The subsequent intensity increase corresponds to the thermally activated relaxation of MS2 to the ground state. For each temperature, the intensity as a function of time was
adequately fitted to an exponential dependence I(t) = I0+ ∆Imaxe−
t
18 corresponding to a temperature dependent relaxation rate kMS2→GS(T)=1/; at T=150K, the fitted time
constant is τ = 14 ms. The rate constants are plotted in figure 9 in the form of an Arrhenius plot
ln (1
τ) = ln(𝑍) − 𝐸𝑎
𝑘𝑏𝑇 with Ea the activation energy of the relaxation process, and Z the frequency factor. As seen in figure 9, the relaxation process follows a thermally activated process (linear trend), with refined parameters Ea=0.42(2) eV, and Z = 15.1013
s
-1.
These values are in perfect agreementwith values reported in the litterature (Schaniel et al., 2005b). The transient optical absorption setup is therefore validated.
Figure 9 left : transient intensity on the detection Si-pin photodiode as a function of time at T=150K.
Th red line is an exponential fit I(t) = I0+ ∆Imaxe−τt. right : Arrhenius plot ln (1
τ) as a function of
inverse temperature (1
T). The red line is a linear fit with refined parameters Ea=0.42(2) eV, and Z =
15.1013
s
-1.
3.4. Time-resolved x-ray diffraction experiments
The results of the transient absorption spectroscopy measurements shows that the dynamics of SNP at T = 150 K is appropriate for a time resolved photocrystallographic investigation permitted by our instrument. The relaxation is complete within 100 ms at this temperature, and the most important evolution occurs within the first 50 ms. Accordingly, the molecules pumped to the MS2 state by the laser pulses relax to the ground state before the next laser pulse 100 ms later at 10 Hz frequency, the recovery condition is fulfilled. Using the goniometer of the diffractometer, we have oriented the crystal so that the reflection (240) is in diffraction condition. This reflection has been selected as one of the most intense reflection with a high intensity difference between the ground state and MS2 state, according to our simulation described above. Time-resolved diffraction has been conducted using the continuous rotation scan mode, with acquisition windows of 6 ms whose centres are located
19 at time delays ∆t=3, 13, 23, 93 ms, that is 3 windows sampling the beginning of the pump-probe cycle, and one window at the end of the cycle as a reference for the ground state. In other words, the diffracted X-ray signal is integrated over 6 ms for each acquisition window (each time delay). Omega scans of 5 degrees, with 118.4 seconds per degree (scan speed ratio 32 with the MACH3 goniometer software). The complete exposure time per scan is 592 seconds. At 10Hz, 1184 pump-probe cycles occur within one degree rotation, the sampling is therefore very good. This scan has been repeated 300 times to increase the statistics, giving a total of nearly 1800000 pump-probe cycles, that is 7.2 million total images acquired (F#1…F#4). Owing to the stacking procedure, 300 times four summed diffraction frames result from the measurement. The total duration of the experiment is nearly 49 hours.
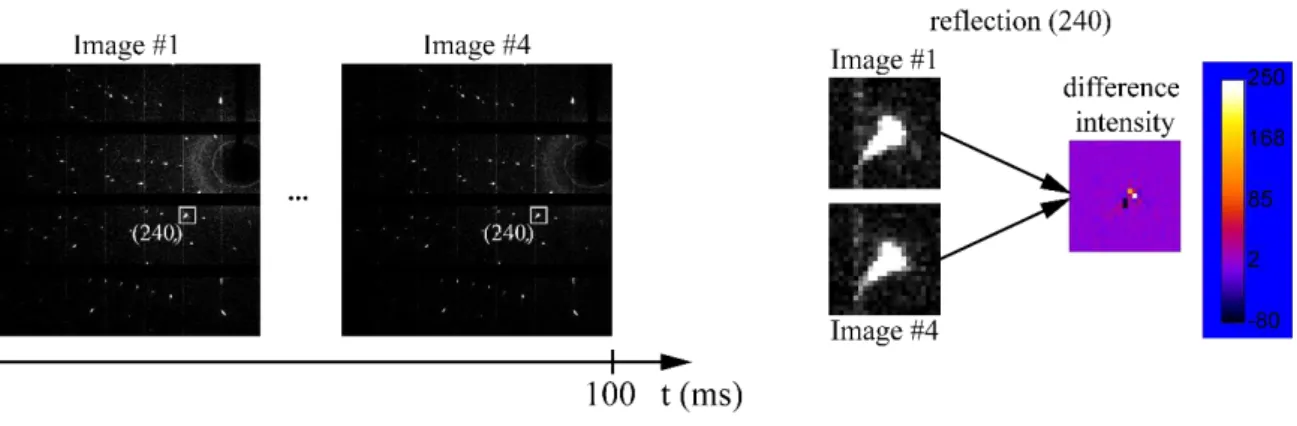
Figure 10 (left) Experimental time resolved diffraction image (image #1 and #4 of scan 43 among 300 scans). (right) zoom on the selected reflection (240), and pixel to pixel colour coded difference intensity.
An example of time-resolved diffracted images collected at scan 43 is given in figure 10 (only images #1 and #4 are shown). Image #1, and image #4 correspond to time delay ∆t = 3 and ∆t = 93 ms respectively. Bragg peak intensity and displacements are barely distinguishable directly on the images. The intensity difference in the neighbourhood of the reflection (240) evidences an intensity change, which is very significant : an intensity decrease in the lower left part of the reflection, and high intensity increase in the upper right part of the reflection. This is a definite proof that a light induced Bragg intensity change is detected with 6 ms exposure time windows. This is the signature of light induced structural changes in the crystal.
20 To analyse quantitatively the results, the intensity of the (240) reflection has been determined for each of the 300 scans by direct pixel integration and summation using a mask placed at the peak position at the four time delays. The corresponding distribution of intensity ratio I(240)#1/I(hkl)#4 is shown in the insert of figure 11 right. The histogram follows approximately a Gaussian distribution, whose position is displaced in the positive side, indicating an overall #4→#1 intensity increase, as predicted by our simulation for GS→MS2 photoswitching. The distribution shows also the consistency of the measurement and stability of the instrumental setup. The distribution results most probably from the pulse-to-pulse intensity change of the pump laser system and counting statistics. The intensity derived from the 300 scans and corresponding to time delays ∆t=3, 13, 23, 93 have been further merged separately, the results in the form of normalized intensities (I(240)#n/I(240)#4) are given in figure 11 right. A clear increase in intensity, by nearly 1.0% is obtained just after the laser pulse, the intensity then decreases continuously as a function of time during the pump-probe cycle. This is consistent with the results of the transient optical absorption measurements and of the simulation. As a matter of fact, this reflection should present an intensity increase upon GS→MS2 photoswitching. This is a further indication that the light-induced intensity changes are not due to a gradual crystal deterioration; in that case, a systematic intensity decrease would have been obtained. This result is very important, because using our experimental conditions and setup, an intensity change as low as 1% was accurately detected.
In our time resolved experiment, the metastable state population follows an exponential relaxation
𝑝(𝑡) = 𝑝0𝑒𝑥𝑝−𝑡𝜏 with initial population 𝑝0 and lifetime 𝜏 of the metastable state, so that the corresponding Bragg intensity is given by:
𝐼(𝐻⃗⃗ , 𝑡) = (𝑝(𝑡) ∗ 𝐹𝑀𝑆𝐼𝐼(𝐻⃗⃗ ) + (1 − 𝑝(𝑡))𝐹𝐺𝑆(𝐻⃗⃗ )) × (𝑝(𝑡) ∗ 𝐹𝑀𝑆𝐼𝐼∗ (𝐻⃗⃗ ) + (1 − 𝑝(𝑡))𝐹
𝐺𝑆∗ (𝐻⃗⃗ ))
For a centrosymmetric crystal like SNP, 𝐹𝑀𝑆𝐼𝐼(𝐻⃗⃗ ) and 𝐹𝐺𝑆(𝐻⃗⃗ ) are real quantities and 𝐼(𝐻⃗⃗ , 𝑡) = 𝐹2𝐺𝑆+ 2𝑝0𝑒𝑥𝑝−𝑡𝜏 ∗ (𝐹𝑀𝑆𝐼𝐼𝐹𝐺𝑆− 𝐹2𝐺𝑆) + 𝑝02𝑒𝑥𝑝
−2𝑡
𝜏 ∗ (𝐹2𝑀𝑆𝐼𝐼+ 𝐹2𝐺𝑆− 2𝐹𝑀𝑆𝐼𝐼𝐹𝐺𝑆)
We have simulated this equation for the (240) reflection, the results are given in the supplementary material. It shows that the first and second terms of this equation are in all cases dominant with respect to the last term, so that the intensity evolution of a Bragg reflection should follow in a good approximation a single exponential dependence.
The intensity ratio I(240)#1/I(hkl)#4 as a function of time has therefore been quantitatively fitted with
an exponential decay 𝑦(𝑡) = 1 + 𝐴𝑒−𝑡𝑡1 giving a time constant of t1 = 10(1) ms, in perfect agreement with the time constant derived from the optical absorption at T = 150 K : τ = 14 ms.
21 Figure 11 (left) Normalized intensity of the (240) reflection averaged over one single scan, and averaged over 100 and 300 repeated scans. (right) Normalized intensity of the (240) reflection as a function of time averaged over 300 repeated scans. The insert shows the histogram of the normalized intensity distribution over the 300 scans. The continuous line is a Gaussian fit to the distribution with average position 1.0097(4). The dashed line indicate the I1/I4=1.0 position.
The influence of the total number of measured scans on the accuracy of the derived X-ray diffraction data is evidenced in figure 11 left. As we can see, the accuracy of one single scan (nearly 6000 pump-probe cycles) is not satisfactory, the standard deviation is much too high to show a conclusive trend. Averaging over 100 scans already presents the correct trend.
The limited Bragg intensity change measured in the time-resolved diffraction experiment results from a low photoconversion efficiency. As stated in reference (Schaniel et al., 2005b), where an intensity dependent study of the light-induced absorption was made, the saturation population at a pump wavelength of 532 nm is 0.8% (using 4ns long laser pulses). The ration of the absorption cross sections at 532 nm between MSII and GS was calculated to 1.25·10-3. As a consequence, MSII absorbs about
1000 times more than GS at this wavelength. At 450 nm this ratio is smaller, but still MSII has a higher absorption cross section than GS. Therefore, obtaining a slightly higher population at 450 nm than at 532 nm pulse wavelength is consistent. Furthermore, these results are in agreement with the populations determined for MSII from low-temperature measurements using differential calorimetry (Woike et al., 1993), where for MSII saturation populations of 3% for a pump wavelength of 457.9 nm and about 0.5% for the pump wavelength of 532nm were obtained. This implies also that with the pump fluence available in our experiment we are close to saturation of the MSII population, i.e. there is an equilibrium between GS→MSII and MSII→GS processes. This again, is compatible with the fact
22 that the population of MSII occurs on a 300 fs time-scale (Schaniel et al., 2010), so within the pulse duration of 2-4 ns there is plenty of time to establish a “photostationnary” state.
4. Conclusions and perspectives
We have presented a new experimental setup based on a laboratory diffractometer, dedicated to time-resolved X-ray diffraction measurements for investigating light induced structural changes in single crystals. For that purpose, we have implemented a laser pump/X-ray probe scheme using a fast gated hybrid pixel area XPAD detector, which is triggered by the pump laser pulses, and accurately synchronized with tuneable time delays ∆t between pump and probe.
First experiments on the photoswitching dynamics of sodium nitroprusside at T=150 K are very conclusive. 1% intensity changes have been detected with a 6 ms acquisition window. According to the characteristics of the XPAD detector, much shorter acquisition windows could be envisioned, at the expense of the limited X-ray flux, and therefore estimated scattered signal, but the sampling time cannot be shorter than 5.4 ms. The present experiment overall duration was nearly 49 hours for only 5 degrees of reciprocal space covered, and showed an adequate long-term stability for 1% intensity change detection. For our prototype experiment on sodium nitroprusside, we have focussed on the reflection (240) selected according to its high intensity, and high intensity change upon GS→MS2 photoswitching. A complete time-resolved measurement covering a complete sphere of reciprocal space seems out of reach with the present setup. An appropriate selection of relevant reflections, which are very sensitive to the structural changes would be necessary, possibly using a leverage analysis in case of a least-squares structural refinement of the light-induced model (Parson et al., 2012; Prince, 2004). Improvements to the setup are foreseen for the near future. A more powerful and stable pump laser system is currently being implemented in order to reach higher photoconversion per pulse, and therefore higher photoinduced Bragg intensity change. A new generation of XPAD with a 10 measurement windows firmware instead of only 4 is commissioned, with a faster electronic allowing sampling period of 4 ms as well as a 1 mm thick silicon sensor in order to improve the X-ray photon absorption efficiency. With these progresses, we anticipate a shortening of the measurement time per frame for appropriate statistics, so that a complete data collection of a photo-induced state for structural analysis would be possible.
Although many current time-resolved structural studies focus on ultrafast phenomena, there are plenty of much slower solid state processes developing in the microsecond to second time scale. The investigation of the structural response of crystals to external perturbation (electric field, or pulsed laser) in this time range is fundamental for understanding many physical properties of current interest,
23 such as the switching dynamics of domain patterns in ferroelectric or ferroelastic materials, the nucleation and growth processes at phase transitions, the development of long range modulated structures, the propagation of lattice distortion and strain just to name a few. Our instrument is appropriate for such time-resolved structural studies, and may be used for a wide range of scientific applications.
Table 1 Selected characteristics of the time-resolved X-ray diffraction experiment, and hybrid pixel XPAD detector
Diffractometer
Wavelength (Å) 0.71073 Photon flux (ph.s-1.cm-2) 2.109
Beam size at sample position (µm) 100 XPAD detector Read-out time (ms) 1.7 Stacking time (ms) 3.7 Pixel size (µm) 130×130 Counting rate (ph/pixel/s) 250 000 Counting gate (ns) 150 Maximum frame rate
(Hz)
500
Pump laser system
Repetition rate (Hz) 10 Wavelength (nm) 400-700 Photon flux at sample
position (ph/cm2 per
pulse)
9.1018 at 450 nm
24
Acknowledgements We are grateful to Claude Lecomte for discussions, Theo Woike and Mirco Imlau for tremendous help in the design of the transient optical spectroscopy and pump laser systems. This work was supported by the CNRS, the Université de Lorraine, the French ‘Agence Nationale de la Recherche’ (grant Bistamat ANR-12-BS07-0030-02), and “Lorraine Université d’Excellence”.
References
Agilent (2014). CrysAlis PRO. Agilent Technologies Ltd, Yarnton, Oxfordshire, England. Alle, P., Wenger, E., Dahaoui, S., Schaniel, D. & Lecomte, C. (2016), Phys. Scr. 91, 063001. Beaud, P., Johnson, S. L., Streun, A., Abela, R., Abramsohn, D., Grolimund, D., Krasniqi, F., Schmidt, T., Schlott, V. & Ingold, G. (2007) Phys. Rev. Lett. 99, 174801.
Bertoni, R., Lorenc, M., Tissot, A., Boillot, M.-L. & Collet, E. (2015) Coord. Chem. Rev. 282-283, 66-76.
Cammarata, M., Eybert, L., Ewald, F., Reichenbach, W., Wulff, M., Anfinrud, P., Schotte, F., Plech, A., Kong, Q., Lorenc, M., Lindenau, B., Rabiger, J. & Polachowski, S. (2009) Rev. Sci. Instr. 80, 015101
Carducci, M. D., Pressprich, M. R. & Coppens, P. (1997). J. Am. Chem. Soc. 119, 2669 – 2678. Chen, L. X. (2004) Angew. Chem. Int. Ed. 43, 2886-2905.
Chergui, M., Zreis, D. A.; Fritz, D. M.; Bucksbaum, P. H.; Dufresne, E. M & Clarke, R. (2005) J.
Synchrotron Rad. 12, 177-192.
Chollet, M., Alonso-Mori, R., Cammarata, M., Damiani, D., Defever, J., Delor, J. T., Feng, Y., Glownia, J. M., Langton, J. B., Nelson, S., Ramsey, K., Robert, A., Sikorski, M., Song, S.,
Stefanescu, D., Srinivasan, V., Zhu, D., Lemke, H. T. & Fritz, D. M. (2015) J. Synchrotron Rad. 22, 503-507.
Collet, E., Moisan, N., Baldé, C., Bertoni, R., Trzop, E., Laulhé, C., Lorenc, M., Servol, M., Cailleau, H., Tissot, A., Boillot, M.-L., Graber, T., Henning, R., Coppens, P. & Buron-le Cointe M. (2012) Phys.
Chem. Chem. Phys. 14, 6192-6199.
Dinapoli, R.; Bergamaschi, A.; Henrich, B.; Horisberger, R.; Johnson, I.; Mozzanica, A.; Schmid, E.; Schmitt, B.; Schreiber, A.; Shi, X. & Theidel, G. (2011) Nucl. Instrum. Methods Phys. Res. A 650, 79-83.
Dwayne Miller, R. J. (2014) Science, 343, 1108-1116.
Ejdrup, T., Lemke, H. T., Haldrup, K., Nielsen, T. N., Arms, D. A., Walko, D. A., Miceli, A., Landahl, E. C., Dufresne, E. M. & Nielsen. M. M. (2009) J. Synchrotron Rad. 16, 387-390. Elsaesser, T. & Woerner, M. (2014) J. Chem. Phys. 140, 020901.
25 Fertey, P., Alle, P., Wenger, E., Dinkespiler, B., Cambon, O., Haines, J., Hustache, S., Medjoubi, K., Picca, F., Dawiec, A., Breugnon, P., Delpierre, P., Mazzoli, C. & Lecomte, C. (2013). J. Appl. Cryst. 46, 1151-1161.
Fomitchev, D. V. & Coppens, P. (1996). Inorg. Chem. 35, 7021 – 7026.
Gallé, G., Nicoul, M., Woike, T., Schaniel, D. & Freysz, E. (2012). Chem. Phys. Lett. 552, 64 – 68. Gembicky, M., Oss, D., Fuchs, R. & Coppens, P. (2005) J. Synchrotron Rad. 12, 665-669.
Grigoriev, A., Do, D. H., Kim, D. M., Eom, C. B., Adams, B., Dufresne, E. M. & Evans. P. G. (2006)
Phys. Rev. Lett. 96, 187601.
Henrich, B.; Bergamaschi, A.; Broennimann, C.; Dinapoli, R.; Eikenberry, E. F.; Johnson, I.; Kobas, M.; Kraft, P.; Mozzanica, A. & Schmitt, B. (2009) Nucl. Instrum. Methods Phys. Res. A 607, 247-249. Ichiyanagi, K., Sato, T., Nozawa, S., Kim, K. H., Lee, J. H., Choi, J., Tomita, A., Ichikawa, H., Adachi, S., Ihee, H. & Koshihara, S. (2009) J. Synchrotron Rad. 16, 391-394.
Issenmann, D., Schleef, S., Ibrahimkutty, S., Buth, G., Baumbach, T., Plech, A., Beyer, M. & Demsar. J. (2012) Acta Phys. Pol. A, 121, 319-323.
Jacques, V. L. R., Laulhé, C., Moisan, N., Ravy, S. & Le Bolloc’h, D. (2016), Phys. Rev. Lett. 117, 156401.
Johnson, I.; Bergamaschi, A.; Buitenhuis, J.; Dinapoli, R.; Greiffenberg, D.; Henrich, B.; Ikonen, T.; Meier, G.; Menzel, A.; Mozzanica, A.; Radicci, V.; Satapathy, D. K.; Schmitt, B. & Shi, X. (2012) J.
Synchrotron Rad. 19, 1001-1005.
Kaminski, R.; Nottingham, G. & Coppens, P. (2014) J. Appl. Cryst. 47, 1765-1768. Kim, J. G.; Kim, T. W.; Kim, J. & Ihee. H. (2015) Acc. Chem. Res. 48, 2200-2208.
Laulhé, C., Ravy, S., Fertey, P., Elkaim, E., Legrand, F., Féret, P., Hollander, Ph., Hustache, S., Bordessoule, M., Ricaud, J.-P., Collet, E., Lorenc, M., Buron-Le-Cointe, M., Cailleau, H., Tissot, A. & Boillot, M.-L. (2012), Acta Phys. Pol. A 121, 332-335.
Laulhé, C., Cario, L., Corraze, B., Janod, E., Huber, T., Lantz, G., Boulfaat, S., Ferrer, A., Mariager, S. O., Johnson, J. A., Grübel, S., Lübcke, A., Ingold, G., Beaud, P., Johnson, S. L., & Ravy, S. (2015)
Physica B 460, 100-104.
Lindenberg, A. M., Kang, I., Johnson, S. L., Missalla, T., Heimann, P. A., Chang, Z., Larsson, J., Bucksbaum, P. H., Kapteyn, H. C., Padmore, H. A., Lee, R. W., Wark, J. S., & Falcone R. W. (2000)
Phys. Rev. Lett. 84, 111-114.
Lorenc, M., Hébert, J., Moisan, N., Trzop, E., Servol, M., Buron-le-Cointe, M., Cailleau, H., Boillot, M.-L., Pontecorvo, E., Wullf, M., Koshihara S. & Collet E. (2009) Phys. Rev. Lett. 103, 028301. Lorenc, M., Balde, C., Kaszub, W., Tissot, A., Moisan, N., Servol, M., Buron-Le-Cointe, M., Cailleau, H., Chasle, P., Czarnecki, P., Boillot, M.-L. & Collet E. (2012) Phys. Rev. B85, 054302.
Medjoubi, K., Bucaille, T., Hustache, S., Bérar, J.-F., Boudet, N., Clemens, J.-C., Delpierre, P. & Delpierre, B. (2010), J. Synchrotron Rad. 17, 486-495.
26 Nozawa, S., Adachi, S.-I., Takahashi, J.-I., Tazaki, R., Guérin, L., Daimon, M., Tomita, A., Sato, T., Chollet, M., Collet, E., Cailleau, H., Yamamoto, S., Tsuchiya, K., Shioya, T., Sasaki, H., Mori, T., Ichiyanagi, K., Sawa, H., Kawata, H. & Koshihara, S.-Y. (2007) J. Synchrotron Rad. 14, 313-319. Pangaud, P., Basolo, S., Boudet, N., Berar, J-F., Chantepie, B., Delpierre, P., Dinkespiler, B., Hustache, S., Menouni, M. & Morel, C. (2007), Nucl. Instrum. Methods Phys. Res. A 571, 321-324. Parson, S.; Wagner, T.; Presly, O.; Wood, P. A. & Cooper, R. I. (2012) J. Appl. Cryst. 45, 417-429. Patterson, B. D. (2014) Cryst. Rev. 20, 242-294.
Prince, E. (2004). Mathematical Techniques in Crystallography and Materials Science, 2nd ed. Berlin: Springer.
Schaniel, D., Schefer, J., Delley, B., Imlau, M. & Woike, Th. (2002) Phys. Rev. B 66, 085103 Schaniel, D., Woike, T., Schefer J. & Petříček V. (2005a). Phys. Rev. B 71, 174112.
Schaniel, D., Woike, T., Merschjann, C. & Imlau, M. (2005b). Phys. Rev. B 72, 195119.
Schaniel, D., Woike, T., Schefer, J., Petříček, V., Krämer, K. W. & Güdel, H. U. (2006). Phys. Rev. B 73, 174108.
Schaniel, D. & Woike, T. (2009). Phys. Chem. Chem. Phys. 11, 4391 – 4395.
Schaniel, D., Nicoul, M. & Woike, T. (2010). Phys. Chem. Chem. Phys. 12, 9029 – 9033. Sheldrick, G. M. (2008). Acta Cryst. A64, 112–122.
Sokolowski-Tinten, K. & von der Linde D. (2004) J. Phys.: Condens. Matter., 16, R1517-R1536. Wenger, E. (2015), PhD Thesis Université de Lorraine.
Wenger, E., Dahaoui, S., Alle, P., Parois, P., Palin, C., Lecomte, C. & Schaniel, D. (2014), Acta
Cryst. B70, 783-791
White, M. A., Pressprich, M. R. & Coppens, P. (1994) J. Appl. Cryst. 27, 727-732.
Woike, Th., Krasser, W., Zöllner, H., Kirchner, W. & Haussühl, S. (1993) Z. Phys. D 25, 351-356. Wulff, M., Plech, A., Eybert, L., Randler, R., Schotte, F. & Anfinrud, P. (2002) Faraday Discuss. 122, 13-26.
Zamponi, F., Ansari, Z., Korff Schmising, C. v.,Rothhardt, P., Zhavoronkov, N., Woerner, M., Elsaesser, T., Bargheer, M., Trobitzsch-Ryll, T. & Haschke, M. (2009) Appl. Phys. A 96, 51-58.
27
Supplementary material of
“In-house time-resolved photocrystallography on the millisecond
timescale using a gated X-ray hybrid pixel area detector”
Nicolas Casaretto, Dominik Schaniel, Paul Alle, Emmanuel Wenger, Pascal Parois, Bertrand Fournier, El-Eulmi Bendeif, Cyril Palin and Sébastien Pillet
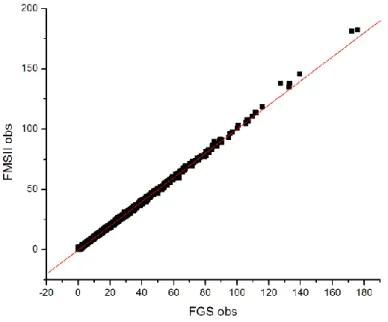
Figure S1. Measured structure factor moduli |𝐹𝑀𝑆𝐼𝐼(𝐻⃗⃗ )| as a function of |𝐹𝐺𝑆(𝐻⃗⃗ )|. Red line : linear fit to the experimental data with refined slope of 1.0017(8).
Dependence of the diffracted intensity as a function of time delay
The scattering factor for a crystal containing a fraction 𝑝 of molecules in the metastable state, and 1 − 𝑝 molecules in the ground state with a random spatial distribution can be written : 𝐹(𝐻⃗⃗ ) = 𝑝 × 𝐹𝑀𝑆𝐼𝐼(𝐻⃗⃗ ) + (1 − 𝑝) × 𝐹𝐺𝑆(𝐻⃗⃗ )
So that the scattered intensity is simply:
𝐼(𝐻⃗⃗ ) = (𝑝 × 𝐹𝑀𝑆𝐼𝐼(𝐻⃗⃗ ) + (1 − 𝑝) × 𝐹𝐺𝑆(𝐻⃗⃗ )) × (𝑝 × 𝐹𝑀𝑆𝐼𝐼∗ (𝐻⃗⃗ ) + (1 − 𝑝) × 𝐹𝐺𝑆∗ (𝐻⃗⃗ ))
In a time resolved experiment, the metastable state population is time dependent so that the intensity becomes:
𝐼(𝐻⃗⃗ , 𝑡) = [𝑝(𝑡) × 𝐹𝑀𝑆𝐼𝐼(𝐻⃗⃗ ) + (1 − 𝑝(𝑡)) × 𝐹𝐺𝑆(𝐻⃗⃗ )] × [𝑝(𝑡) × 𝐹𝑀𝑆𝐼𝐼∗ (𝐻⃗⃗ ) + (1 − 𝑝(𝑡)) × 𝐹 𝐺𝑆∗ (𝐻⃗⃗ )]
For an exponential relaxation with lifetime 𝜏 of the metastable state and initial population 𝑝0 :
𝑝(𝑡) = 𝑝0𝑒𝑥𝑝−𝑡𝜏.
28 𝐼(𝐻⃗⃗ , 𝑡) = (𝑝0𝑒𝑥𝑝−𝑡𝜏 × 𝐹𝑀𝑆𝐼𝐼+ (1 − 𝑝0𝑒𝑥𝑝 −𝑡 𝜏) × 𝐹𝐺𝑆) 2 𝐼(𝐻⃗⃗ , 𝑡) = 𝑝02𝑒𝑥𝑝−2𝑡𝜏 × 𝐹2𝑀𝑆𝐼𝐼+ (1 − 𝑝0𝑒𝑥𝑝 −𝑡 𝜏) 2 × 𝐹2𝐺𝑆+ 2𝑝0𝑒𝑥𝑝−𝑡𝜏 × (1 − 𝑝0𝑒𝑥𝑝 −𝑡 𝜏) × 𝐹𝑀𝑆𝐼𝐼𝐹𝐺𝑆 𝐼(𝐻⃗⃗ , 𝑡) = 𝐹2 𝐺𝑆+ 2𝐹𝐺𝑆(𝐹𝑀𝑆𝐼𝐼− 𝐹𝐺𝑆) × 𝑝0𝑒𝑥𝑝 −𝑡 𝜏 + (𝐹𝑀𝑆𝐼𝐼− 𝐹𝐺𝑆)2× 𝑝 0 2 𝑒𝑥𝑝−2𝑡𝜏
The structural difference between GS and MSII is limited so that the difference between 𝐹𝑀𝑆𝐼𝐼(𝐻⃗⃗ ) and 𝐹𝐺𝑆(𝐻⃗⃗ ) is also quite small. In the previous equation the second term on the right hand side is dominant with respect to the last term for small initial population 𝑝0, so that in a first approximation, the time resolved Bragg intensity follows a single exponential dependence with time constant 𝜏.
The following figure illustrates the simulated normalized intensity of the (240) reflection as a function of time with different values of the initial population 𝑝0. As can be seen, all the curves follow in a first approximation a single exponential decay with time constant𝜏 very close to 14 ms.
Figure S2. Simulated normalized intensity of the (240) reflection as a function of time with different values of the initial population 𝑝0. All the curves have been adequately fitted to a single exponential decay.