Comparison of sleep-wake classification using
electroencephalogram and wrist-worn multi-modal sensor data
The MIT Faculty has made this article openly available.
Please share
how this access benefits you. Your story matters.
Citation
Sano, Akane, and Rosalind W. Picard. “Comparison of Sleep-Wake
Classification Using Electroencephalogram and Wrist-Worn
Multi-Modal Sensor Data.” 36th Annual International Conference of the
IEEE Engineering in Medicine and Biology Society, 26-30 August
2014, Chicago, Illinois, USA, IEEE, 2014.
As Published
http://dx.doi.org/10.1109/EMBC.2014.6943744
Publisher
Institute of Electrical and Electronics Engineers (IEEE)
Version
Author's final manuscript
Citable link
http://hdl.handle.net/1721.1/110667
Terms of Use
Creative Commons Attribution-Noncommercial-Share Alike
Abstract— This paper presents the comparison of sleep-wake
classification using electroencephalogram (EEG) and multi-modal data from a wrist wearable sensor. We collected physiological data while participants were in bed: EEG, skin conductance (SC), skin temperature (ST), and acceleration (ACC) data, from 15 college students, computed the features and compared the intra-/inter-subject classification results. As results, EEG features showed 83% while features from a wrist wearable sensor showed 74% and the combination of ACC and ST played more important roles in sleep/wake classification.
I. INTRODUCTION
Sleep/wake identification has been used both in clinical fields and personal health/wellness fields. Clinically, polysomnography (PSG) has been used to monitor sleep and identify sleep disorders in sleep labs as a gold standard; however, it has disadvantages requiring the patient to stay one or more nights in the lab wearing uncomfortable sensors and wires. Actigraphy has been used to monitor long-term sleep wake cycles [1]. Cole et al. showed that sleep and wake are classified with an accuracy of 88% using wrist-worn actigraphy and regression analysis comparing the wrist data to PSG [2]. Some other researchers have applied machine learning or new algorithms to improve the accuracy [3][4][5] or used other data (heart rate variability from electrocardiogram (ECG)) [6][7]. Recently, many wearable devices have been on the market and most of them have multiple sensors (accelerometer, photoplethysmogram, etc). Due to advances in device technology, more wearable devices will come to the market with multi-modal sensors.
In this paper, we compared the sleep/wake classification using physiological data taken while participants were in bed, using polysomnography (PSG) as a gold standard and skin conductance (SC), skin temperature (ST) and acceleration (ACC) data from a wristband sensor. We investigated which features from which modality play the most important roles in the sleep/wake classification.
II. METHODS
A. Data Collection
Fifteen college students participated in sleep measurement in a hospital sleep laboratory. They wore electrodes for
Research supported by MIT Media Lab Consortium.
A. Sano is a Ph. D. candidate and research assistant at Massachusetts Institute of Technology, Cambridge, MA, 02139 USA (e-mail: [email protected]).
R. W. Picard is a professor at Massachusetts Institute of Technology, Cambridge, MA, 02139, USA (e-mail: [email protected]).
electrooculogram (EOG), for EEG on C3 and C4 (International 10-20 system), and for electromyogram (EMG) on their chin and a wrist sensor (Q Sensor by Affectiva) to measure SC, ST, and ACC on their dominant hand. The EEG, ECG and EMG were sampled at 200 Hz and the wristband data were sampled at 8 Hz. Sleep stages were scored for each 30-s epoch sleep data based on standard PSG criteria measuring EEG, EOG and EMG [8]. Figure 1 shows a sample representation of one night’s data from one participant. The experimental procedure was pre-approved by the Committee on the Use of Humans as Experimental Subjects at the Massachusetts Institute of Technology.
B. Feature Extraction
We computed the following features for building machine learning classifiers.
a) Electroencephalogram (EEG) (16 features were computed per epoch)
We calculated the z-score of the power spectrum density for the frequency bands (delta (0.5-4 Hz), theta (4-8 Hz), alpha (8-12 Hz) and beta (12-30 Hz) over the night for averaged EEG at electrode locations C3 and C4. We then computed the average, standard deviation, maximum and minimum of the z-scored power spectrum density of averaged EEG at electrodes C3 and C4 per epoch.
b) Skin Conductance (SC) (7 features per epoch) First, for de-noising, we low-pass filtered the SC data (cutoff frequency 0.4 Hz, 32nd order FIR filter) before computing the features. We normalized the amplitude of the SC in a range between minimum and maximum amplitude over the night, then obtained the first derivative of the filtered SC. We detected SC “peaks” based on those that exceeded 0.004/s threshold and counted the number of peaks per each 30-second epoch. Our previous study has shown that SC peaks are much more likely to occur during SWS or Non-REM (rapid eye movement) sleep [9]. We also computed the mean, standard deviation, median, maximum and minimum of the normalized SC amplitude (normalized by the maximum and the minimum SC amplitude over the night) and gradient from linear least square fitting for each 30-s epoch. For SC peaks, we computed the total number for each 30-s epoch and the standard deviation of the number of SC peaks per 30 s epoch over the night.
c) Acceleration data (ACC) (7 features for an epoch) We applied a 2-3 Hz band pass filter to the accelerometer data and then counted the number of times of the three axis
Comparison of Sleep-Wake Classification using
Electroencephalogram and Wrist-worn Multi-modal Sensor Data
amplitude root mean square (RMS) values crossed 0.01 (the number of zero-crossings) for each 30-s epoch. We then applied Cole’s “D” function to score “wake” or “sleep” for each 30-s epoch [2]. We also computed the mean, standard deviation, maximum and minimum of the root mean square of three axis acceleration data for each 30-s epoch.
d) Skin Temperature (ST) (5 features for an epoch) We normalized the temperature data using the maximum and minimum values over the night and computed the average, standard deviation, maximum, minimum and gradient from linear least square fitting for each 30-s epoch.
B. Classification
We grouped SWS, non-REM2, non-REM1 and REM into sleep. As we have more sleep epochs than wake epochs given all the data was from lying in bed, we extracted sleep epochs randomly to equalize the number of sleep and wake samples. We defined the following 4 methods (A-D), 2 datasets (1-2) and 15 feature combinations (a-o) for systematic evaluation.
• Classifiers
A) Support vector machine with linear kernel B) Support vector machine with Gaussian kernel C) K-nearest neighbor (kNN, k=1-4)
D) Feature selection (exhaustive feature selection by maximizing the J3 measure associated with the scatter matrices to find the best 2-6 features for EEG or data from the wrist sensor) and support vector machine with linear kernel
E) Feature selection (exhaustive) and support vector machine with Gaussian kernel
F) Feature selection (exhaustive) and kNN (k=1-4) • Data-sets
1) Intra-subject classification
Within each participant, we identified 11-98 epochs from each of wake and sleep. We trained the models using 90% of the data, tested with the remaining 10% of the data and repeated this procedure 10 times, each time leaving out a different 10% of the data (10-fold cross validation).
2) Inter-subject classification
We divided the data (total # of epochs = 661) into 10 sets, performed training with the one set from all except one subject data, tested with one set of the remaining one subject data and repeated this procedure 10 times.
• Feature sets
a)EEG, b)EEG+ACC, c)EEG+SC, d)EEG+ST, e) EEG+ACC+ST, f) EEG+SC+ACC, g)EEG+SC+ST, h)EEG+ACC+SC+ST, i)SC, j)ACC, k)ST, l)ACC+SC, m)SC+ST, n)ACC+ST, o)ACC+SC+ST
We compared the classification results for the following combinations.
1) Intra-subject + Feature sets a - o + Classifiers A - C 2) Inter-subject + Feature sets a - o + Classifiers A - C 3) Inter-subject + Feature sets a - o + Classifiers D - F
Fig.1 Raw skin conductance, 3-axis accelerometer data, skin temperature, manually scored sleep stages from PSG(red marks mean wakefulness), and EEG spectrogram (channels C3 and C4) for one night for a healthy college student
III. RESULTS
A. Intra-subject classification
Figure 2 shows the classification comparison for intra-subject data-sets. EEG showed 91% and EEG + other features boosted the accuracy to 95% (EEG+SC+ACC) and 96% (EEG+ACC+SC+ST). The features from only the wristband sensor showed 86% (ACC+SC+ST) and 84% (SC+ST, ACC+ST). Of the single wristband features, ST was the best 79%) followed by SC (75%), with ACC the lowest (67%).
Fig.2 Accuracy of intra-subject classification.
B. Inter-subject classification
Figure 3 shows the classification comparison for inter-subject data sets. All of the features EEG+ACC+SC+ST and EEG+SC+ACC showed the best classification rates (85%). Of the wrist features, ACC+SC+ST and ACC+ST showed 74%. Of the single wristband features, ACC was the best (68%), followed by ST (67%) with SC the lowest (51%). Figure 4 shows the Receiver Operating Characteristic (ROC) curves of EEG features vs wrist features. Of the wrist features, ST was dominant.
Fig.3 Accuracy of inter-subject classification
0 0.1 0.2 0.3 0.4 0.5 0.6 0.7 0.8 0.9 1 0 0.1 0.2 0.3 0.4 0.5 0.6 0.7 0.8 0.9 1 EEG EEG+SC+ACC EEG+ACC+SC+ST SC ACC ST ACC+ST ACC+SC+ST
False Positive Rate
Tr u e P o s it iv e Ra te
Fig.4 ROC curves for sleep-wake classification with EEG+ACC+SC+ST, EEG+SC+ACC, ACC+SC+ST and ACC+ST
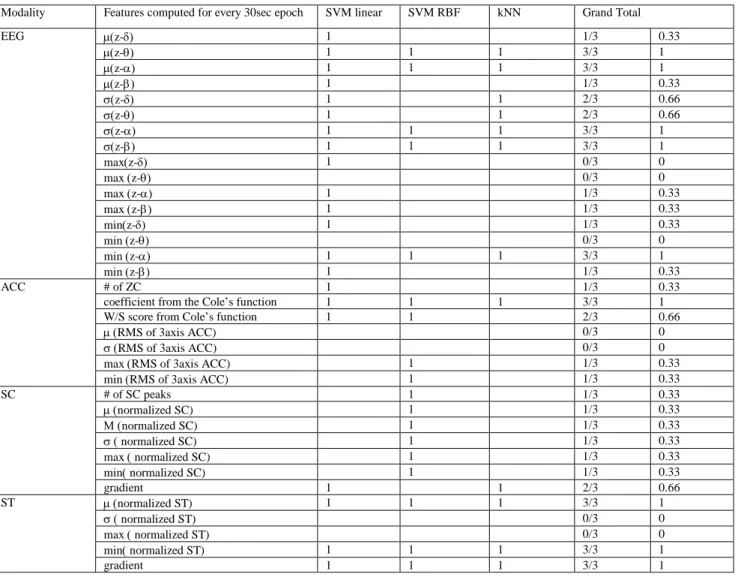
C. Inter-subject classification with selected features
We applied exhaustive search over sets of sizes 2-6 features for each modality and compared the classification rate. Table 1 shows the best feature subsets for each modality for each classifier with the highest classification rates. Some of the features were chosen multiple times by different classifiers. The best EEG features and the best wrist features showed 83% and 73% respectively.
IV. DISCUSSION
In all of the classifications, as expected since EEG is part of the sleep/wake ground truth in PSG, the EEG features showed the best accuracy - over 85%. The ACC features performed much lower, only 67-68%, which is lower than Cole reported. This may be because we did not apply Cole’s rescoring methods and we used a different source of ACC data or it may be that there is significant person-dependence in ACC’s prediction of sleep/wake. SC was very person-dependent, performing 75% when it had some training data from the subject it was testing on, but only 51% when trained and tested on different people. Some SC features related to sleep that have been reported as robust such as decrease in palm skin potential level after sleep onset [10] were not included in our data. Also, SC storms in non-REM sleep [9] are not represented in but 51% of the randomly selected sleep data in our tests, while SC tends to be active in wake before and after sleep; thus, we are not surprised that use of SC in only a 30-sec epoch is not a strong indicator of sleep vs. wake for that epochs. Skin temperature showed an important role in epoch sleep/wake classification. Kräuchi et al. indicated distal skin temperature increase at sleep onset and dramatic decrease at wake up [11]. Although we maintained the balance between the number of wake epochs and sleep epochs for training and testing data, the quality of the dataset could improve if we collected more of the day’s data over wake epochs, and used this larger set of data.
V. CONCLUSION
We compared sleep-wake classification accuracy with EEG from the scalp, and ACC, SC and ST from a wrist sensor, taken while participants were in bed. We applied three types of machine learning, paired with feature selection methods, in order to identify features that best discriminated sleep and
wake.
Acknowledgment
The authors thank sleep experts Dr. Robert Stickgold and Ms. Hilary Wang for their help collecting and sharing the data, as well as scoring the sleep/wake from the PSG.
REFERENCES
[1] T. Blackwell, S. Ancoli-Israel, S. Redline, and K. L. Stone, “Factors that may influence the classification of sleep-wake by wrist actigraphy: the MrOS Sleep Study.,” J. Clin. Sleep Med., vol. 7, no. 4, pp. 357–67, Aug. 2011.
[2] R. J. Cole, D. F. Kripke, W. Gruen, D. J. Mullaney, and J. C. Gillin, “Automatic sleep/wake identification from wrist activity.,” Sleep, vol. 15, no. 5, pp. 461–9, Oct. 1992.
[3] A. Sadeh, K. M. Sharkey, and M. A. Carskadon, “Activity-based sleep-wake identification: an empirical test of methodological issues.,” Sleep, vol. 17, no. 3, pp. 201–7, Apr. 1994.
[4] J. Tilmanne, J. Urbain, M. V Kothare, A. Vande Wouwer, and S. V Kothare, “Algorithms for sleep-wake identification using actigraphy: a comparative study and new results.,” J. Sleep Res., vol. 18, no. 1, pp. 85–98, Mar. 2009.
[5] C. P. Pollak, W. W. Tryon, H. Nagaraja, and R. Dzwonczyk, “How accurately does wrist actigraphy identify the states of sleep and wakefulness?,” Sleep, vol. 24, no. 8, pp. 957–65, Dec. 2001.
[6] S. Elsenbruch, M. J. Harnish, and W. C. Orr, “Heart rate variability during waking and sleep in healthy males and females.,” Sleep, vol. 22, no. 8, pp. 1067–71, Dec. 1999.
[7] A. Lewicke, E. Sazonov, M. J. Corwin, M. Neuman, and S. Schuckers, “Sleep versus wake classification from heart rate variability using computational intelligence: consideration of rejection in classification models.,” IEEE Trans. Biomed. Eng., vol. 55, no. 1, pp. 108–18, Jan. 2008.
[8] A. K. A. Rechtschaffen, A Manual of standardized terminology,
techniques, and scoring system for sleep stages of human subjects.
1968.
[9] A. Sano and R. W. Picard, “Toward a taxonomy of autonomic sleep patterns with electrodermal activity.,” Conf. Proc. IEEE Eng. Med.
Biol. Soc., vol. 2011, pp. 777–80, Jan. 2011.
[10] T. Hori, “Electrodermal and electro-oculographic activity in a hypnagogic state.,” Psychophysiology, vol. 19, no. 6, pp. 668–72, Nov. 1982.
[11] K. Kräuchi, C. Cajochen, and A. Wirz-Justice, “Waking up properly: is there a role of thermoregulation in sleep inertia?,” J. Sleep Res., vol. 13, no. 2, pp. 121–7, Jun. 2004.
TABLE 1 Summary of the best features (Features with higher grand total are more robust regardless of classifiers). Modality Features computed for every 30sec epoch SVM linear SVM RBF kNN Grand Total
EEG µ(z-δ) 1 1/3 0.33 µ(z-θ) 1 1 1 3/3 1 µ(z-α) 1 1 1 3/3 1 µ(z-β) 1 1/3 0.33 σ(z-δ) 1 1 2/3 0.66 σ(z-θ) 1 1 2/3 0.66 σ(z-α) 1 1 1 3/3 1 σ(z-β) 1 1 1 3/3 1 max(z-δ) 1 0/3 0 max (z-θ) 0/3 0 max (z-α) 1 1/3 0.33 max (z-β) 1 1/3 0.33 min(z-δ) 1 1/3 0.33 min (z-θ) 0/3 0 min (z-α) 1 1 1 3/3 1 min (z-β) 1 1/3 0.33 ACC # of ZC 1 1/3 0.33
coefficient from the Cole’s function 1 1 1 3/3 1 W/S score from Cole’s function 1 1 2/3 0.66
µ (RMS of 3axis ACC) 0/3 0
σ (RMS of 3axis ACC) 0/3 0
max (RMS of 3axis ACC) 1 1/3 0.33 min (RMS of 3axis ACC) 1 1/3 0.33
SC # of SC peaks 1 1/3 0.33 µ (normalized SC) 1 1/3 0.33 Μ (normalized SC) 1 1/3 0.33 σ ( normalized SC) 1 1/3 0.33 max ( normalized SC) 1 1/3 0.33 min( normalized SC) 1 1/3 0.33 gradient 1 1 2/3 0.66 ST µ (normalized ST) 1 1 1 3/3 1 σ ( normalized ST) 0/3 0 max ( normalized ST) 0/3 0 min( normalized ST) 1 1 1 3/3 1 gradient 1 1 1 3/3 1