HAL Id: hal-00756069
https://hal.archives-ouvertes.fr/hal-00756069
Submitted on 22 Nov 2012
HAL is a multi-disciplinary open access
archive for the deposit and dissemination of
sci-entific research documents, whether they are
pub-lished or not. The documents may come from
teaching and research institutions in France or
abroad, or from public or private research centers.
L’archive ouverte pluridisciplinaire HAL, est
destinée au dépôt et à la diffusion de documents
scientifiques de niveau recherche, publiés ou non,
émanant des établissements d’enseignement et de
recherche français ou étrangers, des laboratoires
publics ou privés.
Absolute measurement of small-amplitude vibrations by
time-averaged heterodyne holography with a dual local
oscillator
Nicolas Verrier, Michael Atlan
To cite this version:
Nicolas Verrier, Michael Atlan. Absolute measurement of small-amplitude vibrations by time-averaged
heterodyne holography with a dual local oscillator. Optics Letters, Optical Society of America - OSA
Publishing, 2013, 38 (5), pp.739. �hal-00756069�
Absolute measurement of small-amplitude vibrations by time-averaged heterodyne
holography with a dual local oscillator
Nicolas Verrier1 and Michael Atlan1
1 Institut Langevin. Fondation Pierre-Gilles de Gennes. Centre National de la Recherche Scientifique (CNRS) UMR 7587,
Institut National de la Sant´e et de la Recherche M´edicale (INSERM) U 979, Universit´e Pierre et Marie Curie (UPMC), Universit´e Paris 7. ´Ecole Sup´erieure de Physique et de Chimie Industrielles - 10 rue Vauquelin. 75005 Paris. France
(Dated: November 22, 2012)
We report a demonstration of the measurement of the ratio between an optical modulation side band component and the non-shifted light component by time-averaged heterodyne holography in off-axis and frequency-shifting configuration, through coherent frequency-division multiplexing with a dual optical local oscillator. Experimental results of sinusoidal vibration sensing are reported. This technique enables absolute measurements of sub-nanometric out-of-plane vibration amplitudes.
Laser Doppler interferometric methods are commonly used for non-contact measurements of mechanical vibrations. These methods exhibit high reliability and enable wideband, phase-resolved, single point vibration measurements [1]. However, imaging re-quires time-consuming scanning of the tested sample. Homodyne [2–4] and heterodyne [5–7] holographic recordings in off-axis configuration enabled reliable full-field measurements of out-of-plane mechanical vibrations. Nevertheless, quantitative measurements of vibration amplitudes much smaller than the optical wavelength with an array detector remains difficult to achieve. A comprehensive study of the signal-to-noise ratio (SNR) was proposed for classical heterodyne holography [6]. The authors managed to observe vibration amplitudes of a few Angtroms, and linked the smallest detectable amplitude to the SNR, in the absence of spurious effects. Later on, nanometric vibration amplitude measurements were achieved with digital holography, by sequential measures of the first optical side band and the non-shifted light component[8].
In this letter, we report an experimental demonstra-tion of heterodyne holography for vibrademonstra-tion sensing. The presented idea is to make use of a dual optical local oscillator (LO) illumination to assess low-amplitude modulations. Optical heterodyning is a frequency-conversion process used to shift the radiofrequency (RF) content of an optical radiation field E in a sensor bandwidth by mixing it with a LO field ELO whose
optical frequency is detuned by the RF of interest. The RF spectrum of an optical beam undergoing sinusoidal modulation exhibits modulation side bands. By combining two LO, both the fundamental and the first-order harmonic optical side bands can be recorded simultaneously. This approach has its roots in frequency-division multiplexing [9], a technique by which the total bandwidth available is divided into non-overlapping frequency sub-bands, each of which is used to carry a separate signal. The proposed method is shown to be suitable for the detection of the complex
DPSS laser
beam
splitter beam (LO)reference
E ELO object beam piezo-electric actuator sensor array vibrating surface beam splitter ò0 acousto-optic modulators ! !S illumination beam mirror mirror !L RF combiner !C !C+!S=4 !C+! à !S=4 õ = 532 nm
FIG. 1: Sketch of the acquisition setup.
ratio of modulated light side bands.
The acquisition set-up, sketched in fig. 1 and described in [10], consists of an off-axis, frequency-shifting Mach-Zehnder interferometer designed for heterodyne detec-tion of optical moduladetec-tion side bands. The sensor array used for detection is an EMCCD camera, (Andor IXON 885+, readout rate ωS/(2π) = 20 Hz). The main optical
radiation field is provided by a doubled Nd:YAG laser (Oxxius SLIM 532, power 100 mW, wavelength λ = 532 nm, optical pulsation ωL). As a result of optical
path-length modulation of the laser beam impinging on the vibrating surface of a piezo-electric actuator (PZT, Thor-labs AE0505D08F), the temporal part of the object field E undergoes a sinusoidal phase modulation of the form φ(t) = φ0sin(ωt), where ω/(2π) = 10 kHz is the
excita-tion frequency. It can be decomposed on a basis of Bessel functions of the first kind Jn(φ0), via the Jacobi-Anger
identity E = ∞ X n=−∞ En = ∞ X n=−∞ Enei(ωL+nω)t (1)
The phase modulation of the object field E at angular frequency ω results in the apparition of optical side bands of complex amplitude En at harmonics of ω; for small
2 modulation depths, the magnitude of the side bands of
order ±1 is much greater than the magnitude of the side bands of higher order, as reported in figure 2(a). The quantity
En= EJn(φ0) (2)
is the complex weight of the optical side band of order n, where E is the complex amplitude of the optical field, and φ0= 4πz/λ is the modulation depth of the optical phase.
For small vibrations (z ≪ λ), a relative measure of z can be assessed from the first-order side band hologram z ∝ |E1| [10]. Furthermore, the local amplitude z of the
out-of-plane motion at angular frequency ω is approximately
z ≈ λ 2π
J1(φ0)
J0(φ0)
. (3)
Hence, a quantitative measure of z can be achieved by forming the ratio between the the magnitude of the weights of the first-order side band hologram ∝ E1 and
the non-shifted light component hologram ∝ E0, each
of them being measured sequentially [11]. However, in experimental conditions, a noise floor prevents accurate assessment of z values below 10 nm (Fig. 3) from sequen-tial measures of holograms and spasequen-tial averaging of the quantity E1/E0over the whole image of the piezo-electric
actuator (triangles). The sensitivity of the measurement of z can be further enhanced by spatial averaging of the complex-valued ratio E1/E0, if the first-order side band
hologram ∝ E1 and the non-shifted light component
hologram ∝ E0 are acquired simultaneously (Fig. 3,
circles). Simultaneous measurement of side bands holograms at both optical modulation bands can be performed by a rudimentary coherent frequency-division multiplexing scheme with a dual LO, which will shift E0 and E1 in the available temporal bandwidth of the
camera, ensuring phase-matching of these quantities. The LO signal consists of the addition of two coherent (phase-locked) RF signals, shifted by a carrier frequency ωC/(2π) ∼ 80 MHz set around the peak frequency
re-sponse of acousto-optic modulators used to shift the opti-cal frequency of the laser beam. This summation is done in practice with a power splitter/combiner (figure1), re-sulting in a LO field of the form ELO = ELO1 + ELO2,
with
ELO1 = ELO1exp [i (ωL+ ωS/4) t] (4)
ELO2 = ELO2exp [i (ωL+ ω − ωS/4) t] (5)
where ELO1 = αELO and ELO2 = βELO are the complex
magnitudes of the LO components. The positive param-eters α and β (which satisfy the relation α + β = 1) are the normalized relative weights of each LO component, whose magnitudes are reported in fig. 2(b). In the re-ported experiment, α/β = 1/10. In these conditions, the
jH k àj (a.u.) (a) (b) (c)
E
1j j
E
à1j
j
E
0j j
E
LO1j
j
E
LO2j
j
jE
1E
ãLO2j
jE
0E
ãLO1j
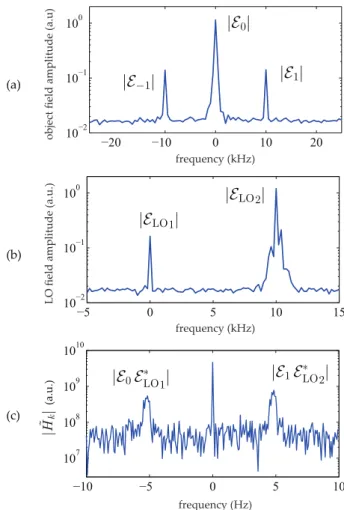
FIG. 2: (a) Magnitude of the spectrum of the object field E whose phase is modulated at 10 kHz, showing the first lateral bands ∝ |E±1| and the non-shifted component ∝ |E0| (supply
voltage : 1 V) . (b) Magnitude of the spectrum of the dual local oscillator ELO = ELO1 + ELO2. (c) Magnitude of the discrete Fourier transform ˜H, showing the bands of order 0 and +1 shifted within the temporal bandwidth of the camera.
interferogram impinging on the sensor array has the form I = |P
nEn+ ELO1+ ELO2|
2
(6) From which only three contributions are within the sen-sor temporal bandwidth, between the Nyquist frequen-cies ±ωS/2. The part of the off-axis hologram H
modu-lated at frequencies within the sensor bandwidth is H(t) = E0ELO∗ 1e
−iωSt/4+ E
1ELO∗ 2e
iωSt/4 (7)
from which a remaining static contribution, which yields the DC peak in figure 2(c), is neglected. The two terms in the right member of eq. 7 yield the peaks propor-tional to |E0ELO∗ 1| and |E1E
∗
LO2| in figure 2(c). We sought
to measure the modulation amplitude z of the actuator oscillating at ω/(2π) = 10 kHz, at low supply voltages ranging from 10−2
V to 10 V. For each voltage, N = 256 interferograms Ip, {p = 1, . . . N } were acquired. Each
recorded interferogram Ip was turned into a
3
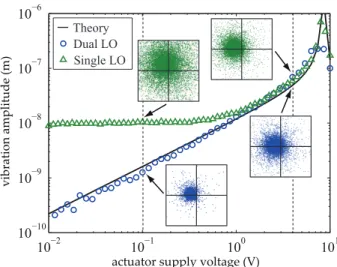
actuator supply voltage (V)
vib rat io n am p lit ud e (m )
FIG. 3: Modulation amplitude versus PZT supply voltage : theoretical curve (line), sequential single LO measurement (triangles), dual LO measurement (circles). Insets : complex constellation diagrams of ˜H (ωS/4) / ˜H (−ωS/4) at 0.1 V and 4
V with both approaches; axis ranges at a given supply voltage are the same.
Fresnel transform [12]. The off-axis region of Ip, noted
Hp = H(2πp/ωS), was Fourier-transformed temporally;
the k-th point of the discrete transform is ˜
H (ωk) =PNp=1Hpexp (−2ipkπ/N ) (8)
where the ωk are linearly spaced between the Nyquist
frequencies −ωS/2 and ωS/2. The spectrum | ˜H (ωk) |,
re-ported in figure 2(c), exhibits two peaks at ωk = ±ωS/4.
As expected from the relation 7, the magnitude of the peak at −ωS/4 is proportional to the magnitude of
αE∗
LOE0, and the magnitude of the peak at ωS/4 is
pro-portional to βE∗
LOE1. Vibration amplitudes z were then
calculated from the relation z ≈ λ 2π α β D ˜H (ωS/4)/ ˜H (−ωS/4) E (9) where h i corresponds to spatial averaging over 100 × 100 pixels. For each voltage, sequential single LO mea-surements from 256 raw interferograms per band and simultaneous, dual LO measurements from 256 raw interferograms are used to calculate z values from the relation 9, which are reported in Fig. 3. The theoretical evolution of z, according to eq. 3, for a modulation depth that scales up linearly with the voltage, was added as a guide to the eye. The dual LO approach enables assessement of sub-nanometer vibration amplitudes, in agreement with to the theoretical evolution of J1/J0
(line), at least one order of magnitude below sequential single LO measurements, for which the noise floor lies at z ∼ 10 nm, in the same experimental conditions. The benefits of the combination of two LO signals arise for small-amplitude vibrations. The phase and the amplitude of the complex-valued quantities E1/E0, at low
signal levels are measured with much better sensitivity in dual LO regime than with the single LO approach. In particular, the phase relation of ˜H (ωS/4) / ˜H (−ωS/4)
between two pixels should only depend on the relative local phase retardation of the sinusoidal motion between those pixels in an ideal measurement. As it can be seen in the constellation diagrams in the complex plane (fig. 3, insets), the complex values of ˜H (ωS/4) / ˜H (−ωS/4)
are much less dispersed in dual LO regime than for the sequential, single LO measure. Since all the points of the actuator oscillate in phase, it enabled coherent averaging over the extent of the actuator’s image (eq. 9), which improved the SNR at low modulation depths.
In conclusion, we have proposed a robust coherent frequency-division multiplexing method to perform abso-lute measurements of small-amplitude sinusoidal optical phase modulation by time-averaged heterodyne holog-raphy in off-axis and frequency-shifting conditions. The scheme was validated by a quantitative measurement of sub-nanometric vibration amplitudes of a piezo-electric actuator. A dual optical local oscillator was introduced to shift and record two optical modulation bands simul-taneously in the temporal bandwidth of the detector array. This approach enabled a measurement of the ratio of the complex weights of the optical side bands with increased sensitivity with respect to a sequential measurement of the two bands, performed in the same experimental conditions.
[1] C. Barriere and D. Royer, Applied Physics Letters 79, 878 (2001).
[2] R. L. Powell and K. A. Stetson, J. Opt. Soc. Am. 55, 1593 (1965).
[3] P. Picart, E. Moisson, and D. Mounier, Applied Optics 42, 1947 (2003).
[4] G. Pedrini, W. Osten, and M. E. Gusev, Appl. Opt. 45, 3456 (2006).
[5] C. C. Aleksoff, Applied Optics 10, 1329 (1971).
[6] M. Ueda, S. Miida, and T. Sato, Applied Optics 15, 2690 (1976).
[7] F. Joud, F. Lalo¨e, M. Atlan, J. Hare, and M. Gross, Opt. Express 17, 2774 (2009).
[8] P. Psota, V. Ledl, R. Dolecek, J. Erhart, and V. Kopecky, Ultrasonics, Ferroelectrics and Frequency Control, IEEE Transactions on 59, 1962 (2012).
[9] S. Weinstein and P. Ebert, Communication Technology, IEEE Transactions on 19, 628 (1971).
[10] B. Samson, F. Verpillat, M. Gross, and M. Atlan, Opt. Lett. 36, 1449 (2011).
[11] V. Ledl, J. Vaclavik, R. Dolecek, and V. Kopecky, in 9th International conference on vibration measurements by laser and non contact techniques (AIVELA) (2010). [12] N. Verrier and M. Atlan, Appl. Opt. 50, H136 (2011).