HAL Id: hal-02989564
https://hal.archives-ouvertes.fr/hal-02989564
Submitted on 13 Nov 2020
HAL is a multi-disciplinary open access
archive for the deposit and dissemination of sci-entific research documents, whether they are pub-lished or not. The documents may come from teaching and research institutions in France or abroad, or from public or private research centers.
L’archive ouverte pluridisciplinaire HAL, est destinée au dépôt et à la diffusion de documents scientifiques de niveau recherche, publiés ou non, émanant des établissements d’enseignement et de recherche français ou étrangers, des laboratoires publics ou privés.
In situ XANES study of the influence of varying
temperature and oxygen fugacity on iron oxidation state
and coordination in a phonolitic melt
Charles Le Losq, Roberto Moretti, Clive Oppenheimer, François Baudelet,
Daniel Neuville
To cite this version:
Charles Le Losq, Roberto Moretti, Clive Oppenheimer, François Baudelet, Daniel Neuville. In situ XANES study of the influence of varying temperature and oxygen fugacity on iron oxidation state and coordination in a phonolitic melt. Contributions to Mineralogy and Petrology, Springer Verlag, 2020, 175 (7), pp.64. �10.1007/s00410-020-01701-4�. �hal-02989564�
Contributions to Mineralogy and Petrology
In situ XANES study of the influence of varying temperature and oxygen fugacity on
iron oxidation state and coordination in a phonolitic melt
--Manuscript
Draft--Manuscript Number: CTMP-D-20-00018R1
Full Title: In situ XANES study of the influence of varying temperature and oxygen fugacity on iron oxidation state and coordination in a phonolitic melt
Article Type: Original Paper
Keywords: magmas; iron; oxidation state; coordination; XANES spectroscopy; volcano Corresponding Author: Charles Le Losq
Institut de physique du globe de Paris Paris, Paris FRANCE
Corresponding Author Secondary Information:
Corresponding Author's Institution: Institut de physique du globe de Paris Corresponding Author's Secondary
Institution:
First Author: Charles Le Losq
First Author Secondary Information:
Order of Authors: Charles Le Losq Roberto Moretti, PhD Clive Oppenheimer François Baudelet, PhD Daniel R. Neuville Order of Authors Secondary Information:
Funding Information: Australian Research Council
(FL130100066) Not applicable
Natural Environment Research Council
(NE/N009312/1) Pr Clive Oppenheimer SOLEIL Synchrotron Dr. Charles Le Losq Chaire d'Excellence Université de Paris Dr. Charles Le Losq
Abstract: Iron oxidation state and environment in magmas affect their phase diagram and their properties, including viscosity and density, which determine magma mobility and eruptive potential. In turn, magma composition, pressure, temperature and oxygen fugacity affect iron oxidation state and coordination, potentially leading to complex feedbacks associated with magma ascent, degassing and eruption. While equilibrium experiments and models have led to a deep understanding of the role of iron in melts, our knowledge of the effects of disequilibrium processes on iron oxidation state and its structural role in lavas and magmas remains limited. Accordingly, we performed a series of dynamic disequilibrium experiments on a natural melt composition (a phonolite lava from Erebus volcano, Antarctica) at atmospheric pressure, in which oxygen fugacity and temperature were controlled and varied. During the experiments, we continuously measured iron oxidation and coordination using Fe K-edge dispersive X-ray Absorption Spectroscopy (XAS). We found that iron oxidation state changes in the phonolite melt are reversible and well reproduced by existing models. Changes in iron oxidation state are driven by joint diffusion of alkali cations and oxygen anions at magmatic temperatures (~1000 °C for Erebus phonolite). However, redox diffusion timescales are too slow for any significant oxygen exchange with the atmosphere at the lava/air interface or via air entrainment. Turning to iron coordination, while Fe 2+ and Fe 3+ are present mostly in an average five-fold coordination, complex
coordination variations decoupled from redox changes were detected. The data suggest transitions between Fe 3+ in four-fold and six-fold coordination prior to reduction or as a consequence of oxidation. This questions the possible implication of Fe coordination changes in triggering crystallisation of magnetite nanolites upon magma ascent, and, through such crystallisation events, in promoting magma explosivity.
Response to Reviewers: REPLY TO REVIEWERS
XXXXXXXXXXXXXXXXXXXXXXXXXXXXXXXXXXXXXXXXXXXXXXXXXXXXXXXXX XXXXXXXXXXXXXXXXXXXXXXX
### Editor comments ### Editor comment:
I also looked through your paper myself. For me, it was for example not > obvious where in Figure 2 the black data points for different coordination numbers are coming from. This should be directly explained in the figure caption.
Author’s reply:
We understand this comment, and we agree that the presentation of the origin of this diagram was not good, thanks for pointing this. This problem is now solved via the addition of the reference spectra as well as of the reference diagram + reference mineral spectra in Supplementary Figure 2. We also discuss in more details the centroid / intensity diagram in experimental methods, and we clarified the aim of our data protocol and the way we obtained our “updated” diagram.
We hope the changes we made will clear any doubt and solve all the concerns of reviewers 1 and 3 about data reduction. ***
Editor comment:
Also, I am wondering about the units of the normalized absorbance (normalized to what?) in Figure 1 and of the integrated intensity in Figures 2 to 4.
Author’s reply:
Normalised absorbance is the correct notation for the Y axis of XANES spectra that were corrected from any post-edge distortion effect and normalised such that the edge jump is of 1.
Signal correction and normalisation was performed using the Athena software as indicated in the manuscript, following the recommended procedure.
Integrated intensity directly means the integration of the pre-edge absorbance between the beginning and the end of the pre-edge. Another term would be pre-edge integrated absorbance, but the community tends to always use integrated intensity (see XAS papers of Wilke, Cicconi, Giuli, etc.) such that we respected this. The calculation of the integrated intensity was clarified in the Material and Methods section.
Editor comment:
Also, as far as I understand, the samples were heated in direct contact with a platinum wire. Normally, one would expect some iron loss due to alloying with the platinum. Did you check for this and can you exclude the possibility that this my have affected your interpretations?
Author’s reply:
Yes, they are contained in the Pt wire. As indicated in the experimental methods, we only report results from experiments that were triple-checked for any crystallisation and iron loss. Iron loss to the Pt wire results in a decrease in the measured Fe XANES signal, to modifications in the structure of the glass visible by Raman spectroscopy,
and of his color. For the reported experiments, the XANES signal was stable, we checked (when possible) after the runs that the Raman spectra of the quenched melt were in good agreement with that of the original material, and we systematically visually inspected, using a microscope, the samples to check that no nuggets of iron were present in the glass.
We observed iron loss to the wire in most experiments with Ar-H2, a very reducing gas. We also observed iron precipitation as metal nanonuggets in such experiments. We systematically excluded those experiments.
We need to say that we actually excluded more than half of the experiments we performed because we were not sure about the quality of the signal and that the sample composition was not modified during the run (to the best of our knowledge because microprobe analysis were not possible to perform, see text). No iron loss to the wire or precipitation of iron metal was observed in more oxidising conditions (N2 and Air), in agreement with previous experiments performed with this setup by Magnien, Cochain, Neuville, Cicconi and co.
Editor comment:
From an editorial point of view, I would ask you to ensure upon revision that the formatting of the manuscript is consistent with this journal. For example, there should be no numbering of headings and subheadings and journal titles in the reference list should be abbreviated.
Author’s reply:
Of course, the revised version now matches the formatting of CMP.
XXXXXXXXXXXXXXXXXXXXXXXXXXXXXXXXXXXXXXXXXXXXXXXXXXXXXXXXX XXXXXXXXXXXXXXXXXXXXXXX
### Reviewer #1 Reviewer’s comment:
The paper is well written and clearly structured; the abstract contains some language problems that should be looked at. Overall, the results and the analysis are well documented and do constrain most of the interpretations, unless stated otherwise below.
Authors reply:
Sorry about the abstract. We realised it was probably the result of a bad copy-paste of an older version as some sections were not supposed to be like this. We revised the abstract in the new manuscript, and we hope that those revisions solve this problem. Reviewer’s comment:
As outlined below, the cited literature is strongly biased and should be adopted to represent the work that has been done in that field.
Authors reply:
Excuse us about such bias, we tried solving this in the revised version, paying more attention to the references and citing more various sources of references from the works of Giuli, Wilke, O’Neill, Berry, Cicconi, Fiege, Cottrell, Zhang… We believe this solves the problem.
Reviewer’s comment:
The authors use the pre-edge centroid as a figure of merit to trace the changes in oxidation state, without converting to actual values of Fe3+/Fetot. This is fully
acceptable to analyze the dynamics of the reaction. Still they do plot pre-edge intensity and centroid on the diagram of Wilke 2001 and start interpreting the intensity in terms of site symmetry in an quantitative manner. The authors have not shown at all that their data reduction is consistent with the values of that diagram. This needs to be checked by known samples, e.g. known glasses or model compounds.
Authors reply:
We understand the concern of the reviewer. Indeed, we originally have not shown the reference diagram implemented in our laboratory with our data reduction protocol. We cited the thesis of Cochain, but we understand this is not enough.
As a consequence, we added the spectra of the reference compounds as well as the reference diagram in Supplementary Figure 2. The data reduction protocol is better presented in the Material and Methods section, as well as the establishment of this reference diagram with the used data reduction protocol.
We hope those changes will fulfil the reviewer expectations, and solve this problem. Thanks for pointing this weakness!
Reviewer’s comment:
Given the quality of the data presented in Fig. 1b, I suspect that the very low pre-edge intensity observed for samples in N2-gas is an artifact of the treatment. In fact the pre-edge intensity in figure 1b is quite low, which looks weird. Other in-situ measurements have not shown this (Wilke et al. 2007, Magnien et al. 2004, 2008). Especially, extracted pre-edges in the first two look pretty similar and
different to those here. Authors reply:
It is normal that our integrated intensities do not match those of Wilke or Magnien, as our data reduction protocol is not the same. Again, we take that into account by implementing a revised version of the centroid vs II diagram that was made using our protocol.
The pre-edge intensity in Figure 1b for the N2 sample just reflect the fact that this spectrum contains a mixture of Fe3+/Fe2+. Actually, the two contributions are fairly visible, and the intensity is coherent with what it should be. Also, the Ar-H2 spectrum is more noisy due to Ar absorbing a significant portion of the X-rays at ~ 7114 eV. Reviewer’s comment:
The authors need to prove that their data treatment is consistent with plotting it on this diagram. Otherwise, just don't use it and cut out all considerations regarding the site symmetry (coordination) of Fe. Analysis of the dynamics and extraction of the transport parameters should not be affected by this, as it directly uses the centroid.
Authors reply:
We believe that this problem is now solve with the addition of all the details mentioned above.
Reviewer’s comment:
Line 43 ff.: The overview on the literature does not give a comprehensive picture on the work that has been done on Fe in melt. Furthermore, it is strongly biased on work of the group, i.e. Neuville and friends. Wilke et al. 2001 is the basis for this XANES work, but the paper on quenched glass is Wilke et al. 2004. Anyway, there is further work to be cited in the XANES business! The sentence line 49-50 is even wrong by content. That Fe3+/Fe2+ partitioning is driven by the mentioned parameters is known way longer than those papers cited at this position. Please, correct this and provide a fair overview on the current status of the literature Fe in melts as well as the XANES approach.
Authors reply:
We believe the new version should avoid such citation caveat, and corrected this sentence. See the new introduction, lines 71-86.
Reviewer’s comment:
Line 60: Again literature is not complete. The in situ study of Wilke et al. 2007 (AmMin 92, pages 44-56) is missing, as well as the one of Drewitt et al. 2013 Phys Rev B 87, 224201 (2013) . There is even a short paper that describes a very similar experiment as the one here (Wilke et al. 2007, AIP Conf. Proc., 882, 293-295). Those data a very consistent to these presented here.
Authors reply: Thanks, we added those papers. Reviewer’s comment:
Line 67: What is meant by Fe3+/Fetot data are available for this composition and what is meant by parametrization? Please, specify in more detail. If this is so well known, why don't we find any comparison in the text? It would be really helpful to see what oxidation state can be expected for the used conditions.
Authors reply: This sentence was actually clumsy and thus removed from the new version. The reviewer will also appreciate that the comparison is now provided in Figure 5.
Reviewer’s comment:
Line 102: The units of the oxygen fugacity are missing. Bars? Only log fO2 has no units. Please, correct!
Authors reply: Corrected ! Reviewer’s comment:
Line 119: How can the composition of a glass be determined by Raman spectroscopy? This is non-sense, for the composition you would need to use microprobe or a SEM with EDX. In any case, provide a correct statement. Specify whether you really looked at the composition after the experiment by an appropriate method. If not then discuss the potential errors on the composition.
Authors reply:
It is very difficult to embed a full platinum wire in an epoxy ring for EMPA
measurements. Plus we don’t want to do that because Pt wires are expensive, have a time-consuming T-I calibration, and thus they are meant to be cleaned in HF and re-used for performing other experiments. So we had to check that sample composition was not affected during the experiments by other means.
There was little details on this part in the previous manuscript. In the revised version, we added more details on the protocol we adopted to prevent compositional changes or iron precipitation/alloying, and on the steps we took to detect such changes. Instead of going in details there, we invite the reviewer to have a look at the new Material and Methods section, lines 197-233. All elements are present to reply to this comment.
Just a precision: appropriately calibrated, Raman spectra can be used to determine the composition of a glass to within 0.5 to 1 mol%, depending on the element (see Di Genova et al. 2015 Journal of Raman Spectroscopy 46: 1235-1244 for an attempt on experimental glasses, and more particularly for a real application on MORB glasses Le Losq et al. 2019 American Mineralogist 104:1032-1049). Indeed, Raman spectroscopy is very sensitive to changes in the glass structure, which is driven by glass
composition. This is why, with some experiences performed at conditions similar to that of the original glass synthesis, we can check that Raman spectra of starting materials and of the glass from the experiments match. No differences indicates no change of glass composition in a quite tight chemical domain.
Reviewer’s comment:
At reducing conditions Fe may be easily lost to the Pt-wire, as documented by many studies.
Authors reply:
Yes, we had trouble for a fair number of experiments that showed significant changes in Raman spectra as well as optical changes as checked with the microscope. Those experiments were discarded, and are not reported in this publication as indicated in the Materials and Methods section.
To be honest, most experiments in Ar-H2 were affected by this effect and are not reported. Experiments in Air or N2 were not affected by this phenomenon, explaining why reported dynamic runs were made under those fO2 conditions.
Ar-H2 runs were not informative as, except at the beginning of the experiment were a few spectra can be acquired (the spectrum in Fig. 1B was acquired after 10 minutes of equilibration at the beginning of a run for instance), iron precipitated in most cases. This is why no dynamic runs under the Ar-H2 atmosphere are reported.
We must say that on 7 successfully performed “dynamic” runs, only three were really good as they met strict criteria indicating no crystallisation, no iron loss, no chemical change in the sample. In the other runs, we sometime tried to introduce Ar-H2 that resulted in Fe loss, we also set temperature at values too low resulting in a crystallisation visible on the XANES spectra and optically after the experiments, or simply the run went fine but the post-experiment Raman spectra looked odd (see Supplementary Materials for examples).
Again, we tried to better report on this in the Material and Methods section, so we invite the reviewer to have another read. We hope the new version will give a better overview of the performed work, and of the measures we took to be sure that sample chemical composition changes are negligible.
Reviewer’s comment:
Line 135: Using the diagram of Wilke et al. 2001,2004 means that the authors have to prove that their data treatment is consistent with the one used to construct the diagram. This could be easily done with a few measurements on glasses with known oxidation state.
Authors reply:
We were not be very clear in the previous version of the manuscript, but the data treatment for constructing the centroid versus intensity diagram is the same as the one used for the glasses. Indeed, the Wilke diagram had to be adapted to the results obtained with our data reduction protocol. To clarify this, the new version of the manuscript presents in Supplementary Figure 2 the reference materials used for reconstructing the centroid versus intensity diagram, and this is now much better presented in the new manuscript (see Lines 235-270).
Reviewer’s comment:
Figure 1: The quality of the data measured in air seems great. However, those in Fig. 1b are much worse. I am completely disturbed by the low pre-edge intensity of the N2-spectrum. With such data it seems questionable that the analysed centroid and intensity values can be directly compared to the centroid diagram without further proof. Authors reply:
The pre-edge intensity of the N2 spectrum is not low, it is actually bimodal with a clear separation between Fe2+ and Fe3+ contributions. We want to remind the reviewer that Fe2+ contribution is much less intense that the Fe3+ contribution (see intensity versus centroid diagrams).
The integrated intensity of this signal agrees with the trend [5]Fe2+ - [5]Fe3+ reported in figure 2 for instance.
The higher noise under the Ar-H2 atmosphere is due to the higher absorption of X-Rays by Ar than by air, O2 or N2.
Reviewer’s comment:
I am not questioning that the values do reflect the state and dynamics of the oxidation state. I only question that you can compare them to the diagram. Since the systematics of the oxidation state in this melt system are known (see above), the authors could provide info what the expected oxidation state is for the given conditions. This way one could document how the centroid position on the diagram reflects the oxidation state. Authors reply:
Thanks for this comment. We originally thought this would not bring something to the discussion, but you made us realize that this will be better with the comparison! This is now performed, see Results section lines 325 – 356 and new Figure 5. Reviewer’s comment:
Line 195: I have never seen such a trend on the centroid diagram. Data of the in-situ study of Wilke et al. 2007 plot very similar to the trend known for glasses from many other XANES studies. This is a further indicator that the authors should first proof that their data treatment is consistent with this diagram. What are the expected oxidation state values for the presented conditions? E.g. by Schuessler et al. 2008, Kilinc et al. or the Moretti model?
Authors reply:
Please again see new Figure 5 for the oxidation state of iron.
Yes, we also never saw such a trend. But to our knowledge, nobody really reported trends in this diagram during dynamic in situ experiments… The dynamic Wilke experiments do not report data in the centroid versus integrated intensity diagram as they only acquired a very limited portion of the signal (actually at one given energy). Therefore, the lack of systematic records of in situ XAS spectra during iron redox changes in melts may explain why this has never really be reported previously. There is no problem with the oxidation state of the melts, see Figure 5 where equilibrium data from all experiments presented in Figures 1 to 4 are reported.
Thus, with changes in redox coherent with expectation, we have changes in Fe CN that are happening during the dynamic experiments. At the moment, we have no real answer about the factor controlling such changes. This will be the topic of new experiments in the upcoming years.
Reviewer’s comment:
Line 222: This is a completely unconstrained statement. How can the authors detect ionic couplings with surrounding oxygens by XANES?
Authors reply: Wrong choice of word, this was deleted. Reviewer’s comment:
The pre-edge reflects the average site symmetry, nothing more. Authors reply:
Yes, we just meant that by detecting Fe3 in CN 4-5 via XAS and coupling this information with the theory, this implies Fe3+ as a network former unit in FeO4 and FeO5 polyhedra. But again, wrong choice of word, and the discussion of the new version changed significantly for improved clarity. We invite the reviewer to have another look at the discussion.
Reviewer’s comment:
If well calibrated the authors may turn this into information on the average coordination polyhedron. I am missing the calibration!
Authors reply:
Again, we understood this point and as commented several time above, we provide such data now. Please see Material and Methods, Supplementary Figure 2 and the new Results section.
Reviewer’s comment:
Line 345: It has been shown that the Fe oxidation state may be easily changed at temperatures just above the glass transition (e.g. 600°C), Burkhard 2001, J Petrology 42, 507-527. So, this final statement seems to be rather arbitrary. Further, the whole paragraph does not mention at what temperature the scenario is discussed. Please, rewrite.
Authors reply:
The lava lake size is of 40*80 meters, with a depth that probably scales in the ~ tens of meter value. Typical residence time of the magma is of the order of ~ 5-10 minutes (see reference in the manuscript), so even with diffusion at Tg (much slower than at 1100 °C !) you would have only a very limited diffusion front and would not modify the bulk redox state of the magma.
This is actually what is happening because the redox state of the magma is more reduced at surface that in the deep part of the conduit. Please see Oppenheimer et al. (2009) for details and Discussion in this paper.
We modified the paragraph to include the temperatures (they were in Figure 6). This statement is not arbitrary but results from a logical deduction, so we did not modify it. Reviewer’s comment:
Line 354: I think the statement on the structural role is completely unconstrained, which is based on the defined reactions used for thermodynamical analysis. Even a 4-fold coordinated Fe2+ cannot be regarded as network-modifier due the low field-strength of this cation.
Authors reply:
We guess the reviewer meant that Fe2+ in four fould coordination cannot be regarded as a network former, and we agree. We modified the manuscript and our equations to take that into account.
Reviewer’s comment:
One could rather consider it as a strong network modifier. Authors reply: Yes, we agree.
Reviewer’s comment:
If there is really 4-fold coordinated Fe2+ then this rather indicates the shortcoming of our simple picture of silicate melts. Mg2+ shows a very similar structural role as Fe2+, no one would ever consider it as network former.
Authors reply:
This is a valid point, indeed. We did not really consider Fe2+ in CN4 as a network former unit in the same way as Si for instance, but rather wanted to point that Fe2+ in CN4 may have properties very different from other CNs… In any case, it is unlikely to find Fe2+ in CN4 given our data. We thus rewrote this part to clarify things.
Reviewer’s comment:
Please, rewrite all these assignments in an appropriate way, so that it is constrained by the data. I do admit though that Fe3+ may be found in both structural roles, similar to Al3+.
Authors reply: Done, please see the new version od the discussion, and in particular lines 388-410.
##################################################################### ###########
#### Reviewer #2 Reviewer’s comment:
Line 18: Missing 'of' before iron. Authors reply: Corrected. Reviewer’s comment:
Line 30: I would suggest to change 'hence on how they associate' to 'associating' (and 'releasing') to simplify the sentence.
Authors reply: The abstract has changed, we hope the new version will fulfil the reviewer’s expectations.
Reviewer’s comment:
Line 47: Can the authors give one or two examples of how iron oxidation state affect the physico-chemical properties of melts?
Authors reply: Examples are now provided, please see the new introduction. Reviewer’s comment:
Lines 59-60 and 65-66: Simplify/Reorganize by saying 'can however be studied in-situ (i.e, at high temperature in the liquid state) using […XANES] spectroscopy' and 'In this study, we used in-situ Fe K-edge XANES spectroscopy to investigate the coordination'. Authors reply: Done, thanks.
Reviewer’s comment: Line 70: Signal without s? Authors reply: Corrected. Reviewer’s comment:
Line 80-81: can the authors briefly mention what kind of method they used to prepare the crystal free starting material? It's only few extra words, but it helps the reader not to have to go and check in previous papers…The reference to Le Losq et al. should however be kept.
Authors reply: Yes, good point. We added a whole paragraph and kept the reference for details.
Reviewer’s comment:
Line 89: I would suggest using 'in-situ XANES measurements' rather than 'experiments by XANES spectroscopy'.
Authors reply: Done. Reviewer’s comment:
Line 98: specify 'intensity on the Pt wire'. Authors reply: Done.
Reviewer’s comment:
Line 99: 'and temperature was monitored during measurements with an optical pyrometer' - I think this formulation would be clearer for non experimentalist? Authors reply: Yes, corrected.
Reviewer’s comment:
Line 125: The authors had just finished describing Raman spectra, so I would advise to say XANES spectra here, so that the sentence is clearer for the reader.
Authors reply: Yes, thanks, corrected. Reviewer’s comment:
Line 138: 'the Fe K-edge edge' - to correct.
I would also advise to replace 'constant fO2' by 'air fO2'. Or even just mention 'in air (fO2=0.21).
Authors reply: Corrected Reviewer’s comment:
Line 144: 'varying fO2 (air, N2, ArH2)' Authors reply: Corrected.
Reviewer’s comment:
Line 144-147: I suggest to change to 'clearly showing the reduction of Fe, until Fe2+ dominates under ArH2 fO2 (10-15)' to shorten the sentences.
Authors reply: Thanks, modified. Reviewer’s comment:
Line 195: the Authors mention Fe3+ in CN4. Is that for air (ie., not shown in Figure 2 or 3)? Please explain.
Authors reply: We deleted this sentence, it was not right and not very informative. This helped improve this part.
Reviewer’s comment:
Lines 215-217: Why using the prime notation and not FeIIFeIII?
Indeed, the FeII FeIII notation will be more coherent with e.g. Moretti 2005 for instance. Authors reply: Yes, thanks, this is a good point, and we modified the text to follow the notation introduced in Moretti (2005)
Reviewer’s comment:
Line 222-223: remove nevertheless Authors reply: Corrected.
Reviewer’s comment:
Line 227: Missing space between these and phonolites Authors reply: Corrected.
Reviewer’s comment:
Line 309 and 331: The authors give two slightly different water contents for the Erebus lavas. Is the 0.2wt% also based on Moussalam et al?
Authors reply:
The mean value in the superficial plumbing system is of 0.2 wt%, and the most hydrous phonolites (at depth) present a water content that can reach 0.6 wt%. This is implied as in the first case we clearly speak of the lava lake, and in the second case of the tephriphonolite to phonolite evolution trend. All values were published in the cited papers.
We modified the text to reflect this and make things clearer. Reviewer’s comment:
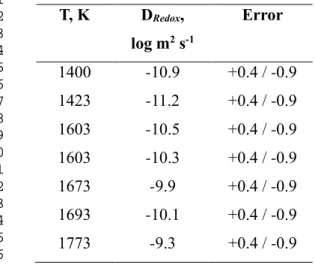
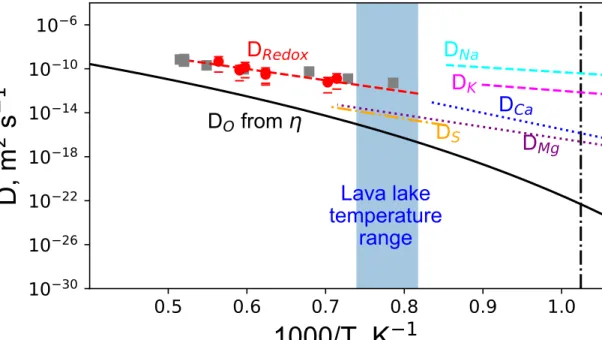
Figure 5: The authors report Di from rhyolitic compositons. Can the authors precise how different they may be for a phonolitic composition?
Authors reply:
We did not find lots of data regarding diffusion experiments. Most of them were done on rhyolites, a few on basalts, and also on simplified compositions. Rhyolites are richer in silica and depleted in alkaline-earth elements compared to phonolites. However, both present an important fraction of alkali elements, which drive redox exchanges at temperatures close to Tg. This is why we have chosen to plot D values from rhyolites in this case (also because D values on phonolites do not exist…)
We added a comment to clarify such choice in the text, see lines 493-504.
##################################################################### ##########
#### Reviewer # 3 Reviewer’s comment:
My main request is to have more detail on the experimental and analytical set-up, and for supplementary data to be provided.
Authors reply:
We thank the reviewer for the comments that helped improving this part of the manuscript.
The new version of the manuscript comes with an updated Material and Methods section, supplementary figures presenting the XANES standard for the centroid versus integrated intensity diagram, examples of Raman spectra of starting materials and of successful runs and failed experiments, and examples of pre-edge modelling. We hope that those new pieces of information will fulfil the reviewer expectation.
Reviewer’s comment:
“Iron redox and environment” – title, L24, L36
The term “environment” is here used as a way to summarize the variables of temperature and atmospheric gas composition, both of which are controlled in the experiment set-up. I think the title is a little misleading: as it is worded, it implies that the paper is a dynamic study of environment, but actually the “environment” variables are being controlled and what is being studied is the response to the changing environment in iron redox and co-ordination number. Could the title and phrasing in L24, L36 be modified slightly to reflect this? E.g. L24 “In such cases, little is known about the behaviour of iron redox in response to a rapidly changing magmatic environment”.
Authors reply:
We understand that the term “environment” leads to some confusion as it could refer to T-fO2 as stated by the reviewer, but by iron environment we actually meant iron molecular environment.
This is now clarified by the new version of the title, where we replaced environment by coordination. This was also changed in the abstract.
Reviewer’s comment:
I’d consider pressure to be an “environmental” variable relevant to natural magmatic systems. Please add a sentence somewhere near the beginning explaining that P is an intensive variable that does change in natural systems, even though this particular study is conducted at constant P. Do the authors expect that pressure would also have some effect on iron speciation and co-ordination number? It would be interesting for the authors to comment on what effect (or not) pressure might be expected to have. The biggest pressure effect might be outgassing of redox-sensitive volatiles like sulfur, so this could usefully be added to the discussion section around L340.
Authors reply:
The effect of pressure is actually know for iron: it promotes higher coordinated species (e.g. see Sanloup 2016 Chemical Geology 429:51 and references cited therein) and forces iron to go in a 2+ valence as pressure increases (e.g. O’Neill et al., 2006, American Min. 91:404).
However, you have to go to the GPa range to see effects, at pressure higher than those of the superficial Erebus plumbing system. Furthermore, we just cannot perform the same experiments under pressure. This is why all the discussion is geared toward the lava lake and the superficial plumbing system.
We included a paragraph on the effect of pressure in the Discussion (see lines 530-539), thanks for the wise suggestion.
Reviewer’s comment: Experimental methods
I would like to see a brief summary of the preparation of the starting material. Is it prepared by crushing the bulk sample including the 30 vol.% anorthoclase phenocrysts?
Le Losq et al. Erebus XANES measurements P a g e | 1
In situ XANES study of the influence of varying temperature and oxygen
1
fugacity on iron oxidation state and coordination in a phonolitic melt
2Charles Le Losq1,2*, Roberto Moretti1,3, Clive Oppenheimer4, François Baudelet5, Daniel R. 3
Neuville1 4
5
1 Université de Paris, Institut de physique du globe de Paris, UMR 7154 CNRS, 75005 Paris, France 6
2 Research School of Earth Sciences, The Australian National University, Building 142, Mills Road, Acton, ACT 2601, 7
Australia. 8
3 Observatoire Volcanologique et Sismologique de Guadeloupe, Institut de Physique du Globe de Paris, 97113 9
Gourbeyre, France 10
4 Department of Geography, University of Cambridge, Downing Place, Cambridge, CB2 3EN, United Kingdom. 11
5 SOLEIL Synchrotron 12
13
*Corresponding author: lelosq@ipgp.fr 14 ORCID numbers: 15 Charles Le Losq: 0000-0001-8941-9411 16 Roberto Moretti: 0000-0003-2031-5192 17 Clive Oppenheimer: 0000-0003-4506-7260 18 Daniel R. Neuville: 0000-0002-8487-5001 19
Manuscript Click here to
access/download;Manuscript;LeLosq_Erebus_Redox_2019_R
Click here to view linked References
1 2 3 4 5 6 7 8 9 10 11 12 13 14 15 16 17 18 19 20 21 22 23 24 25 26 27 28 29 30 31 32 33 34 35 36 37 38 39 40 41 42 43 44 45 46 47 48 49 50 51 52 53 54 55 56 57 58 59 60 61 62 63 64 65
Le Losq et al. Erebus XANES measurements P a g e | 2
Abstract
2021
Iron oxidation state and environment in magmas affect their phase diagram and their properties, 22
including viscosity and density, which determine magma mobility and eruptive potential. In turn, 23
magma composition, pressure, temperature and oxygen fugacity affect iron oxidation state and 24
coordination, potentially leading to complex feedbacks associated with magma ascent, degassing 25
and eruption. While equilibrium experiments and models have led to a deep understanding of the 26
role of iron in melts, our knowledge of the effects of disequilibrium processes on iron oxidation 27
state and its structural role in lavas and magmas remains limited. Accordingly, we performed a 28
series of dynamic disequilibrium experiments on a natural melt composition (a phonolite lava from 29
Erebus volcano, Antarctica) at atmospheric pressure, in which oxygen fugacity and temperature 30
were controlled and varied. During the experiments, we continuously measured iron oxidation and 31
coordination using Fe K-edge dispersive X-ray Absorption Spectroscopy (XAS). We found that iron 32
oxidation state changes in the phonolite melt are reversible and well reproduced by existing models. 33
Changes in iron oxidation state are driven by joint diffusion of alkali cations and oxygen anions at 34
magmatic temperatures (~1000 °C for Erebus phonolite). However, redox diffusion timescales are 35
too slow for any significant oxygen exchange with the atmosphere at the lava/air interface or via air 36
entrainment. Turning to iron coordination, while Fe2+ and Fe3+ are present mostly in an average 37
five-fold coordination, complex coordination variations decoupled from redox changes were 38
detected. The data suggest transitions between Fe3+ in four-fold and six-fold coordination prior to 39
reduction or as a consequence of oxidation. This questions the possible implication of Fe 40
coordination changes in triggering crystallisation of magnetite nanolites upon magma ascent, and, 41
through such crystallisation events, in promoting magma explosivity. 42
43
Keywords: magmas, iron, oxidation state, coordination, XANES spectroscopy, volcano
44 45
Declarations
46 47 Funding 48We acknowledge SOLEIL (Gif sur Yvette, France) for provision of synchrotron radiation facilities 49
(proposal 20101038). CLL acknowledges support received from the Australian Research Council 50
Laureate Fellowship (FL130100066) of Hugh St.C. O’Neill as well as from the Chaire d’Excellence 51
of the University of Paris during data processing and manuscript preparation. CO acknowledges 52
support from the Natural Environment Research Council (grant NE/N009312/1). 53 1 2 3 4 5 6 7 8 9 10 11 12 13 14 15 16 17 18 19 20 21 22 23 24 25 26 27 28 29 30 31 32 33 34 35 36 37 38 39 40 41 42 43 44 45 46 47 48 49 50 51 52 53 54 55 56 57 58 59 60 61 62 63 64 65
Le Losq et al. Erebus XANES measurements P a g e | 3
54
Conflicts of interest/Competing interests
55
Not applicable 56
57
Availability of data and material
58
All data are available in this manuscript and in Supplementary Materials. Raw data are available 59
upon request to the corresponding author. 60 61 Code availability 62 Not applicable 63 64 Authors' contributions 65
CO collected the samples for analysis. CLL, RM, CO and DN designed the study. CLL, RM, FB 66
and DN performed the XANES experiments. CLL processed the data and drafted the manuscript. 67
All authors contributed to the final version of the manuscript. 68 1 2 3 4 5 6 7 8 9 10 11 12 13 14 15 16 17 18 19 20 21 22 23 24 25 26 27 28 29 30 31 32 33 34 35 36 37 38 39 40 41 42 43 44 45 46 47 48 49 50 51 52 53 54 55 56 57 58 59 60 61 62 63 64 65
Le Losq et al. Erebus XANES measurements P a g e | 4
Introduction
6970
The importance of iron in magmatic systems has prompted many studies concerning its 71
environment and oxidation state in lavas and magmas (e.g. Berry et al., 2003; Wilke et al., 2004; 72
O’Neill et al., 2006; Cottrell et al., 2009; Giuli et al., 2012; Zhang et al., 2018; Berry et al., 2018, 73
O’Neill et al., 2018), its effects on their rheology (e.g. Dingwell and Virgo, 1987; Dingwell, 1991; 74
Chevrel et al., 2013, 2014) and its structural role in melts and glasses (e.g. Fox et al., 1982; Mysen 75
et al., 1985; Cooney and Sharma, 1990; Wang et al., 1995; Magnien et al., 2004, 2006, 2008; 76
Cicconi et al., 2015a,b). Iron can exist in melts in two valence states (Fe2+ and Fe3+) that have 77
different effects on melt physico-chemical properties. In particular, iron affects the density and 78
viscosity of silicate melts. For instance, increasing the relative fraction of Fe2+ in an iron-bearing 79
sodium silicate melt decreases viscosity by nearly an order of magnitude at constant temperature 80
(Dingwell and Virgo, 1988). Changes in iron oxidation state also affect melt density because of the 81
different partial molar volumes of FeO and Fe2O3, thereby influencing magma mobility and 82
explosivity (see the reviews of Gonnermann et al., 2013; Gonnermann 2015; and Le Losq et al., 83
2020 and references cited therein). 84
85
Previous studies of iron redox state in quenched glasses (e.g. Kilinc et al., 1983; Kress and 86
Carmichael, 1991; Sack et al., 1980; Wilke et al., 2001, 2004, Berry et al., 2003; O’Neill et al. 2006; 87
Cottrell et al., 2009; Giuli et al., 2012; Cicconi et al., 2015a) or, more recently, in silicate melts via 88
high temperature X-ray Absorption (XAS) spectroscopy (Magnien et al., 2004, 2006, 2008; Métrich 89
et al., 2006; Wilke et al., 2007a,b; Cochain et al., 2013; Drewitt et al., 2013; Cicconi et al. 2015b; 90
Alderman et al., 2017; Bidegaray et al., 2018) have shown that the iron oxidation state in silicate 91
melts is driven by temperature, oxygen fugacity, pressure and melt chemical composition. 92
Accordingly, the effects of iron on the structure and properties of silicate melts are complex 93
functions of those parameters. 94
95
Both parametric (e.g. Kress and Carmichael, 1991; Jayasurika et al., 2004; Borisov et al., 2018) and 96
thermochemical (Ottonello et al., 2001; Moretti, 2005) models permit estimation of the iron redox 97
state, hereafter expressed as Fe3+/FeTOT where FeTOT = Fe2+ + Fe3+, as a function of temperature, 98
oxygen fugacity and melt chemical composition. Such models are mostly based on analyses of 99
experimental glasses formed by quenching silicate melts equilibrated at given conditions (e.g. Kress 100
and Carmichael, 1991). However, such data do not provide insights into dynamic changes likely to 101
be occurring at high temperature in the molten state in magmatic systems. Such processes can 102
however be studied in situ (i.e, at high temperature in the liquid state) through Fe K-edge X-Ray 103 1 2 3 4 5 6 7 8 9 10 11 12 13 14 15 16 17 18 19 20 21 22 23 24 25 26 27 28 29 30 31 32 33 34 35 36 37 38 39 40 41 42 43 44 45 46 47 48 49 50 51 52 53 54 55 56 57 58 59 60 61 62 63 64 65
Le Losq et al. Erebus XANES measurements P a g e | 5
Absorption Near Edge Structure (XANES) spectroscopy (Magnien et al., 2004, 2006; Métrich et al., 104
2006; Wilke et al. 2007a,b; Magnien et al. 2008; Cochain et al., 2013; Cicconi et al. 2015a, 105
Bidegaray et al., 2018). This approach can shed light on how iron oxidation state and coordination 106
number (CN) are affected by dynamic changes in intensive variables in natural lavas. Furthermore, 107
in situ XANES experiments avoid the problem of photoreduction of iron (Gonçalves Ferreira et al., 108
2013), which may compromise data acquired on glasses at room temperature (Gonçalves Ferreira et 109
al., 2013; Cottrell et al., 2018) 110
111
In this study, we leverage the dispersive setup of the ODE beamline at SOLEIL to obtain “snapshot” 112
Fe K-edge XANES spectra of an aluminosilicate melt of phonolitic composition from a natural 113
sample (a lava bomb) collected near the summit of Mt Erebus, Antarctica, in situ at high 114
temperature. As the only volcano presently erupting phonolitic lavas, and with an extensive body of 115
studies of its magmatic differentiation (e.g., Kyle et al., 1992; Oppenheimer et al., 2011; Iacovino et 116
al., 2016), degassing (e.g., Oppenheimer et al., 2008) and eruptive style (e.g., Aster et al., 2003; 117
Peters et al., 2018), Erebus serves as something of an archetype for alkaline magmatism. Because of 118
this and as alkali diffusion becomes an important process in iron redox mechanisms in silicate melts 119
below liquidus temperatures, the Erebus phonolite composition appeared to be particularly suited 120
and interesting for performing the in situ experiments. We acquired spectra continuously with 121
timesteps of hundreds of ms to 2 s enabling us to track the influence of changes in temperature or 122
oxygen fugacity. Our primary aim is to improve understanding of how dynamically-changing 123
intensive variables influence the Fe oxidation state and CN. 124
125
Material and Methods
126127
Samples
128 129
The starting material was prepared from a lava bomb sampled on the flanks of Erebus volcano, 130
Antarctica, renowned for its long-lived lava lake. The phonolitic lava contains around 30 vol% 131
phenocrystals of anorthoclase and minor (less than a few %) microlites of olivine, clinopyroxene, 132
magnetite and apatite, all held within a glassy matrix. Such a texture is typical of the lava bombs 133
ejected from the crater by the sporadic rupture of large gas bubbles at the lava lake surface. 134
135
Preparation of the crystal-free starting material is detailed in Le Losq et al. (2015), which focused 136
on evaluation of the viscosity of the Erebus phonolite magma. Briefly, we examined whole rock 137
samples. A representative portion of ~ 100 g of the sample was selected, and then cleaned in an 138 1 2 3 4 5 6 7 8 9 10 11 12 13 14 15 16 17 18 19 20 21 22 23 24 25 26 27 28 29 30 31 32 33 34 35 36 37 38 39 40 41 42 43 44 45 46 47 48 49 50 51 52 53 54 55 56 57 58 59 60 61 62 63 64 65
Le Losq et al. Erebus XANES measurements P a g e | 6
ultrasonic ethanol bath for 1 h. The sample was then crushed in an agate mortar and heated for 12 h 139
at 473 K. The resulting powder was weighed, and then melted in a platinum crucible at 1470 K. The 140
crucible was quenched in water and weighed in order to determine the water loss between 473 and 141
1470 K. Samples were next heated at 1800 K. The melts were quenched in water and the resulting 142
glasses were weighed again to quantify any further losses between 1470 and 1870 K. The obtained 143
glass was crushed in an agate mortar for 1 h, and heated again in the crucible at 1870 K. This 144
procedure was repeated a further two times. 145
146
Finally, four successive melting, quenching and grinding operations were performed in order to 147
obtain an homogeneous glass. The glass density (2.534(6) g cm-3) was measured using Archimedes’ 148
principle using toluene, and its chemical composition was determined using a Cameca SX50 149
electron microprobe, with a 10 μm beam diameter, 40 nA current, 15 kV acceleration voltage, and 5 150
s counting time. The composition of the starting glass is 57.4(4) wt% SiO2, 0.96(13) wt% TiO2, 151
19.8(2) wt% Al2O3, 5.3(2) wt% FeO, 0.2(2) wt% MnO, 0.89(5) wt% MgO, 2.6(1) wt% CaO, 7.0(3) 152
wt% Na2O and 4.6(2) wt% K2O (numbers in parentheses are 1σ analytical errors). 153
154
In situ XANES spectroscopy at the iron K-edge 155
In situ XANES measurements at the iron K-edge were performed on the energy-dispersive ODE
156
beamline at the SOLEIL synchrotron facility, France. This bending magnet beamline is equipped 157
with primary vertical focussing bent specular mirror and a horizontal focussing bent crystalline Si 158
(311) polychromator. The detector is a Princeton CCD camera of 400×1240 pixels. With a 500 mA 159
stored current the flux on the sample is around 2×10⁷ photon/ s/eV. This setup allows acquisition 160
of Fe K-edge absorption spectra between 7080 and 7250 eV with a resolution of ±0.2 eV in a single 161
shot in less than 2 s. Data acquisition timesteps were adjusted to optimise the observed signal to 162
noise ration and varied between 250 ms and 2 s. Beam size was approximately 30 m by 30 m 163
FWHM. Energy calibration of the monochromator was made with a metallic iron reference foil, 164
setting the first inflexion point in the Fe K-edge spectrum to 7112 eV. Reference spectra on this 165
material were acquired before and after each run to correct for any drift. 166
167
Samples were heated using a platinum wire, following the idea of Mysen and Frantz (1992). The 168
relationship between the electrical current intensity in the Pt wire, I, and the wire temperature, T, 169
was predetermined through melting salts of known fusion temperatures: KNO3 (337 °C), Ba(NO3)2 170
(592 °C), Li2CO3 (723 °C), NaCl (801 °C), K2SO4 (1069 °C), Li2SiO3 (1204 °C), CaMgSi2O3 171
(1391 °C), and CaSiO3 (1544 °C). Temperature was further monitored during experiments with an 172
optical pyrometer. With this setup, temperature could be varied from 500 K up to 2000 K with a 173 1 2 3 4 5 6 7 8 9 10 11 12 13 14 15 16 17 18 19 20 21 22 23 24 25 26 27 28 29 30 31 32 33 34 35 36 37 38 39 40 41 42 43 44 45 46 47 48 49 50 51 52 53 54 55 56 57 58 59 60 61 62 63 64 65
Le Losq et al. Erebus XANES measurements P a g e | 7
precision of ± 10 K (Neuville et al., 2014 and references therein). The furnace was equipped with an 174
enclosure and a gas-flow system to control oxygen fugacity by fluxing different gases, i.e. O2 (fO2 =
175
1 bar), air (fO2 = 0.21 bar), N2 (fO2 ~ 10-6 bar) and ArH2 (fO2 ~ 10-15 bar). With this setup, desired
176
temperatures were reached within seconds, while fO2 in the furnace enclosure could be varied from
177
one equilibrium gas to another in less than ~ 2–3 min, as the furnace volume is ~ 0.25 dm3 and the 178
gas flux a few L min-1. Accordingly, temperature and fO2 variations can be considered instantaneous 179
with respect to the typical times, of a few minutes to several hours, required to vary Fe3+/FeTOT and 180
Fe coordination number (CN) in the melts. 181
182
The goal of the experiments was to observe changes in the Fe K-edge XANES spectra following 183
variations in temperature and fO2. We did so by recording spectra through time for different runs
184
during which T and/or fO2 were varied. Each run involved loading powder of the starting glass
185
material in the hole of the platinum wire. Then, the sample was first heated for more than 10 min 186
above 1600 °C in air to ensure removal of any crystals that could form upon initial heating. We 187
acquired a spectrum at those initial conditions, then adjusted the temperature to the desired starting 188
value. The sample was held at the desired starting temperature for more than 30 min to ensure 189
attainment of equilibrium. Then, each dynamic experiment was initiated by suddenly varying T 190
and/or fO2, and spectra were recorded continuously through time (i.e. a spectrum was acquired
191
every 250 ms to 2 s depending on the initial chosen data acquisition setup). All runs were 192
terminated by acquiring a spectrum at 1600 °C in air, in order to detect any change in the Fe K-edge 193
XANES signal that would indicate changes in the iron chemical composition of the melt (e.g., 194
precipitation of Fe, crystallization, etc.). 195
196
During such high temperature experiments, two main problems can occur: loss of alkali elements 197
and metallic iron precipitation on the Pt wire under a reducing atmosphere like that imposed by the 198
Ar-H2 gas. It is thus necessary to analyse the melts after quench. However, in the present case, 199
microprobe analysis was impossible to perform because the quenched samples were contained in 200
the platinum wires that are re-used for other experiments (after cleaning in HF). To circumvent this 201
problem, we adopted the following strategy: 202
- We monitored the edge absorption value during data acquisition since iron loss is directly evident 203
in XAS spectra as a decrease of the edge intensity.; 204
- Noisy XAS signals with intermittent high-frequency features are characteristic of crystallisation. 205
In parallel with the edge absorption value, we thus monitored the appearance of such beyond the 206
edge during experiments; 207
- Unfortunately, loss of alkalis is not detectable during the XAS analysis but we limited the 208 1 2 3 4 5 6 7 8 9 10 11 12 13 14 15 16 17 18 19 20 21 22 23 24 25 26 27 28 29 30 31 32 33 34 35 36 37 38 39 40 41 42 43 44 45 46 47 48 49 50 51 52 53 54 55 56 57 58 59 60 61 62 63 64 65
Le Losq et al. Erebus XANES measurements P a g e | 8
likelihood of it occurring by working mostly below 1550 °C, a temperature very close to that of the 209
synthesis of the original glass at which alkali loss was not observed, and keeping the time at 210
temperatures above 1550 °C as short as necessary (10–15 min). 211
- After the experiments, optical and Raman analysies were performed on the glasses as an additional 212
check further for iron precipitation, crystallisation and chemical changes (e.g. Le Losq et al. 2019). 213
214
Here, we report only experiments for which, (i) XAS signals show no visible signs of iron loss or 215
nano-crystallisation, and (ii) post-experimental observations are consistent with the initial glass 216
optical quality and Raman signal (see Supplementary Figure 1). We encountered systematic 217
problems after ~15 min in the Ar-H2 atmosphere, with precipitation of Fe and/or crystallisation. 218
Accordingly, we limit our presentation of results to those that used air or N2. Unfortunately, no 219
viable results for the dynamic experiments with the Ar-H2 gas can be reported (except single-shot 220
spectra taken quickly after heating and iron reduction, as shown in Fig. 1B). 221
222
Fe precipitation was also detected at temperatures above ~1550 °C for some of the experiments in 223
the N2 atmosphere. However, no Fe precipitation was observed in air, even after heating the samples 224
at 1630 °C for 15–20 min (Fig. 1A). More generally, above 1120 °C, no crystallisation was 225
observed in the melts. Furthermore, after heating samples for 30 min at 1550 °C in air, the Raman 226
spectra remain similar to those of the initial glass (Supplementary Figure 1), indicating that no 227
significant chemical change has occurred. Consequently, we further focus on reporting long-228
duration experiments performed at temperatures below 1550 °C, as alkali loss should be very 229
limited under such conditions. Among seven runs that were performed, three meet the 230
aforementioned criteria and are reported below. 231
232
XANES data reduction protocol
233 234
The aim of this study is to calculate precisely the centroid (or ‘energy barycenter’) and integrated 235
intensity (area under the curve) of the iron XAS pre-edge near 7114 eV, corrected from a 236
background, as these variables can be used to determine iron oxidation state and speciation in 237
glasses and melts (Wilke et al., 2001, 2004; Berry et al., 2003; Magnien et al., 2004; Cottrell et al., 238
2009; Cicconi et al., 2015a; Fiege et al., 2017). Indeed, Wilke et al. (2001) established a centroid 239
versus integrated intensity (CII) diagram using mineral standards, which permits evaluation of the 240
mean coordination numbers of Fe2+ and Fe3+ in minerals. In the CII diagram (see Supplementary 241
Figure 2), reference points are indicated and correspond to the values for Fe2+ and Fe3+ in CN 4 to 6, 242
and the trends observed when changing the oxidation state of iron between those values are 243 1 2 3 4 5 6 7 8 9 10 11 12 13 14 15 16 17 18 19 20 21 22 23 24 25 26 27 28 29 30 31 32 33 34 35 36 37 38 39 40 41 42 43 44 45 46 47 48 49 50 51 52 53 54 55 56 57 58 59 60 61 62 63 64 65
Le Losq et al. Erebus XANES measurements P a g e | 9
represented by dashed lines. The CII diagram of Wilke et al. (2001) was originally implemented for 244
minerals, and then revised by Wilke et al. (2004) for glasses using appropriate standards. 245
Alternative data reduction protocols have also been developed (e.g. Giuli et al., 2012). 246
247
Choice of protocol (in particular the selection of the pre-edge baseline) is important since it affects 248
the numerical values of centroids and integrated intensities. Here, we apply the data reduction 249
protocol implemented by Cochain (2009; see also Cochain et al., 2009, 2013, and description 250
below). Spectra of Fe2+ (Gillepsite, Grandidierite, Kirschteinite, Hedenbergite) and Fe3+ 251
(Orthoclase, Yoderite, Hematite, Epidote) mineral standards from Cochain (2009) were processed 252
using the scheme described below in order to implement an updated CII diagram (Supplementary 253
Figure 2). 254
255
To determine pre-edge centroid and integrated intensity with precision, we modelled the pre-edge as 256
the sum of a background and two pseudo-voigt functions as developed by Cochain (2009) and also 257
presented in Cochain et al. (2009, 2013). For the background, an exponential function of the type y 258
= A exp (B (e – eo)) is chosen. The two pseudo-voigt functions are fitted to the observed signal with
259
an equal full-width-at-half-maximum and a fixed energy difference of 1.5 eV, in agreement with 260
recommendations from Wilke et al. (2001) and Berry et al. (2018). This ensures robustness and 261
reproducibility of the peak fitting protocol. An example of fit is provided in Supplementary Figure 262
3, together with histograms of the posterior probability distribution for the calculated pre-edge 263
centroid and integrated intensity. From the fits of six spectra of the melts with a Hamiltonian Monte 264
Carlo algorithm, covering the full encountered range of redox conditions, the maximum standard 265
deviations of the calculated centroid and integrated intensity follow gaussian distributions and are 266
systematically lower than 0.05 eV and 2 % at the 1σ confidence interval, respectively. This fitting 267
protocol thus has the advantage of being robust and highly reproducible, which is desirable for in 268
situ data that can present variable signal-to-noise ratios within a single run. Systematic fits of data
269
series (composed of hundreds to thousands of spectra) were performed with a MATLAB script 270
using the lsqcurvefit function (for non-linear least square fits) with the same starting conditions. 271 1 2 3 4 5 6 7 8 9 10 11 12 13 14 15 16 17 18 19 20 21 22 23 24 25 26 27 28 29 30 31 32 33 34 35 36 37 38 39 40 41 42 43 44 45 46 47 48 49 50 51 52 53 54 55 56 57 58 59 60 61 62 63 64 65
Le Losq et al. Erebus XANES measurements P a g e | 10
Results
272273
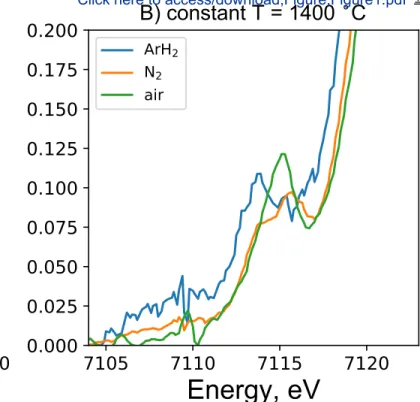
Before reporting the results of the dynamic runs, we introduce the spectra acquired in air at 274
equilibrium conditions. These illustrate how the Fe K-edge XANES signal changes with changing 275
temperature at air fO2, and, hence iron oxidation state in the melt. At air fO2, the Fe K-edge in 276
XANES spectra shift towards lower energy with increasing temperature (Fig. 1A), a variation 277
typical of iron reduction in aluminosilicate melts (e.g. Berry et al., 2003; Wilke et al., 2004). The 278
shape of the pre-edge also changes with increasing T from 1100 °C to 1630 °C at air fO2 (insert in 279
Fig. 1A), indicating variations in the melt Fe3+/FeTOT. For the conditions reported in Fig. 1A, since 280
the Fe3+ pre-edge has a greater integrated intensity than the Fe2+ pre-edge, the dominant Fe valence 281
in the melt must have been 3. At constant T but varying fO2 (air, N2, Ar-H2), the pre-edge shape 282
changes strongly (Fig. 1B), with the appearance of a contribution near 7113 eV that clearly 283
indicates the reduction of Fe, until Fe2+ dominates under Ar-H
2 atmosphere (fO2 ~ 10-15).
284 285
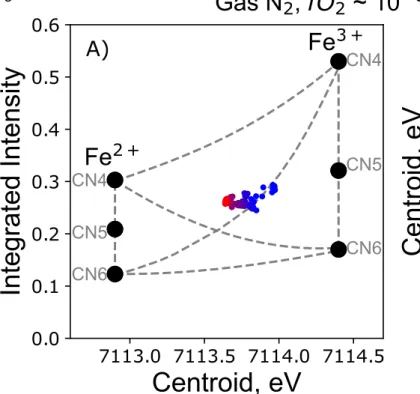
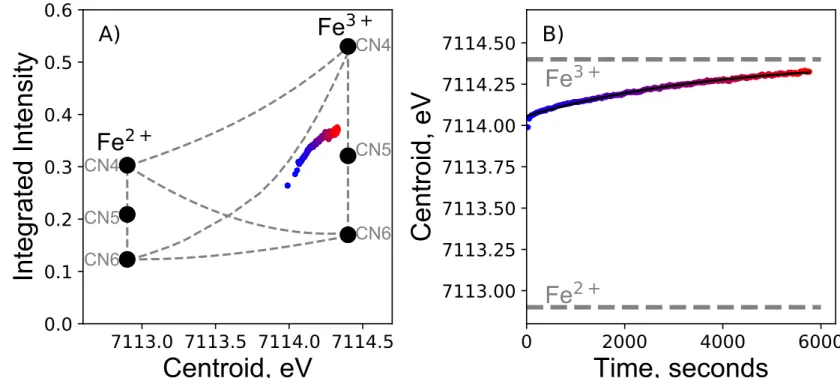
Fig. 2 shows how the pre-edge integrated intensity and centroid change with time after a sudden 286
increase in T from 1100 °C to 1420 °C at constant fO2, in a N2 atmosphere (fO2 ~3.5×10⁻⁶). This 287
sudden increase in T leads to a logarithmic decrease in the pre-edge centroid, indicating a 288
logarithmic decrease in Fe3+/FeTOT with time (Fig. 2B; Wilke et al., 2001). The CII diagram 289
suggests that the mean CNs of Fe2+ and Fe3+ are ~ 5, and do not change significantly with T, hence 290
Fe3+/FeTOT. 291
292
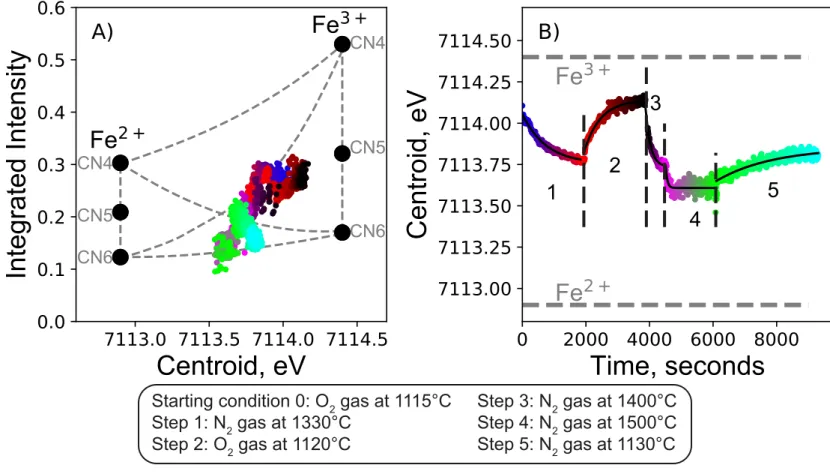
The ability to change T and fO2 either simultaneously or consecutively during experiments allowed
293
us to perform more complex, dynamic experiments. Figure 3 illustrates an experiment with a path 294
composed of multiple T- fO2 combinations. We first started with a melt in equilibrium with O2 gas at 295
1115 °C (fO2 ≈ 1), and then, in step (1) suddenly increased T to 1330 °C and decreased fO2 to that of
296
N2 gas (fO2 ~ 3.5×10⁻⁶ ). We see a non-linear decay of the pre-edge centroid, indicating a reduction 297
of the melt, as expected. A second step (2) was made, in which T was decreased to 1120 °C and fO2
298
switched to that of O2 gas (fO2 ≈ 1). In this case, the pre-edge centroid increases, describing a
299
logarithmic trend with time (Fig. 3B). Step 3 consisted of increasing T to 1400 °C while changing 300
fO2 from that of O2 gas to that imposed by N2 gas. A sudden decrease of the pre-edge centroid is 301
observed (Fig. 3B). During step 4, we kept fO2 to that of N2 but increased T to 1500 °C; a small and 302
rapid decrease of the pre-edge centroid is observed, which then quickly stabilized around 7113.6 eV 303
(Fig. 3B). Finally (step 5), we decreased T to 1130 °C at fO2 imposed by pure N2, resulting in a 304
progressive increase of the pre-edge centroid, indicating a final oxidation of Fe at this lower 305
temperature. We notice that this step 5 is characterized by a slow change of the pre-edge centroid, 306 1 2 3 4 5 6 7 8 9 10 11 12 13 14 15 16 17 18 19 20 21 22 23 24 25 26 27 28 29 30 31 32 33 34 35 36 37 38 39 40 41 42 43 44 45 46 47 48 49 50 51 52 53 54 55 56 57 58 59 60 61 62 63 64 65
Le Losq et al. Erebus XANES measurements P a g e | 11
describing a logarithmic trend again, but a plateau was not attained indicating that the experiment 307
was concluded before reaching equilibrium. 308
309
The integrated intensity of the pre-edge changed in tandem with the centroid during the multi-step 310
run presented in Fig. 3. Variations in steps 1 and 2 fall on a mean Fe2+ CN5 – Fe3+ CN5 trend in the 311
CII diagram (Fig. 3A). Variations in steps 3, 4 and 5 depart from this trend and indicate the 312
occurrence of Fe2+ and Fe3+ in CN6. In particular, at the beginning of step 4 (pink symbols in Fig. 313
3A), measurements in the CII diagram fall on the Fe2+ CN6 – Fe3+ CN6. This changes with time 314
during step 4, and measurements at the beginning of step 5 fall back on a Fe2+ CN5 – Fe3+ CN5 315
trend. They evolve again toward a Fe2+ CN6 – Fe3+ CN6 trend upon oxidation in step 5 (Fig. 3A). 316
317
A final successful run allowed us to acquire data following a simple T decrease from 1550 °C to 318
1150 °C at constant fO2 (0.21; on air). During this run, we observed a logarithmic increase of the 319
pre-edge centroid with time, and a non-linear evolution of the integrated intensity versus centroid 320
relationship (Fig. 4). This indicates that, while Fe3+/FeTOT is slowly increasing following the 321
temperature change (Fig. 4B), Fe coordination changes rapidly at first and then stabilizes after some 322
time (Fig. 4A). These data suggest that the Fe3+ mean coordination is slightly less than 5, while the 323
Fe2+ mean CN lies between 5 and 6. 324
325
Data obtained at equilibrium conditions and reported in Figures 1 to 4 can be used to estimate the 326
oxidation state of iron. Several methods are reported in the literature (e.g. see Berry et al., 2004; 327
Wilke et al., 2004; Cottrell et al. 2009; Fiege et al., 2017; Berry et al., 2018; Zhang et al., 2018). 328
Most methods rely on the use of fully oxidized and reduced standards for precision (e.g. Berry et 329
al., 2018, Zhang et al., 2018 and references cited therein). However, this was neither practical nor 330
pertinent in our case as during in situ experiments, the signal changes slightly with temperature 331
(Wilke et al., 2007a). Furthermore, even if we have signals from nearly fully oxidized and reduced 332
melts, we cannot assert that a linear combination of the XANES data, for instance, would provide 333
reliable results. Indeed, as we acquire XANES signals continuously, every 250 ms to 2 s depending 334
on the run, the signal to noise ratio varies with acquisition conditions. In particular, Ar absorbs part 335
of the X-ray signal, such that spectra acquired under Ar-H2 conditions are quite noisy (Fig. 1B). 336
Fortunately, the pre-edge is barely affected by temperature (Wilke et al., 2007a) and its centroid 337
remains easy to measure with precision in noisy data (see experimental methods). 338
339
Wilke et al. (2004) proposed an equation relating the variations of the pre-edge centroid to changes 340
in iron oxidation state in basaltic glasses, where Fe2+ and Fe3+ were found in CN5. Such a method 341 1 2 3 4 5 6 7 8 9 10 11 12 13 14 15 16 17 18 19 20 21 22 23 24 25 26 27 28 29 30 31 32 33 34 35 36 37 38 39 40 41 42 43 44 45 46 47 48 49 50 51 52 53 54 55 56 57 58 59 60 61 62 63 64 65
Le Losq et al. Erebus XANES measurements P a g e | 12
was reviewed by Fiege et al. (2017), who found that Fe oxidation state determination using the pre-342
edge centroid position is reliable to within ± 6 %. As Fe2+ and Fe3+ tend to be generally in CN5 in 343
our system (Figs. 2, 3, 4), we estimated iron redox in our melts using the equation provided by 344
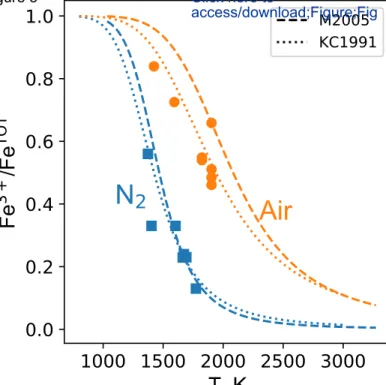
Wilke et al. (2004). Figure 5 presents the results of this exercise. The iron redox state values 345
calculated from the pre-edge centroid agree well with the predictions from the parametric model of 346
Kress and Carmichael (1991), used in the MELTS software (Ghiorso and Sack, 1995), and from the 347
thermodynamic model of Moretti (2005). We only notice a slight shift for the model of Moretti 348
(2005) from data at air fO2; the Kress and Carmichael (1991) model fits well the data at air fO2, and 349
both models agree well with data at N2 fO2. Both the Kress and Carmichael (1991) and Moretti 350
(2005) models were already tested by Schuessler et al. (2008) and shown to be accurate for 351
phonolites. Therefore, the estimates of the iron redox in the phonolite melts calculated from the pre-352
edge centroid and the equation provided by Wilke et al. (2004) are reliable, despite differences in 353
melt compositions, the fact that we are dealing with in situ data on melts, and the potential presence 354
of 6-fold coordinated iron species in our melts (Fig. 3). The standard deviation between the Kress 355
and Carmichael (1991) model (closest to all data) and measured values is equal to 0.04 (1σ, rounded 356
up value); it provides an estimate of the analytical error affecting redox data presented in Figure 5. 357
358
Discussion
359360
Chemical mechanisms of iron speciation and redox behaviour
361 362
Our observations confirm that changes in Fe3+/FeTOT in phonolite melts are entirely reversible 363
following variations in T and fO2,in agreement with previous findings from high temperature redox
364
measurements on different melt compositions (Wilke et al., 2007a,b, Magnien et al. 2008, Cicconi 365
et al. 2015b). Furthermore, iron oxidation state in phonolite melts is well described by existing 366
models (Figure 5), consistent with Schuessler et al. (2008). However, the data reveal that changes in 367
CN are more complex, and not systematically related to oxidation or reduction phenomena (Figs. 368
2A, 3A, 4A). The reported changes agree, in general, with the studies of Wilke et al. (2007), 369
Cicconi et al. (2015b) or Stabile et al. (2017) that revealed variations in the CII diagram following a 370
Fe3+ CN 4-5 and Fe2+ CN 5 pathway. But looking more closely, complex but subtle changes in CN 371
are evident (Fig. 4A), together with the possible occurrence of Fe in CN 6 (Fig. 3A). 372
373
The discrepancies may arise from the fact that previous studies mostly reported equilibrium values 374
in the CII diagram. Indeed, the dynamic studies of Magnien et al. (2006, 2008), Wilke et al. 375
(2007b), Cochain et al. (2009, 2013) or Bidegaray et al. (2018) did not report data in the CII 376 1 2 3 4 5 6 7 8 9 10 11 12 13 14 15 16 17 18 19 20 21 22 23 24 25 26 27 28 29 30 31 32 33 34 35 36 37 38 39 40 41 42 43 44 45 46 47 48 49 50 51 52 53 54 55 56 57 58 59 60 61 62 63 64 65