Special Issue on Data Literacy: Case Studies
Data Murals: Using the Arts to Build Data Literacy
Current efforts to build data literacy focus on technology-centered approaches, overlooking creative non-digital opportunities. This case study is an example of how to implement a Popular Education-inspired approach to building participatory and impactful data literacy using a set of visual arts activities with students at an alternative school in Belo Horizonte, Brazil. As a result of the project data literacy among participants increased, and the project initiated a sustained interest within the school community in using data to tell stories and create social change.
Introduction
Data has become more and more central to public and private institutions' decision-making processes. In the public sector, advocates for Open Government Data (OGD) at local, state and federal levels are creating open data policies and platforms (Davies & Bawa 2012). They are also leveraging data-informed and algorithm-managed decision making in topics ranging
Bhargava, R., Kadouaki, R., Bhargava, E., Castro, G., D’Ignazio, C. (2016) Data Murals: using the arts to build data literacy. The Journal of Community Informatics, 12(3), 197—216.
Date submitted: 2015-09-30. Date accepted: 2016-06-13.
Copyright (C), 2016 (the authors as stated). Licensed under the Creative Commons Attribution-NonCommercial-ShareAlike 2.5. Available at: www.ci-journal.net/index.php/ciej/article/view/1276
Rahul Bhargava
MIT Center for Civic Media, Cambridge, United StatesCorresponding Author. [email protected]
Ricardo Kadouaki
Independent Consultant, Brazil [email protected]Emily Bhargava
Connection Lab, United States [email protected]Guilherme Castro
Specialist in Public Policies and Governmental Management, Minas Gerais, BrazilCatherine D'Ignazio
Assistant Professor of Civic Media and Data Visualization, Emerson College, United States [email protected]from paroling criminals, to pricing parking fees, to predicting child abuse (McGinnis & Elandy 2012, Raman 2012). In the private sector, corporations manage significant datasets, collecting and combining data about people's everyday lives in a variety of visible and invisible ways; for purchasing analytics, marketing insights, predictive intelligence, and more (Duhigg 2012, Rostron 2013, Gangadharan 2012).
In both public and corporate contexts there is a growing demand for greater transparency and more ways to build data literacy among stakeholders and clients. Governments are making data-driven decisions more often, but most of the citizens they serve do not "speak" the language of data and thus cannot participate in those decisions (Gurstein, 2011). The lack of visibility into, and participation in, this data ecosystem can be actively disempowering for the people that are affected by it. In response many are arguing for greater engagement and data literacy education for the public (Dasgupta 2012, School of Data 2013, Patil 2012, Maycotte 2014, Harris 2012).
But what does "data literacy" really entail? Surveying existing definitions is beyond the scope of this discussion, but the wide variety suggests the definition is still being fleshed out (Schield 2004, Mandinach 2012, Calzada 2013, Deahl 2014, Schutt 2013). For this case study, we build on our previous work (Bhargava & D'Ignazio 2015), which defines data literacy as the ability to read, work with, analyze and argue with data. Reading data involves understanding what data is, and what aspects of the world it represents. Working with data involves acquiring, cleaning, and managing it. Analyzing data involves filtering, sorting, aggregating, comparing, and performing other such analytic operations on it. Arguing with data involves using data to support a larger narrative intended to communicate a message to a particular audience.
With this definition in hand, we see calls for increased data literacy coming from multiple sectors, but these calls and the responses to them have almost exclusively focused on technological interventions. Nonprofits like the Knight Foundation have funded tool building and online courses for journalists to build their data skills . Startups, hobbyists, and 1
established companies alike have created a massive number of websites offering tools to people working on cleaning, analyzing, and presenting data . International aid organizations, 2
nonprofits, and interested citizens have encouraged governments to adopt web-based open data platforms and standards across the globe (Goldstein 2013). Various efforts have been made to integrate data-literacy into public school curriculums, most centered on technology as the main mechanism for engagement (Philip 2013, Williams 2015). These technology-centric interventions to building data literacy have missed a crucial opportunity to look outside of the digital world for approaches and inspirations.
This paper documents one of our efforts to promote data literacy in Brazil with an arts-centric approach. Building on a rich tradition of using the arts and the lived experiences of participants as an invitation for civic engagement, we developed a process that allows a community to come together to look at their own data, find a story within it that they want to tell, create a visual design that tells that data-driven story, and then paint it together as a public
Disclosure: The Knight Foundation funded, in part, Rahul Bhargava's time working on this project, and has 1
funded Bhargava and D'Ignazio's tool building in this space.
See http://netstories.org for our attempt to catalog some of these tools. 2
mural. At an alternative private/public school focused on the creative arts in Minas Gerais, government administrators, public school staff and academic researchers came together to build data literacy by creating a mural like this with a group of students. We discuss the context that created this partnership, our theoretical grounding, the data mural process, and the short and longer term impacts from the project. We offer this case study as an example of how to build data literacy in novel and creative ways built on the needs, affordances, history, and context of the community one is working with.
The Context: Bringing Innovation to Minas Gerais
Minas Gerais is a state in the southwest of Brazil with 20 million inhabitants that live in 853 municipalities in a territory larger than France. It is one of the richest states in Brazil, driven by an economy based on commodities exports. Socially, it is known as a microcosm of Brazil, as it faces a challenging social divide between the poorer dry areas in the north and wealthy areas in the south.
In order to approach these challenges in an innovative way, in 2011 the Government of Minas Gerais established an Office of Strategic Priorities (hereafter referred to by its colloquial name, the "Escritorio"). The Escritorio acted as a public policy lab, responsible for bringing in and testing innovative projects to improve education, public safety, health and economic development. There was a strong focus on prototyping the use of new technologies to empower citizens and communities. For example, one project focused on developing and building a platform of social indicators ("Mapa de Resultados"), another offered visualization tools ("DataViva"), a third ("Movimento Minas") tried to stimulate participation and the co-creation of public policies, and a fourth focused on building an innovation ecosystem by creating a startup accelerator program ("SEED").
Within this context, in 2013, Minas Gerais became a member of the MIT Media Lab in order to build connections between the lab’s researchers and the public and private sectors in the state. The state of Minas Gerais was offered as a social laboratory for the Media Lab researchers to conduct their projects. Any innovative practices by researchers in Minas could be models for adopting across the state.
One key goal for the Escritorio was to work with various groups to use data to empower citizens and communities. Escritorio staff found mutual interest with Bhargava and Bhargava, who were leading a number of data literacy efforts in the US. They were invited to Minas Gerais to build data literacy through short-term programming and capacity building for various audiences.
Theoretical Background
One cannot engage the topic of "literacy" in the Brazilian (or any) context without first discussing Paulo Freire, the Brazilian educator and philosopher. His concept of Popular Education involves both the acquisition of technical skills and the emancipation achieved through the literacy process (Freire 1968). The latter is achieved through learner guided explorations, facilitation over teaching, accessibility to a diverse set of learners and a focus on real problems in the community. This stands in contrast to the traditional Western "banking" model of education in which an authority "deposits" knowledge into a student. Freire's
literacy is about empowerment via relevance to one's context and lived experience. His approach connects to and builds upon Piaget’s foundational work around the processes of “assimilation” and “accommodation” in learners (Piaget 1952). Piaget’s model describes how new information and experiences are either assimilated into a learner’s existing theories, or that new information causes the leaner to change her theories to accommodate the new information. Another inspiration is found in Vygotsky’s approach to how learners can engage-with and benefit-from interactions with more “capable” participants. His “zone of proximal development” theory offers a methodology that involves respecting both the independent skills of the learner, but also the process of being challenged and supported by more experienced co-learners or facilitators.
A Brazilian Approach to Data Literacy
Recent work has tried to address the question of how to apply a Freire-inspired approach to data literacy. Bhargava and D'Ignazio (2015) bring a Popular Education approach to building online data processing tools targeted at data literacy learners. Tygel and Kirsch (2015) theorize a "critical data literacy" based on Freire's generative themes, thematization, problematization and systematization stages. Our case study predates these works, but shares much with their theoretical and applied approaches.
This project is an example of how to implement our concept of "Dados Populares" ("Popular Data" in english); a Popular Education-inspired approach to building participatory and relevant invitations for learners to build a stronger and impactful data literacy (Bhargava, 2013). Popular Data activities must:
• invite participation from all parties • be guided by learners' interests
• focus more on facilitation than teaching • be accessible to a diverse set of learners • center around real problems in the community Using Arts Activities to Engage and Empower
Returning to the theme of looking outside of technology for rich and relevant opportunities to build data literacy, we find a long history of using the arts as an invitation to engage with, and reframe, people's relationships to power structures in everyday life. We mention some examples here to give a sense of this rich history and current practice. One rich example can be found in Mexican Muralism, which emerged in the 1920s after the Mexican Revolution to advocate for art in public places that depicted stories relevant to the everyday lives of all Mexicans (Rochfort 1998). The artists made specific efforts to include marginal groups such as rural, indigenous and non-European people. This movement went on to inform the Chicano Mural Movement in the 1960's, which accompanied grassroots mural creation with training workshops and explicit New Left political agendas and political organizing (Cockcroft & Barnet-Sánchez 1993).
The history of public performance has even stronger examples to draw from. Inspired directly by Freire's ideas and influenced by his position as a political exile, Brazilian theater director
Augusto Boal developed a methodology for participatory theater production in the 1970's. His "Theater of the Oppressed" is a set of techniques based around dialogue and dissolution of boundaries between audience and performer ("spect-actors") in the service of liberation. The Theater of the Oppressed approach continues to have worldwide influence, notably in India (Boal 1993). Contemporary creative approaches include those coming from the top-down and the bottom up. Antanas Mockus, mayor of Bogotá in the 1990s, used mimes, games and the arts in order to develop a safer civil society, reduce crime and prevent traffic deaths (Sommer 2014). Throughout the same decade, artist Suzanne Lacy staged elaborately produced dialogues between youth and police in Oakland, California, to address the profound lack of trust on both sides (Schutzman 2006). In 2007, Paul Chan worked with the Classical Theater of Harlem to stage the play "Waiting for Godot" in the Ninth Ward, New Orleans, the neighborhood that was devastated by Hurricane Katrina. The production involved art seminars, educational programs, theater workshops, and conversations with the community (Chan 2011).
What is common across these approaches is the emphasis on the process of art creation as much as the product. Using dialogue, education and participatory creative expression these projects invite people to reflect and take action in their everyday lives. These examples highlight the power of the arts for engaging and empowering people as active citizens in their communities, and offer many lessons for creative data literacy activities.
The Data Mural Process
Based on this critical history, the Popular Data framework, and the context in Brazil, we were inspired to create a "data mural" in Brazil. A data mural, first discussed in June of 2012, begins with data, facilitates a community group through the process of turning that data into a story they want to tell publicly, helps them collaboratively convert the story into a visual design, and allows them to then paint their image as a community mural. This process is intricately tied to the theoretical background we have just laid out. For instance, we begin the process with data about the community on a topic they care about, building on Freire's concept of "Generative Themes." The act of finding a story in data to paint as a mural in public space is an example of Freire's concept of "Praxis" - coming together to act upon the built environment in a critical way leading to further reflection. The collaborative design process builds shared ownership, and the final mural itself is a spectacle that invites viewers to be something akin to Boal's "spect-actors" as they join in the painting.
At a high level, the data mural process has 8 steps: 1. Identify partners and topics
2. Collaboratively identify the goals of the project 3. Collect data related to the goals
4. Hold a story-finding workshop 5. Hold a design workshop 6. Paint the mural
7. Publicly unveil/present the mural
This rough outline was used as the basis for defining the project steps. The following sections link each of these steps to our theoretical background and describe the data mural process in Minas Gerais.
Identifying the Partners and Goals
Once we had narrowed in on producing a data mural with a local group, the Escritorio helped us identify the Plug Minas school in Belo Horizonte as the ideal candidate. Plug Minas (hereafter referred to as "Plug") is a state sponsored school that promotes education through innovative educational methodologies, guided by values like leadership and digital literacy. Acting as a complement to the regular public school system, Plug has approximately 1,300 students aged between 14 and 24 years old. As an alternative school Plug focuses on giving students opportunities based on dialogue, experimentation and collaborative construction of knowledge.
Plug is a unique school in a variety of ways. First off, it is managed by multiple stakeholders - the state, a nonprofit organization and private companies. Secondly, it is made of seven separate mini-schools (called "Nucleos"), each with one or more private companies providing financial and/or methodological resources for the activities. These Nucleos range from circus arts to digital game programming. Despite belonging to the same institution, the Nucleos are relatively autonomous and students within them do not necessarily connect with each other. The central administration (composed of a nonprofit organization and the government) is responsible for the pedagogical guidelines across all the Nucleos. There is a general lack of school identity among Plug’s students, which affects the institution’s connection with the community where it is located (a poor neighborhood in the East side of Belo Horizonte). Despite efforts made by the administration, the surrounding neighborhood is not very aware of the activities developed at the school and does not interact often with the students.
With this context in mind, Plug (represented by Castro) had a number of goals for the data mural, all related to student experiences. They wanted to integrate the youth of all the Nucleos in an activity that created a sense that Plug was one school, not a collection of individual schools on separate topics. In addition, Plug staff was excited to offer opportunities for government to collaborate with youth in novel ways. Plug wanted to learn new educational methodologies that they might be able to utilize with students on an ongoing basis. Plug also saw an opportunity to address the long-standing divide between the school itself and the neighborhood around it.
The researchers (Bhargava & Bhargava), desired to test their hypothesis that this type of arts-based intervention could increase participant data literacy, build and reinforce connections among participants, and act as a catalyst for further conversation about the topic being explored.
The Escritorio (represented by Kadouaki) wanted to facilitate novel research to stimulate innovation in Minas Gerais. More specifically, they wanted to reinforce their existing focus on empowering citizens to use data to create change. Escritorio staff recognized that their open data portal was the beginning, not the end, of the process of building data literacy in their state.
Our various goals were merged into a list of desired outcomes that were agreed to by everyone. We all wanted:
• to paint a mural on the exterior wall of the school
• to build the belief that playing with data to tell a story can be fun
• to connect with a Plug staff member to continue the Data Mural work locally • to make a creative local example of community engagement with data • to improve capacity to read, understand, and synthesize data into insights • to build new connections between Plug students and outside professionals • to build new connections between students in the various Nucleos
The story-finding and design workshops involved almost 20 student participants, the two researchers, three Plug staff, and three Escritorio staff. The 2-day process were held on-site in a large auditorium. Translation for the facilitating researchers, who understood a limited amount of Portuguese, was provided by the staff. Approximately 50 people participated in the mural painting.
Students ranged in age from 16 to 21. In line with their goal of creating more cross-Nucleo connections, Plug staff decided to recruit participants from an existing club that focused on that topic. Students in this club were asking to fill in a short online survey asking just one question – “Why would you like to be part of the data mural process?”. Based on the responses, and their awareness of the particular students involved, Plug staff then selected the participants.
Collecting Data
After meeting remotely a number of times in the months leading up to the on-site activities, the team (the authors of this case-study) decided to do a data mural with the youth that focused on the experience of going through the school. As described above, Plug is a unique public/private partnership within the school system. Students apply for entry to programs to do not exist anywhere else, and highly value the experiences they are exposed to within Plug. This background led the authors to believe this theme would accommodate both the school’s and the students’ interests.
Plug staff collected and created data that could be used to look for stories, including past student surveys about demographics and student experiences. Our intended goal was to allow opportunities for Freire's concepts of "codification" and "conscientization" to develop. We interpret Codification to be the gathering of information to understand one's current context. We interpret Conscientization to be the development of a critical awareness of one's actual situation and needs. Looking at information about the experience of attending the school, with the goal of telling their story to the audience in the surrounding community, would give students ample opportunity to practice these two.
The researchers worked to trim the datasets in a way that focused in on Plug's stated goals, yet at the same time left enough freedom for multiple interesting stories to emerge. This
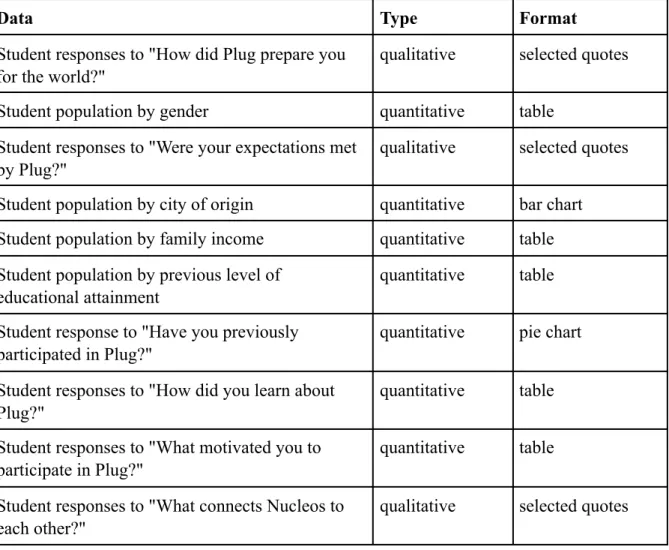
subjective process was done collaboratively with the Plug staff. Students were not engaged in this process primarily due to logistic constraints, mostly attributed to poor internet connectivity, scheduling, and remote collaboration. This process yielded a six page handout (Figure 1) with selected qualitative and quantitative data presented in quotes, tables, bar charts, and pie charts (translated into English and Portuguese). The data included are described in Table 1. Among the qualitative datasets, the quotes to include were selected by the authors based on how much they were about changes in the person caused by experiences at Plug Minas.
!
Figure 1: The data handout given to participants on-site
Table 1: Datasets included in the "Plug Minas data mural handout" used during workshops
Data Type Format
Student responses to "How did Plug prepare you for the world?"
qualitative selected quotes Student population by gender quantitative table
Student responses to "Were your expectations met by Plug?"
qualitative selected quotes Student population by city of origin quantitative bar chart Student population by family income quantitative table Student population by previous level of
educational attainment
quantitative table Student response to "Have you previously
participated in Plug?"
quantitative pie chart Student responses to "How did you learn about
Plug?"
quantitative table Student responses to "What motivated you to
participate in Plug?"
quantitative table Student responses to "What connects Nucleos to
each other?"
The Story-Finding Workshop
The data handout informed the story-finding workshop, which we designed to allow student participants to build the capacity for finding stories in data. This part of the process also focused on our desired outcomes of linking together students from various Nucleos, showing how working with data can be fun, and building their data literacy.
After introductions and some context setting we began by discussing how to find stories in data. Following the Freirian concept of "Generative Themes", we introduced some local data, to link the lived experience of the participants to the literacy being developed. Local partners had previously mentioned that Minas Gerais was a large, and proud, exporter of cheese. Based on this input we gathered a tiny set of official government data on recent levels of cheese exports and used that as the subject of an exercise introducing how to find various types of stories in data. The participants expressed surprise and interest in the data; one student shared a story of his family farm and their cheese producing business. These personal connections opened the door for us to build a relevant definition of data analysis within their context, something missing from most generic web-based digital tools.
Next we introduced the data handout we had created and broke into teams to look for stories that the participants wanted to tell (see Image 2). The groups were structured to include students from different Nucleos at each table. After discussion and brainstorming time the students filled in worksheets that prompted them to write their story down and explain why they thought it was a story worth telling. This worksheet was an attempt to place critical reflective focus on why the story they found was meaningful and relevant, pulling the data off the page and into the real world context. After 40 minutes of small group discussions, each group taped up their two strongest stories on the wall for everyone to see.
Image 2: Students and staff looking for stories in the data handout
With many stories developed, we moved on to a facilitated discussion to reach agreement about the story to use for the mural design. This involved a group discussion about each story presented, collectively developing criteria for choosing a story to use, and writing the final
Students responses to "What is your relationship with the surroundings of the school?"
story out to confirm agreement. The researchers took a strong facilitation role during this process, ensuring each group had a space to speak and advocate, while at the same time guiding the group towards consensus. This resulted in synthesis of a story they all wanted to tell about how students go through a process of transformation while at Plug due to the creative focus, and come out as better people more aware of the world around them. This chosen story offered on an empowering frame that told the surrounding neighborhood that Plug was a special place.
Image 3: Staff and researchers facilitating a discussion to pick the one story to tell
The Visual Design Workshop
With the story written, we began to turn the story into a visual design that we could paint as a mural on a large wall near the school's entrance. The focus was on creating a collaborative design that had shared ownership among all the participants, and introducing fun ways to play with data. This workshop began with an introduction to some of the ways to turn a data-driven story into a visual design. We introduced examples of charts, maps, comic strips, and evocative images; all connected to datasets of various types. This provided a shared language of ways to represent the story they had generated and the qualitative and quantitative data it was based on.
The first activity offered the students a chance to to create "data sculptures" that showcased the data we were working with. In the days leading up to the workshop, we visited a number of local markets and bought wood blocks, rubber bands, glue, and other local craft materials. We introduced the materials and gave students a short amount of time to build something that told part of the data story they had developed (Image 4). This activity was designed to show that working with data can be playful and fun, and was an attempt to invite students who didn't have experience or skill with drawing to be able to create symbols that told the story. In order to translate the abstract story into concrete ideas for visuals, we led a "Word Web" activity. The researchers learned this technique and the “pass around” activity from a community muralist , and applied it to the Data Mural process. A Word Web begins by 3
writing a large abstract word from the story in the middle of a big piece of paper. For instance, this story included the word "melhor" (better) to describe how students come out
Tova Speter of Cambridge, Massachusetts, USA
after attending Plug. We asked students to free-associate and write down other related words that on the same piece of paper (Image 5). This activity leads to a large set of related concepts, many of which are nouns that can easily be represented visually in a design. This helped develop a visual language to tell the data-driven story they had created.
Image 4: Students exploring with craft materials during the data sculpture activity
Image 5: A word web created for the word "transformar" (transform)
To flesh out a visual design, we next led a collaborative sketching "pass around" activity. to build shared ownership of the visual design. We began by giving each participant a piece of paper and a pen and asking them to draw the data-driven story (using the previous activities as inspirations for imagery and narrative). After a minute we interrupted and surprised them by asking them to put their pens down and hand their page to the person on their right. They were not allowed to explain what they had drawn at all. The receiving person had to try to determine what the original author was trying to do and add to it. We repeated this pass-around every minute, until the original author had their paper back (Image 6). This activity creates a structured format that puts helpful constraints around how much drawing each person does. Focusing on the "we" rather than the "me" not only builds group cohesion, but also leads to more engagement in the design process. This activity helps create a sense of freedom in developing visuals, overcoming the feelings that “I can’t draw”. It also builds the ability to translate concepts into images.
Image 6: Students working on their pass-around sketches
To finally synthesize the draft design of a mural, we facilitated a group conversation about the sketches they had all created and how they told the data-driven story (Image 7). We began by prompting students to identify common visual elements of the drawings, or unique elements they thought told the story particularly well. The students focused in on a few keys symbols to represent parts of the story:
• the brain was a powerful symbol for their learning
• a globe centered on Brazil represented how they were from all over Brazil
• a turned on light bulb could represent the quotes about growing into better people • classic icons could represent the various Nucleos (a game controller for video game,
theater masks for the circus arts, etc)
From these elements we created a draft of the mural design that everyone agreed reflected the story and the original data well.
Painting the Mural
With a draft design in hand, we iterated on shape and color to finalize the design. The painting process was an opportunity to focus in on the goals of bringing the Nucleos together, involving the community, and making data fun. School staff invited students across all the Nucleos to join the painting process the next day. A car with an amplifier its roof was sent around the neighborhood to play a recorded announcement that everyone was invited to join the mural painting activity at Plug.
The day of painting itself provided many opportunities to revisit the data and story that led to the design (Image 8). Many of the students that came by to help paint had not been part of the story-finding or design sessions. Students that had been part of those sessions explained their process and reasoning to their fellow students, using the mural design to introduce some of the qualitative and quantitative data they started with.
Image 8: Students and staff working on the mural
To accommodate the large number of people that came over the course of the day to help, we used a large secondary canvas to prompt people to write about the neighborhood (Image 9). This was a deliberate attempt to bring in the residents and have the students think outside the school's walls. This canvas was put on display in the small art gallery in front of the school after the mural was completed.
Image 9: Residents and students painting symbols of the neighborhood on an auxiliary canvas
Image 10: The completed mural
Findings
Existing practice on assessing data literacy in students is underdeveloped, potentially due to the lack of agreement on the core definition (as discussed earlier). Governmental standards on statistical literacy and numeracy haven’t been adapted to embrace data literacy as a new concept (Calzada 2013, Mandinach 2012), and research and documentation that does occur tends to focus on the teacher’s ability to use data to assess students (Means, 2011). A complete survey of the emerging best practices is out of scope for this paper, but there are a variety of examples that informed the approach taken for this project. This is an area where the field of data literacy education needs to mature.
The researchers found little existing practice to build on for evaluation within Plug itself. Existing staff there had attempted to establish a shared model for assessing student growth
within the creative arts-based educational frame. A third-party consultancy brought in attempted to create a quantitative methodology for the school to use, but the various Nucleos did not engage in this process well. Plug was left with a model for evaluation that they had little confidence in, due to perceived structural gaps created by the lack of participation across the school.
Of course, there is a long history of learning assessment outside of this specific context to draw from. Student growth is often measured via quantitative means against a set of learning goals. Pre- and post-surveys are standard qualitative and quantitative instruments for assessing this change over the course of an intervention in learning settings. However, the learning goals vary across data literacy projects, and there is not an agreed-upon set of instruments to draw from.
In creative arts-based settings, formal testing-based assessment mechanisms are not generally relied upon to assess growth and learning. Practitioners of Project-Based Learning offer observational techniques for assessment in situations where learning is seen as a continuous process (Krajcik, 2006). This type of approach lends itself more readily to the Data Mural project. As an example of some of these methodologies in practice, the CityDigits project included pre- and post-surveys, but centered around analysis of student journals, language, and final presentations to assess learning (Williams, 2015).
With these inspirations and limitations in mind, this project separated assessment into the short term and long term timeframes. Unfortunately, logistical constraints on-site prevented us from doing a thorough pre- and post-survey. Instead, informal interviews were used with students and staff the day after the mural was painted to assess short-term outcomes. To look at longer term outcomes, researchers remained in contact with staff on-site and checked in during the months following the data mural process, and again a year after the project was complete. This is less than ideal, but provides significant qualitative data to inspect for findings.
Short Term Outcome: Increased data literacy
The experience of creating the data mural built students' data literacy in various ways. The interviews conducted revealed critical thinking about the data gathering process. When asked what they would change about the process, one student expressed a desire to collect primary data, saying that she wanted to “get data by myself...from the source...maybe [by] interviewing students". Another student recognized and was frustrated with the incompleteness of the data that the school was collecting from and about students. He said "We don’t have data from people that left, how they got independent. We should find these students and validate this information." More importantly, when asked if they learned anything one student responded "It is good to learn how to use information to bring change." This is a critical link being built, from data, to story, to change in the world. Another student interview confirmed this link, when they stated "There are a few information that causes a lot of impact, and these things could be used on the streets. It is a drawing, and it has lots of information."
An important part of data literacy is feeling less intimidated by data. Feeling that you have the power to understand and transform the information into what you want it to be. In terms of accomplishing this outcome, the process was successful. It was also fun! Participants said
that they wished there had been more time for creating the drawings and for collaborative design because they enjoyed those parts of the process. One participant explained that learning how to transform data was unexpected and interesting. Another appreciated being able to actively participate in the process, saying “usually professors say do this, do that. It was nice to have you do it with us, really be a part”.
In addition to the students, the staff felt like the process gave them the tools to use data in new and interesting ways in the future. One staff member said that he’d think twice before preparing a PowerPoint presentation in the future, and another said that he found the methodology easy to teach and to use, and hoped to use the data mural process with other groups.
Short Term Outcome: Increased connection between Nucleos
The inclusive process reinforced the connections between Nucleos, helping to build a stronger concept of Plug as one unit. After the event one teacher let us know that "For the first time I feel that this drawing, with all these Nucleos pointing to the plug, feels like one unit. Not always do they feel like they belong to this plug." One student said that it was his first time having an opportunity to work with students from other Nucleos. In addition, during the entire process students from a media-centered Nucleo were filming. They created a 2 minute video documenting the entire project. They intrinsically became involved as the video itself became one of the main outputs of the project, documenting the collaboration that led to the mural design . 4
Short Term Outcome: Connections to the neighborhood
Participants were hopeful that the mural would connect Plug in new and stronger ways to the surrounding neighborhood. One student suggested "People from outside don’t know what happens here. Now that people see a mural, they will see what happens inside of here. People’s curiosity will want to know what happens here. People don’t go to the website." Community members were invited to enter the Plug Minas campus to help with the painting and some families did come to help. They listened to the music that students had set up. Some painted ground-level sections of the design and others who did not paint the wall contributed to the collaborative painting on a large canvas on the ground. However in the short term the process only actively connected a small slice of the community to the Plug. The mural design did not include specific commentary about Plug’s connections to the community immediately surrounding the school. A teacher suggested that "Maybe there is an opportunity to re-use the process. Maybe somewhere else outside of Plug but inside the community.” There was also discussion of inviting community members in over time to look at the mural or using a photo of the mural to explain to people in accessible language what it is that Plug is trying to do.
In conversations following the painting, participants felt that the image was a good tool for starting conversations about what the school does. They felt that even if all parts of the image were not immediately understandable, they would raise good questions and initiate valuable
See https://www.youtube.com/watch?v=If-2xwn_jIY and https://www.youtube.com/watch?v=r_9Z1C5Zeiw. 4
discussions that would not have started if the school had shared information in the form of numbers instead of images.
Short Term Outcome: Interest in the data mural methodology
The arts approach appealed to participants in a way that simply looking at a spreadsheet never does, to the point where they described it as "play." When asked if any of the process would be useful in other parts of their lives, one student replied "Working with data with arts – is very interesting… to turn the data into art. " Another responded to the question of if they learned anything by saying "I’ve never had this experience to play with data and art. And data can be translated into art."
Participants highlighted our use of relatable local data as particularly memorable. When asked if they learned anything, one student remembered that we had shared information about cheese production in each Brazilian state and responded "the part with the cheese was really interesting". Another let us know "at snack time they were talking, and they couldn’t imagine learning about geography with cheese… and trying to transform it into the mural."
Longer Term Outcome: Reducing skipped classes
This example comes from the "Oi Kabum!" Nucleo, which focuses on technical courses in various types of media production. A teacher in that Nucleo, André Mintz, had participated in our data mural workshops. The Oi Kabum! students had noticed that some of their colleagues were skipping classes, but didn’t leave school. Many would often relax on sofas at the school entrance instead of going to class. They decided to gather some data to show the scope of this problem. Using observation as their data gathering mechanism, the students counted 37 of their colleagues at the sofa area per hour. To share this information, they created a unique visual display of the information and attached it to the sofa itself for a week.
These students realized that data could be a powerful tool to change their colleagues' behaviors when presented in a familiar and appropriate language. At it's core, this duplicated the methodology and goals of our data mural process. This example strongly demonstrates increased data literacy. They identified their goal (reducing skipped classes), targeted their audience (students on the couches), gathered information (via observation), analyzed it to find a strong story (the number of students on the couch per hour), and presented it in a creative way (on the couch itself) to try to accomplish their goal. The students used their newly acquired ability to "speak" data to create a compelling visual themselves, which was more likely to be acknowledged and respected by the target audience than a teacher wagging their finger at them. They understood data could be turned into a simple story to engage their colleagues in a discussion about changing their behavior.
Longer Term Outcome: Telling a Nucleo's story
Students in the youth entrepreneurship Nucleo ("Empreendedorismo Juvenil") were inspired to replicate our process for an assignment that focused on having students make presentations about the identity of their Nucleo. They had about three hours to discuss their own thoughts about the Nucleo they were a part of. After a discussion they drew their thoughts on posters which were presented to the other groups.
These students critically reflected on their experience as students, just as we had done in our mural workshops, and thought about the different perceptions of other students. Different posters they created expressed similar ideas in different ways. The activity was so successful that it has now become an annual event. As the entrepreneurship Nucleo is the only without a specific artistic focus, the posters have become a strong symbol of their membership in the Plug community.
Longer Term Outcome: Aggregating musical tastes
Returning to the Oi Kabum! students, in another projects they collected data from their fellow students about their preferred style of music. With the data in hand, they created a musical experience (a "sonification") to share back the results with everyone. They picked a song to represent each style of music and then created a system to play all of those songs back at once, mapping popularity to volume. The more people liked a particular song, the louder it would play.
This creative presentation of the data shows a strong internalization of the topics and approaches we introduced. Students combined our playful approach to data with their Nucleo's topic (media production). They created a fun experience that told an audio story about the variety of musical tastes to any listener.
Discussion
We found that the Data Mural process increased students’ comfort with data, created a sustained interest from students in using data to tell stories in creative ways, and reinforced connections across the Nucleos. The use of playful, relatable data resonated with the participants and created interest in a traditionally dry topic.
The arts-based invitation created interest among students in using data in the future. The examples of data-driven arts at Plug following the data mural occurred well after completion of the data mural, and included students who didn’t participate in the initial mural creation. This is a significant sign that a nascent data-informed culture is building in the school. The experiences of transforming the data into a story and then into a visual design have been transferred to other youth in the school (either through the teachers, the students, or the mural itself). Seeing students transfer this knowledge into new contexts is a strong suggestion that they have internalized the processes and thinking.
Conclusions
As tools and approaches for building data literacy grow we must remember to think outside the digital world for inspirations and approaches. In this case study we offer an example of how to use the arts to invite a non-data-literate population to build their literacy by doing engaging hands-on activities. Our unique team of government, academia, and school staff worked together to accomplish the shared goals. We have described our process of constructing a series of arts activities informed by the pedagogies of Freire, Piaget and Vygotsky, and documented how we used these activities in a relevant way for students in Brazil. Through observation and interview, we showed that participants in the Data Mural process demonstrated increased data literacy, while at the same time having fun! The students
used creative tools to turn data into meaningful stories about their identity. Plug students and staff also walked away with new connections across the Nucleos. While we don't have evidence of sustained new connections between the school and the neighborhood it is based in, the mural itself lives as a statement to the world of how students grow and learn while at Plug. We saw longer-term interest within the school after the project was completed, supporting the idea that this type of data literacy initiative was appropriate and contextually relevant for this audience. We look forward to creating other arts-based data literacy initiatives inspired by our learnings from this project. To date, more than a dozen Data Murals have been created across the world, and the component activities are being used and iterated on by numerous collaborators . 5
References
Bhargava, R. (2013, November 18). Towards a Concept of Popular Data. Retrieved from https:// civic.mit.edu/blog/rahulb/towards-a-concept-of-popular-data
Bhargava, R., & D’Ignazio, C. (2015). Designing Tools and Activities for Data Literacy Learners. Presented at the Data Literacy Workshop at WebScience 2015, Oxford, UK.
Boal, A. (1993). Theatre of the Oppressed. (C. A. McBride, Trans.). New York: Theatre Communications Group.
Calzada Prado, J., & Marzal, M. Á. (2013). Incorporating Data Literacy into Information Literacy
Programs: Core Competencies and Contents. Libri, 63(2)
Chan, P. (2011). Waiting for Godot in New Orleans: A Field Guide. Badlands Unlimited.
Cockcroft, E. S. & Barnet-Sánchez, H. (Eds.). (1993). Signs from the heart: California Chicano
murals (University of New Mexico press pbk. ed.). Venice, Calif. : Albuquerque: Social and
Public Art Resource Center ; University of New Mexico Press.
Cohen-Cruz, J., & Schutzman, M. (Eds.). (2006). A Boal companion: dialogues on theatre and
cultural politics. New York: Routledge.
Deahl, E. S. (2014). Better the Data You Know: Developing Youth Data Literacy in Schools and
Informal Learning Environments. Unpublished Thesis, Massachusetts Institute of Technology.
Davies, T. G., & Bawa, Z. A. (2012). The Promises and Perils of Open Government Data (OGD). The
Journal of Community Informatics, 8(2).
Dasgupta, S. (2012). Learning with Data: A toolkit to democratize the computational exploration of
data. Unpublished Thesis, Massachusetts Institute of Technology.
Duhigg, C. (2012, February 16). How Companies Learn Your Secrets. The New York Times. Retrieved from http://www.nytimes.com/2012/02/19/magazine/shopping-habits.html
Freire, P. (1968). Pedagogy of the Oppressed.
Gangadharan, S. P. (2012). Digital inclusion and data profiling. First Monday, 17(5).
Goldstein, B., & Dyson, L. (Eds.). (2013). Beyond transparency: open data and the future of civic
innovation. San Francisco: Code for America Press.
Gurstein, M. B. (2011). Open data: Empowering the empowered or effective data use for everyone?
First Monday, 16(2).
See http://datamurals.org for more details. 5
Harris, J. (2012, September). Data Is Useless Without the Skills to Analyze It. Retrieved from https:// hbr.org/2012/09/data-is-useless-without-the-skills
Krajcik, J., & Blumenfield, P. (2006). Project-Based Learning. In The Cambridge Handbook of the Learning Sciences. Cambridge University Press.
Mandinach, E. B., & Gummer, E. S. (2012). Navigating the landscape of data literacy: It IS complex. WestEd/Education Northwest.
Maycotte, H. O. (2014, October). Data Literacy -- What It Is And Why None of Us Have It. Retrieved from http://www.forbes.com/sites/homaycotte/2014/10/28/data-literacy-what-it-is-and-why-none-of-us-have-it/
Means, B., Chen, E., DeBarger, A., & Padilla, C. (2011). Teachers’ Ability to Use Data to Inform Instruction: Challenges and Supports. Office of Planning, Evaluation and Policy Development, US Department of Education.
McGinnes, S., & Elandy, K. M. (2012). Unintended Behavioural Consequences of Publishing Performance Data: Is More Always Better? The Journal of Community Informatics, 8(2). Patil, T. H. D. J. (2012, October). Data Scientist: The Sexiest Job of the 21st Century. Retrieved from
https://hbr.org/2012/10/data-scientist-the-sexiest-job-of-the-21st-century
Philip, T. M., Schuler-Brown, S., & Way, W. (2013). A Framework for Learning About Big Data with Mobile Technologies for Democratic Participation: Possibilities, Limitations, and Unanticipated Obstacles. Technology, Knowledge and Learning, 18(3), 103–120.
Piaget, J. (1952). The origins of intelligence in children (Vol. 8, No. 5). New York: International Universities Press.
Raman, N. V. (2012). Collecting data in Chennai City and the limits of openness. The Journal of
Community Informatics, 8(2).
Rochfort, D. (1998). Mexican Muralists: Orozco, Rivera, Siqueiros. San Francisco: Chronicle Books. Rostron, A. (2013). The Mugshot Industry: Freedom of Speech, Rights of Publicity, and the
Controversy Sparked by an Unusual New Type of Business. Washington University Law
Review, 90(4).
Schield, M. (2004). Information literacy, statistical literacy and data literacy. IASSIST Quarterly, 28(2/3), 6–11.
School of Data. (2013). School of Data. Retrieved March 1, 2016 from http://schoolofdata.org/
Schutt, Rachel. (2013). Taking a Chance in the Classroom: Embracing the Ambiguity and Potential of Data Science. CHANCE 26, 4 (November 2013), 46–51.
Sommer, D. (2014). The Work of Art in the World: Civic Agency and Public Humanities. Durham: Duke University Press Books.
Tygel, A., & Kirsch, R. (2015). Contributions of Paulo Freire for a critical data literacy. Presented at the Data Literacy Workshop at WebScience 2015, Oxford, UK.
Vygotsky, L. (1980). Mind in society: The development of higher psychological processes. Harvard university press.
Williams, S., Deahl, E., Rubel, L., & Lim, V. (2015). City Digits: Local Lotto: Developing Youth Data Literacy by Investigating the Lottery. Journal of Digital and Media Literacy.