HAL Id: hal-00803784
https://hal-polytechnique.archives-ouvertes.fr/hal-00803784
Submitted on 17 Apr 2014
HAL is a multi-disciplinary open access
archive for the deposit and dissemination of
sci-entific research documents, whether they are
pub-lished or not. The documents may come from
teaching and research institutions in France or
abroad, or from public or private research centers.
L’archive ouverte pluridisciplinaire HAL, est
destinée au dépôt et à la diffusion de documents
scientifiques de niveau recherche, publiés ou non,
émanant des établissements d’enseignement et de
recherche français ou étrangers, des laboratoires
publics ou privés.
Measurement of circular dichroism dynamics in a
nanosecond temperature-jump experiment
Mai-Thu Khuc, Lucille Mendonça, S. Sharma, M. Volk, Xavier Solinas,
François Hache
To cite this version:
Mai-Thu Khuc, Lucille Mendonça, S. Sharma, M. Volk, Xavier Solinas, et al.. Measurement of circular
dichroism dynamics in a nanosecond temperature-jump experiment. Review of Scientific Instruments,
American Institute of Physics, 2011, 82 (5), �10.1063/1.3592331�. �hal-00803784�
Measurement of circular dichroism dynamics in a nanosecond
temperature-jump experiment
Mai-Thu Khuc,1Lucille Mendonça,1Sapna Sharma,2Xavier Solinas,1Martin Volk,2
and François Hache1,a)
1Laboratoire d’Optique et Biosciences, Ecole Polytechnique/CNRS/INSERM, 91128 Palaiseau, France
2Department of Chemistry and Surface Science Research Centre, University of Liverpool, Liverpool L69 3BX,
United Kingdom
(Received 27 January 2011; accepted 28 April 2011; published online 27 May 2011)
The use of a fast temperature jump (T-jump) is a very powerful experiment aiming at studying protein denaturation dynamics. However, probing the secondary structure is a difficult challenge and rarely yields quantitative values. We present the technical implementation of far-UV circular dichroism in a nanosecond T-jump experiment and show that this experiment allows us to follow quantitatively the change in the helical fraction of a poly(glutamic acid) peptide during its thermal denaturation with 12 ns time resolution. © 2011 American Institute of Physics. [doi:10.1063/1.3592331]
I. INTRODUCTION
The use of a temperature jump (T-jump) is a very popular technique aiming at investigating rapid dynamics of unfolding processes in peptides or proteins.1The principle of
this technique is quite simple: The water solvent is heated up with a nanosecond laser pulse by a few degrees, modifying instantaneously the thermodynamic conditions experienced by the protein. In order to adapt to these new conditions, proteins undergo conformational changes, usually a denatu-ration process. Thanks to the instantaneous temperature rise, one can follow these unfolding processes in time with very good time resolution, allowing very fundamental steps to be unraveled.2 However, optical signals capable of probing the conformation of molecules are not so common and much work has been devoted to this issue. Two main ideas have been pursued. First, it is possible to use fluorescence tech-niques on the condition that it is possible to introduce “tricks” to render fluorescence measurements sensitive to the protein conformation. Such tricks include fluorescence quenching by adjacent chromophores3 or fluorescence transfer such as
FRET.4Second, it is well known that the IR-Amide I’ band is
sensitive to the secondary structure of proteins.5This feature
has been extensively studied in conjunction with T-jumps to investigate unfolding dynamics of model polypeptides6–8
or small proteins.9,10 However, these techniques suffer from
a lack of quantitative information. For example, due to the width of the optical transitions in the IR, it is difficult to estimate the variation of the α-helix content in a polypeptide from the variation of absorption.11 Other techniques have been implemented, such as Optical Rotatory Dispersion12 or UV resonance Raman.13 This latter method can yield quan-titative structural characterization14,15 but it is not well fitted
for time-resolved acquisitions. On the other hand, circular dichroism (CD) is known to present characteristic features in the far UV which can be confidently assigned to secondary structures in proteins.16,17This is particularly true for the CD
a)Author to whom correspondence should be addressed. Electronic mail:
francois.hache@polytechnique.edu.
feature which shows up at 220 nm and which is commonly used to estimate the α-helical content of proteins. Another advantage of CD is that measurements can be carried out in water instead of heavy water, which makes the experiment more accessible and closer to physiological conditions. In this article, we present an experimental set-up which combines a T-jump experiment with UV-CD detection and allows us to obtain quantitative information on the ultra-rapid dynamics in denaturation processes. In order to achieve a precision sufficient to observe changes in the CD despite the smallness of such signals, we had to address several technical points that will be presented in this article. First, we had to set-up synchronized laser sources in the IR and in the UV. Second, we had to characterize the temperature jump accessible from our experiment. Then, the detection scheme to access CD has been thoroughly investigated and several methods were tested. Finally, results on the temperature-induced unfolding of a poly(glutamic acid) sample will be presented. To the best of our knowledge, this is the first demonstration of probing of a T-jump-induced denaturation process by time-resolved circular dichroism in the far UV.
II. EXPERIMENTAL TECHNIQUES A. Laser sources
Two laser sources are needed to carry out a CD/T-jump experiment. On the one hand, one needs a nanosecond IR source to induce the temperature jump, hereafter called the “pump.” On the other hand, a UV source compatible with the detection of the CD is necessary (the “probe”). Finally, elec-tronic synchronization of the two sources and of the various detection apparatus is necessary.
Nanosecond pump sources usually rely on Nd:YAG lasers which can deliver intense nanosecond pulses. In order to heat up water with nanosecond pulses, two strategies can be employed. One can use indirect heating where a dye10
excited by the second harmonic of the laser serves as heat transducer. Alternatively, one can directly heat the water solvent using IR laser pulses. The latter method yields less
054302-2 Khucet al. Rev. Sci. Instrum. 82, 054302 (2011) cavitation problems,8 but demands a nanosecond IR source.
Most T-jump experiments based on an IR probe necessitate the use of deuterated water and require IR pulses at 1.9 µm. Such is not the case here, where we deal with a UV probe and our samples are dissolved in H2O. In that case, the IR
wavelength necessary to heat up water is about 1.5 µm, which corresponds to the excitation of the ν1+ν3 overtone
mode of H2O. Absorption at this wavelength is 32 cm−1, a
weak absorption which allows uniform heating of the sample. Our set-up is based on a nanosecond Nd:YAG laser operating at 30 Hz (GCR4, Spectra-Physics). In order to reach IR wavelengths, we use a commercial nanosecond OPO (GWU, Spectra-Physics) which delivers up to 8 mJ pulses at 1.454 µm (idler) with a duration of 5 ns. Because we did not have an IR spectrometer, we took advantage of the fact that the OPO delivers two complementary wavelengths (signal and idler). Precisely tuning the signal wavelength to 839 nm ensures that the idler wavelength is tuned to 1.454 µm.
The probe pulse must be tunable in the far UV, especially around 220 nm where the ratio CD/absorption is the greatest. We use a sub-picosecond source that we have developed,18 based on a 1 kHz amplified Titanium-Sapphire system fol-lowed by several stages of BBO-based optical parametric am-plification and frequency mixing. This source delivers 40 nJ pulses tunable between 220 and 350 nm. It would be interest-ing to go to shorter wavelengths, especially in the 205–220 nm range to better probe the helicity of the samples. This would be easily feasible by frequency quadrupling an amplified Ti-Sapphire laser tunable between 820 and 880 nm. Note, how-ever, that experiments are more difficult further in the UV due to the very large absorption of peptides and proteins in this region. Nevertheless, going towards 200 nm is very appealing and work in this direction will be undertaken in the future.
B. Experimental set-up
The experimental set-up corresponds to a classical pump-probe experiment. Both pump and pump-probe pulses are focused onto the sample with 100 mm focal length lenses. At the fo-cus, the pump diameter is about 500 µm and the probe diam-eter 80 µm, ensuring that the probe sees a transversely uni-form temperature profile. Precise overlap of the two beams is achieved with a 200 µm pinhole placed at the sample position. In order to measure CD, the probe beam is sent through a polarizer and a longitudinal KD*P Pockels cell (Gsänger LM8) whose axes are oriented at 45◦with respect to the
inci-dent polarization.19We apply an alternate voltage (±600 V) to
the Pockels cell to transform the linear probe polarization into right or left circular polarization. After a preliminary align-ment of the Pockels cell with the help of the isogyre pattern (Maltese cross), fine alignment as well as adjustment of the applied voltage is carried out by inserting a quarter-waveplate and a crossed analyzer after the Pockels cell and optimizing the contrast between the two circular polarizations. The trans-mitted probe intensity is measured with a photomultiplier tube (PMT, Electron Tubes 9402) and a Boxcar analyzer (Stanford SR250). In order to reduce the effects of laser fluctuations, we carry out normalization of the signal by a reference signal.
The signals are processed with a personal computer which controls all the experimental parameters.
The experiment has been carried out with a poly(glutamic acid) (PGA) sample. The peptide was purchased from Sigma-Aldrich and dissolved in water without further purification. The molar weight in this sample is 64 000, correspond-ing to about 500 residues per peptide. The concentration is 20 mg/mL, which corresponds to 0.155 M in terms of glu-tamic acid residues.
The pH needs to be carefully controlled. Indeed, depend-ing on the pH, PGA can be completely folded into α-helices or display a random coil structure.20–22 Because we want to
have a sample whose conformation changes with temperature, we chose a pH of 4.8, which was adjusted by careful addition of acetic acid and sodium acetate (Sigma-Aldrich). The final acetate concentration is about 0.3 M. As will be seen later, at this pH, absorption and circular dichroism display a strong temperature dependence which is a signature of a change in the helical content of the sample. The peptide is placed into a 100 µm path length quartz cuvette (Hellma). This cell can be thermalized by external water circulation. Furthermore, in order to avoid cumulative effects due to the pump, the cell is continuously rotated (300 rpm).
III. ELECTRONIC SYNCHRONIZATION AND DETECTION SCHEMES
A. Electronic synchronization
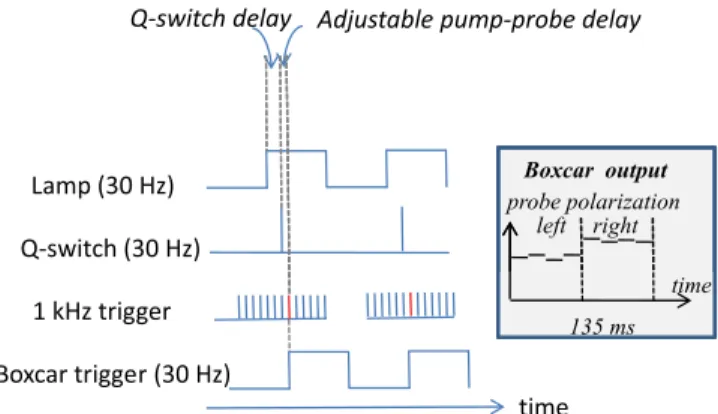
A major issue of this experimental set-up is the electronic synchronization of the lasers and of the detection devices. We have therefore developed sophisticated synchronization electronics based on a complex programmable logic device (CPLD – Lattice). We have designed an electronic board whose behavior is described in VHDL, using the 82 MHz Titanium-Sapphire laser oscillator as external clock. The parameters for the timing of the various signals are dynami-cally transferred through the RS232 interface of the personal computer which controls the acquisition processes and data analysis. Five triggering signals are generated, which are depicted in Fig.1. First, two 30 Hz signals are used to trigger the Nd:YAG laser. The first one triggers the laser flash lamps,
probe polarization left right
Boxcar output
time 135 ms
FIG. 1. (Color online) Triggering signals generated by the synchronization electronics. Two variable delays are generated: the Q-switch delay and the adjustable pump-probe delay. The inset schematically describes the Boxcar output signal when the Pockels cell voltage is modulated at 3.7 Hz.
whereas the second one triggers the Q-switch. The delay between these two pulses is chosen equal to 210 µs for an optimum functioning of the laser. Then, a 1 kHz trigger is provided to the Titanium-Sapphire amplifier. The delay be-tween the Q-switch trigger and this 1 kHz signal is the crucial point of the device. It allows us to vary the pump-probe delay for the experiment up to 1 ms. Longer delays can be easily accessed thanks to the probe pulse train where pulses are separated by 1 ms. As depicted in Fig.1, we can pick out of the 1 kHz probe pulse train a 30 Hz pulse train impinging on the sample with a fixed delay that we can chose negative or positive with a resolution of 12.1 ns. Two other triggers are generated by the synchronization electronics. First, we create a 30 Hz signal in perfect synchronization with the probe pulse train relevant for the experiment. This signal is used to trigger the boxcar gate for signal detection. Second, we divide the 30 Hz signal by 8 in order to obtain a 3.7 Hz signal that we use to modulate the Pockels cell voltage (not shown in Fig. 1). As a result, four probe pulses have right circular polarization followed by four pulses with a left polarization. The output of the boxcar is schematically depicted in the inset of Fig.1.
B. Measurement of the circular dichroism
Once the polarization-modulated probe beam passes through the sample, its intensity becomes modulated due to the CD:
I±=K e−(α0±δα)L ≈K e−α0L[1 ∓ δα L]. (1) In this equation, α0is the mean absorption coefficient, L
the path length, and δα describes the CD: absorption coeffi-cient for a left (resp. right) polarization is α0+δα(resp. α0
– δα) and the CD is equal to 2δαL. K is a constant. From this expression, one obtains:
CD = I−−I+
(I++I−)/2
. (2)
The (I++I−)/2 term is directly accessible through the
PMT signal. The problem is to measure I−−I+. We have
developed three complementary manners to measure this in-tensity difference. The first idea is to use a lock-in ampli-fier (LI) locked on the Pockels cell modulation. This is the most straightforward technique and from the LI signal, one measures CD as 2.2 LI/PMT (the 2.2 factor being due to the square modulation imposed on the signal). However, due to the weakness of the modulation and the small modulation fre-quency (3.7 Hz), sorting out the signal from noise requires extensive averaging. Another possibility is to measure I+and I−independently and to calculate the difference with the
com-puter after averaging. Identification of these two intensities is made possible by sending the 3.7 Hz modulation signal to the acquisition card. Finally, we have also tried to perform Fast Fourier Transform of a series of 4096 data. The resulting spectrum clearly displays a peak corresponding to the modu-lation frequency, whose amplitude gives the magnitude of the CD.
We have implemented these three techniques in the same software and performed simultaneous measurements
with the three techniques. For a given acquisition time, the three techniques yield very similar results (see inset of Fig.8where the raw data obtained with the three techniques are displayed). Having the three results together allows us (i) to confirm the reality of the signal and (ii) to improve our signal-to-noise ratio.
Before concluding this section, we would like to address another issue. In some previous works, we had implemented a very original manner to measure time-resolved CD by utilizing a linearly polarized probe and measuring the pump-induced ellipticity with a Babinet-Soleil compensator.23 We
have tried to implement this technique here, but it turned out to be impossible. The reason for this is that in this latter technique, some artifacts can occur in presence of birefrin-gence. Usually, birefringence is not pump sensitive and does not preclude using this technique. However, in our T-jump experiment, it appears that the very rapid temperature change in the cell provokes a transient birefringent feature on the few microsecond timescale which completely masks the CD sig-nals. The polarization modulation technique that we employ here has the great advantage that it is insensitive to sample birefringence to a large extent. This insensitivity is due to the absence of any polarization device between the sample and the detection.19As soon as a polarizer or any other polarizing device is introduced, birefringence becomes a crucial issue. IV. TEMPERATURE JUMP MEASUREMENTS
A. Simulation of the temperature jump
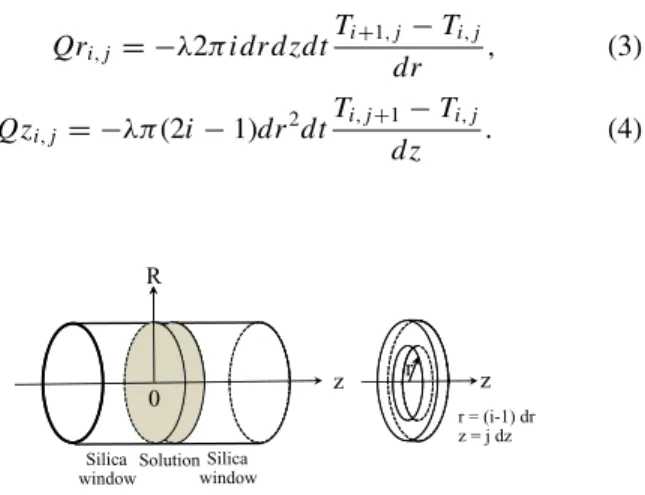
In order to be able to predict and understand the evo-lution of temperature inside our cell, we have performed a MATLABsimulation based on simple heat transfer theory fol-lowing Ref.24. The principle of the calculation is to divide our cell in small ring cells indexed by (i,j) for the r and z directions, where z corresponds to the direction of the pump beam (see Fig.2), and compute the thermal flux between cells and the temperature T of the cell at each calculation step.
Using the Fourier law: j = −λ∇ T = −λ(∂ T /∂r er
+∂T /∂ zez), where j is the thermal flux and λ is the heat
con-ductivity, we can write the heat energy exchanged during time interval dt along the r and z directions between cells i and
i +1 and between cells j and j + 1, respectively, as
Qri, j = −λ2π i dr d zdt Ti +1, j−Ti, j dr , (3) Qzi, j = −λπ(2i − 1)dr2dt Ti, j +1−Ti, j d z . (4) R r 0 z Silica window Silica window Solution z r r = (i-1) dr z = j dz
FIG. 2. Sketch of the elementary cell used in the temperature jump simulation.
054302-4 Khucet al. Rev. Sci. Instrum. 82, 054302 (2011) 22 23 24 25 p erature (°C) 22 23 24 25 0µs 10µs 50µs 100µs 200µs (a) (b) 1 10 100 1000 10000 100000 20 21 Tem p Time (µ s) 500 550 600 20 21 z (µm) 500µs 750µs 900µs
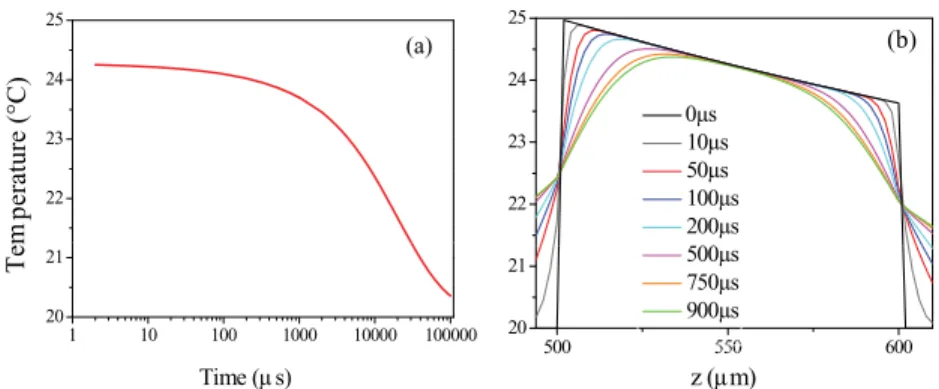
FIG. 3. (Color online) (a) Evolution of the mean temperature with time for a 100 µm pathlength cell with silica windows, assuming an instantaneous initial T-jump of 5◦C in the first layer of the sample from an initial temperature of 20◦C. The temperature remains constant for about 100 µs and cools on the time
scale of 10 ms. (b) Temperature profile in the sample (and adjacent window volume) along the beam path for different delays after the T-jump.
The temperature after a time dt can be written using the first principle of thermodynamics applied to a cell (i,j) :
Ti, j =Ti, j+
Qri −1, j+Qzi, j −1−Qri, j−Qzi, j
Cπ(2i − 1)dr2d z , (5)
where C is the volumetric heat capacity of the material of cell (i,j). In our calculations, we used the thermal parameters of our cell: λwater = 0.5984 W K−1m−1, Cwater = 4.136
× 106 J m−3K−1, λ
silica = 1.4 W K−1m−1, Csilica =1.408
×106J m−3K−1. When the heat transfer takes place between
a water cell and a silica one, we use the average value of λ.We have considered a 500 µm pump beam, a 100 µm path length cuvette, 0.5 mm of silica for the cuvette windows and a 5◦C T-jump starting at 20◦C. Absorption of the pump light
in water was also taken into account (α = 32 cm−1).
In order to see if the temperature remains constant on a long enough time scale for the peptide dynamics to be seen after a pump pulse, we have performed a calculation for 0.1 s following a single pump pulse. The results are shown in Fig.3(a). The average temperature along the z axis in the so-lution decreases only slightly in the first millisecond, whereas cooling takes place between 1 and 100 ms. Figure3(b) dis-plays the temperature profile within the cell. As expected, cooling of the water is due to heat exchange with the cell win-dow. We see that this cooling effect is efficient on timescales larger than 100 µs, a very long time compared to our peptide dynamics (see below).
Finally, we have studied the cumulative heating of the solution due to the 30 Hz pump repetition rate. Calculating the time evolution of the temperature for 3 s with a pump period of 30 ms, we found that the background temperature in the middle of the cell can increase by more than 5◦after 2
s of irradiation with the pump beam. To avoid this cumulative heating up of the solution, we continuously rotate the cuvette as explained in Sec.II B.
B. Temperature jump measurement
Measuring in situ the temperature increase of the sam-ple is a crucial issue for this experiment. Such a measurement is usually obtained by monitoring the absorption change of water in the infrared.2,6–9However, we do not have this
pos-sibility here since we work with a probe delivering pulses in the visible or in the UV. We have therefore developed another technique allowing the precise measurement of the tempera-ture jump and its dynamics in our experimental set-up. Similar techniques have been proposed in Refs.25and26.
Because absorption in the visible or the UV is usually not very sensitive to temperature, we have to use some interme-diate temperature-dependent process. One such process is the strong dependence of some buffers on temperature. This ef-fect, which is a source of problems for chemists, is very well documented and we have chosen the Tris-HCl buffer. At a pH of 7.2 at room temperature, the pH changes by –0.028/◦C
with temperature.27 Such pH changes are easily observable
with colored pH indicators. In our case, we expect the pH to change from 7.2 to 6.7 when temperature increases from 21 to 41◦C. We have therefore utilized the pH indicator
Bromothy-mol Blue, whose pH sensitivity is in the 6.2–8.2 range. We use a saturated solution of Bromothymol Blue in TrisHCl buffer (100 mM, pH = 7.2). The absorption spectra of the solution as a function of the temperature are displayed in Fig.4. The temperature dependence is very strong and we have tuned our probe wavelength to 623 nm to monitor the T-jump dynamics.
T
Absorbance
Wavelength (nm)
FIG. 4. (Color online) Absorption spectrum of a saturated solution of Bro-mothymol Blue/Tris HCl mixture 100 µm pathlength cell as a function of temperature. The temperature ranges from 22 to 41◦C, with the arrow
in-dicating increasing temperatures. The inset shows the chemical structure of Bromothymol Blue.
T
(°C) T
(°C)
time (µ s) time (ms)
FIG. 5. (Color online) Short and long timescale evolution of the temperature in a rotating 100 µm pathlength silica cell following an IR laser pulse induced T-jump, measured using the transient absorbance of a saturated solution of Bromothymol Blue/Tris HCl at 623 nm, calibrated using the spectra shown in Fig.4. Note that the T-jump amplitude is lower on the left-hand side figure because of a lower pump power.
At this wavelength, we measure for the absorbance changes 1 A623 d A623 d T =(−0.0169 ± 0.0025)T / ◦ C. (6)
We have performed T-jump experiments on the solu-tion of Bromothymol Blue in TrisHCl buffer at 20◦C and
followed in time the change in transmission of the solution at 623 nm and deduced the temperature increase. The pump conditions corresponded to the conditions of the CD exper-iment described below with a pump energy of 8 mJ/pulse and a 100 µm path length quartz cell continuously rotated at 300 rpm. Figure5shows the temperature change as a function of time for two relevant timescales. One observes that the temperature jump remains constant on the time scale of a few hundred microseconds, ensuring that the dynamics that we can observe on this timescale come from the peptide and not from the cooling of the water solvent. On the other hand, the temperature increase completely relaxes between two pump pulses separated by 33 ms, discarding any cumulative effect. This feature confirms the efficiency of rotating the cell in our experiment. Finally, we measure a maximum temperature jump of 5◦C with our experimental conditions, a convenient value for carrying out unfolding experiments.
We would like to stress two interesting characteristics of our set-up. We utilize a silica cell instead of a CaF2 cell,
as usually used in IR-detected T-jump experiments, since we have no need for infrared transparence. Because silica has a lower heat conductivity, we observe a slower decay of the water temperature. As seen in Fig. 5, the temperature re-mains constant over more than 800 µs, much longer than the 200 µs timescale observed for cells of comparable path-length with CaF2 windows.8 This can be an advantage for
measuring longer processes. Furthermore, we did not observe any cavitation effects, a convenient feature for experiments. We think that this is a consequence of the direct heating (using IR laser pulses), which allows measurements in the absence of dye molecules which tend to aggregate and act as nucleation sites for cavitation,8 and of the smooth pump beam profile employed here, which prevents the occurrence of hot spots leading to the onset of cavitation. Under these
conditions, cavitation can be avoided, even at elevated base temperatures.6–8,24,28
V. T-JUMP EXPERIMENT ON POLY(GLUTAMIC ACID) We present in this section the results we have obtained for poly(glutamic acid) (PGA). Prior to the dynamics mea-surements, we carried out steady-state absorption and CD measurements as a function of temperature in order to choose the best starting conditions and to be able to quantify our dynamic measurements. Note that, as reported in Ref.29, we observed full reversibility of peptide folding upon re-cooling. The T-jump experiments with IR detection described below also show that PGA returns to the original state within 100 ms of sample cooling.
A. Steady-state temperature-dependent absorption and CD measurements
Figure6shows the absorption spectra of PGA for 17 tem-peratures ranging from 11 to 52◦C. The interesting feature is
enlarged in the inset and one clearly observes a decrease of
1 0.50 0.51 0.52 Ab so rb an ce 0 10 20 30 40 50 60 0.49 Ab Temperature (°C) Absorbance T from 11 to 45 °C
T
200 Wavelength (nm) 300 250FIG. 6. (Color online) UV absorption spectrum of PGA (20 mg/mL, pH 4.8, 100 µm pathlength) for different temperatures ranging from 11 to 52◦C. The
inset displays the dependence of the absorbance at λ = 225 nm on tempera-ture.
054302-6 Khucet al. Rev. Sci. Instrum. 82, 054302 (2011) 0 5 40 80 h ro is m 0.01 0.02 C ircular dichrois m 0.2 0.3 0.4 0.5 Helical fraction f H 200 250 300 -40 0 Ci rc u la r di ch Wavelength (nm) 20 30 40 50 Temperature (°C) C
FIG. 7. (Color online) Circular dichroism (= 2δαL) in absolute values (dots, left scale) and the corresponding helical fraction [squares, right scale, calcu-lated as described in Eq.(8)] of PGA (20 mg/ml, pH 4.8, 100 µ pathlength) measured at 225 nm as a function of the temperature. The inset displays the total CD spectrum (in mdeg) measured at the SOLEIL Synchrotron facility (France).
absorption at 225 nm. This feature is consistent with the ex-pected unfolding of PGA with increasing temperature as ob-served in Refs.11and21.
The inset in Fig.7shows the steady-state CD spectrum of our PGA sample at 25◦C. This spectrum was measured at
the DISCO line of the SOLEIL synchrotron facility (France). It displays the well-known double minimum structure which is characteristics of a high-helicity sample. The main part of Fig.7 shows the steady-state CD of our PGA sample mea-sured at 225 nm with our UV laser pulses upon varying the temperature of the cell. Here again, the decrease of CD (in absolute values) with temperature is a signature of the unfolding of the peptide. We can estimate the helical fraction of the peptide from its CD value following Ref.17:
fH =
[θ ]222−[θ ]c
[θ ]H−[θ ]c
, (7)
where [θ ]c=2220 − 53 T is the random coil ellipticity for
temperature T expressed in◦C and [θ ]
H = −44 000 + 250 T
is the ellipticity of an infinite alpha helix. Ellipticities are expressed in deg cm2dmol−1 per residue. The conversion of our measured value, CD, to ellipticity is given by
[θ ] = 3298 ln 10
CD
cL, (8)
where c is the residue concentration (M) and L the cell thickness (cm). With our experimental parameters, this yields [θ ] = 925 000 CD Note that in order to reduce the laser fluctuations, we chose to work at 225 nm instead of 222 nm. Given the shape of the CD curves (see the inset in Fig. 7), the slight discrepancy between these two wavelengths yields a negligible error. The helical fraction of PGA as a function of the temperature is also displayed in Fig.7(right scale). It decreases from 0.55 at 19◦C to 0.19 at 50◦C. 0 1 2 0.12 0.13 0.14 -10 -5 0 p
tion Change (mOD
) 0.015Circular Dic h r 13 -12 -11 -10 0.38 0.39 0.40 0.41 Helical Fraction f H a 0 1 2 -15 Delay Time ( s) Absor p 0.014 roism -14 -13 IR UV 0.35 0.36 0.37 at 32°C
FIG. 8. (Color online) Transient UV absorption (squares, left scale) and CD (= 2δαL) in absolute values (dots, right scale) at 225 nm following a T-jump of 4◦C in a sample of PGA (20 mg/ml, pH 4.8, 100 µm pathlength) at an
initial temperature of 28◦C. The dashed line is an exponential fit common to
the two data sets. The change in CD is translated to helical fraction, calculated as described in Eq.(7), on the far right scale. Also shown is the change of IR absorption at 1632 cm−1(solid line, far left scale) in a 10 mg/ml PGA sample in D2O, pD ∼ 5.6, after a T-jump of 5◦C from 28◦C. The inset shows the CD
data obtained with the lock-in amplifier (squares), the direct measurement of
I−−I+(dots) or the Fast Fourier Transform technique (triangles).
B. T-jump experiment
We have carried out T-jump experiments with T-jumps of 4◦C from two starting temperatures: 21 and 28◦C. Figure 8 displays the time-resolved absorption (black) and CD (red) changes measured in our PGA sample following heating of the water by a 8 mJ infrared pulse for Tinitial =
28◦C. Both measurements are carried out for λ = 225 nm.
The CD curve is the average of the three curves displayed in the inset after a 12-h-long acquisition. The two curves can be very well fitted by a simple exponential with a time constant of 0.6 ± 0.1 µs. This time increases to 1.5 ± 0.3 µs for Tinitial
=21◦C. As expected, the helical relaxation time gets larger
as temperature decreases.
For absorption as well as for CD, the changes are con-sistent with an unfolding of PGA after the T-jump: absorp-tion and CD decrease. Comparing the measured changes in absorption or CD to the steady-state temperature-dependent data (Figs.6 and7), we find that the changes correspond to a temperature increase by 4◦C, in agreement with the size of
the T-jump determined from the IR pump power we used, cal-ibrated as described above. For the two temperatures studied, we observe a drop of the CD of about 0.002. This is con-sistent with Fig. 7, where a constant slope is observed for temperatures ranging between 20 and 35◦C. This agreement
between the CD changes observed in the time-resolved and the steady-state measurements indicates that the peptide sec-ondary structure fully equilibrates on the microsecond time scale.
The dynamic CD results can be directly converted to the absolute helical content using the above equation (see Fig.8, right scale) which is the main advantage of CD measurements over measurements using other spectroscopic techniques for following protein folding dynamics. For any attempt to theoretically describe helix folding dynamics (or protein folding dynamics in general), e.g., using statistical mechanics
models30 or molecular dynamics simulations,31 quantitative
knowledge of the helical content and its change during equilibration at the higher temperature will provide important additional experimental information compared to the usual kinetic experiments which only yields the relaxation time constant without giving any insight into the actual structural changes of the peptide. In terms of helical fraction, a T-jump of 4◦C leads to a reduction from 41% at 28◦C to 36% at 32◦C
and from 46% at 21◦C to 42% at 25◦C for PGA in H2O at
pH 4.8.
C. Comparison with IR results
The unfolding dynamics and time constants observed using CD measurements are in good agreement with those measured by IR detection. For verification of our results, we performed T-jump experiments detected at 1632 cm−1 using a setup which has been described in detail before.8 Briefly, the solvent (D2O) was heated using ns-laser pulses
at 1970 nm, generated by a Nd:YAG/dye laser system with IR difference frequency generation. Absorbance changes at 1632 cm−1were probed using the continuous IR beam from
a tunable lead-salt diode laser and a fast HdCdTe photodiode with 50 MHz bandwidth, yielding an overall signal rise time of 14 ns. Due to the different strength of hydrogen and deuterium bonds, the pK value of the PGA side chain and the transition midpoint of pH/pD-induced helix unfolding curves are different in D2O compared to H2O, so that the sample
needs to be adjusted to a higher pD for obtaining the same helical content. We found that a pD of ∼5.6 was required for PGA in D2O to have a helical content (as determined by
CD) of ∼0.5 at room temperature, and thus to have similar structural behavior as the sample in H2O on which dynamic
CD experiments were performed.
Figure8shows (solid line) absorbance changes measured on a 10 mg/mL PGA sample in D2O, pD ∼ 5.6, after a T-jump
of 5◦C from 28◦C at 1632 cm−1, i.e., near the maximum of
the helical amide I′band. At this wavelength, there is a
sig-nificant contribution from the solvent which appears instanta-neously and remains constant on the ns to µs-time scale (Ref.
8). In addition, the amide I′ absorbance decreases in
paral-lel to helix unfolding, yielding dynamic information on this process. Within the uncertainty of the experiments, the dy-namics are very similar to those observed by UV-absorbance and by UV-CD. An exponential fit of the IR data yields a time constant of 0.79 ± 0.04 µs after a T-jump from 28◦C
to 33◦C, which is close to the time constant of 0.6 ± 0.1 µs
observed by CD after a T-jump from 28◦C to 32◦C, although
the IR results, which are the average of 25 000 individual mea-surements and consequently have very high signal-to-noise, also show some deviation from a single exponential behavior which is not visible in the CD results due to noise. It has to be noted that the two samples most likely did not agree perfectly in their structural behavior/helical content, which is expected to be the major reason for any remaining differences in the dynamics observed by IR and CD.
VI. CONCLUSION
We have presented a complete set-up allowing for the first time the measurement of far UV-CD changes in a T-jump ex-periment. The experiment is based on the use of a nanosec-ond Nd:YAG-pumped OPO to generate an infrared pulse to heat up the water solvent whereas the probe is a far UV pulse generated by a 1 kHz, Titanium-Sapphire based laser system. A full synchronization device has been developed to trigger the two laser sources with a delay that is controllable with a 12.1 ns time step. Several detection schemes have been pro-posed and implemented. It is shown that three different tech-niques yield equivalent results, providing a good flexibility to the acquisition system.
The measurement of the temperature increase during the T-jump experiment with the help of visible pulses has also been addressed. A solution mixing a temperature-dependent buffer (Tris HCl) and a pH indicator (Bromothymol Blue) has been proven to be very efficient and has allowed us to fully characterize our T-jump apparatus. A temperature increase of 5◦C can be achieved with 8 mJ IR pump
pulses.
We have carried out steady-state and time-resolved ab-sorption and CD measurements on a PGA sample at initial temperatures of 21 and 28◦C. The time-resolved measure-ments are consistent with a 4◦C jump and yield a decrease
of the CD by 0.002. The relaxation time is measured to be 1.5 µs at 25◦C and 0.6 µs at 32◦C, in agreement with
mea-surements using IR detection. Unlike IR detection, however, the CD experiment also allows quantitative monitoring of the thermal denaturation: we measure a drop of the helical fraction from 41% to 36% when the temperature jumps from 28 to 32◦C and from 46% to 42% when it goes from 21 to
25◦C.
ACKNOWLEDGMENTS
Financial Support from CNRS and the Royal Society un-der the International Joint Project scheme is gratefully ac-knowledged. We are also grateful for the loan of laser system NSL4 from the laser loan pool at the CCLRC Central Laser Facility.
Dr. Frank Wien is gratefully thanked for measurement of the steady-state CD at the SOLEIL Synchrotron facility (Saclay – France).
1R. H. Callender and R. B. Dyer,Curr. Opin. Struct. Biol12, 628 (2002). 2R. H. Callender and R. B. Dyer,Chem. Rev.106, 3031 (2006).
3R. M. Ballew, J. Sabelko, and M. Gruebele,Proc. Natl. Acad. Sci.93, 5759
(1996).
4P. Li, F. Y. Oliva, A. N. Naganathan, and V. Munoz,Proc. Natl. Acad. Sci.
106, 103 (2009).
5W. K. Surewicz, H. H. Mantsch, and D. Chapman,Biochemistry32, 389
(1993).
6S. Williams, T. P. Causgrove, R. Gilmanshin, K. S. Fang, R. H. Callender,
W. H. Woodruff, and R. B. Dyer,Biochemistry35, 691 (1996).
7T. Wang, D. Du, and F. Gai,Chem. Phys. Lett.370, 842 (2003). 8A. Pozo Ramajo, S. A. Petty, and M. Volk,Chem. Phys.323, 11 (2006). 9R. Gilmanshin, S. Williams, R. H. Callender, W. H. Woodruff, and R. B.
Dyer,Proc. Natl. Acad. Sci.94, 3709 (1997).
10C. Phillips, Y. Mizutani, and R. Hochstrasser,Proc. Natl. Acad. Sci.92,
054302-8 Khucet al. Rev. Sci. Instrum. 82, 054302 (2011)
11E. A. Gooding, A. Pozo-Ramajo, J. W. Wang, C. Palmer, and M. Volk,
Chem. Comm.5985 (2005).
12E. Chen, J. R. Kumita, G. A. Woolley, and D. S. Kliger,J. Am. Chem. Soc.
125, 12443 (2003).
13I. K. Lednev, A. S. Karnoup, M. C. Sparrow, and S. A. Asher,J. Am. Chem.
Soc.121, 8074 (1999).
14S. A. Asher, A. Ianoul, G. Mix, M. N. Boyden, A. Karnoup, M. Diem, and
R. Schweitzer-Stenner,J. Am. Chem. Soc.123, 11775 (2001).
15V. A. Shashilov, V. Sikirzhytski, L. A. Popova, and I. K. Lednev,Methods
52, 23 (2010).
16G. D. Fasman, Circular Dichroism and the Conformational Analysis of
Biomolecules(Plenum, New York, 1996).
17C. A. Rohl and R. L. Baldwin,Biochemistry36, 8435 (1997).
18T. Dartigalongue, C. Niezborala, and F. Hache,Phys. Chem. Chem. Phys.
9, 1611 (2007).
19X. Xie and J. D. Simon,Rev. Sci. Instrum.60, 2614 (1989). 20T. M. Schuster,Biopolymers3, 681 (1965).
21B. R. Jennings, G. Spach, and T. M. Schuster,Biopolymers6, 635 (1968). 22F. Bordi, C. Cametti, and G. Paradossi,Phys. Chem. Chem. Phys.1, 1555
(1999).
23C. Niezborala and F. Hache,J. Opt. Soc. Am. B23, 2418 (2006). 24W. O. Wray, T. Aida, and R. B. Dyer,Appl. Phys. B74, 57 (2002). 25P. Bayley, S. Martin, and M. Anson,Biochem. Biophys. Res. Commun.66,
303 (1975).
26E. F. Chen, Y. X. Wen, J. W. Lewis, R. A. Goldbeck, D. S. Kliger, and C.
E. M. Strauss,Rev. Sci. Instr.76, 083120 (2005).
27A. A. El-Harakany, F. M. Abdel Halim, and A. O. Barakat,J. Electroanal.
Chem.162, 285 (1984).
28C.-Y. Huang, J. W. Klemke, Z. Getahun, W. F. DeGrado, and F. Gai,J. Am.
Chem. Soc.123, 9235 (2001).
29C. Krejtschi and K. Hauser,Eur. Biophys. J.40, 673 (2011).
30P. A. Thompson, W. A. Eaton, and J. Hofrichter,Biochemistry36, 9200
(1997).