HAL Id: hal-00295239
https://hal.archives-ouvertes.fr/hal-00295239
Submitted on 21 Mar 2003
HAL is a multi-disciplinary open access
archive for the deposit and dissemination of
sci-entific research documents, whether they are
pub-lished or not. The documents may come from
teaching and research institutions in France or
abroad, or from public or private research centers.
L’archive ouverte pluridisciplinaire HAL, est
destinée au dépôt et à la diffusion de documents
scientifiques de niveau recherche, publiés ou non,
émanant des établissements d’enseignement et de
recherche français ou étrangers, des laboratoires
publics ou privés.
photolysis
J. Kaiser, T. Röckmann, C. A. M. Brenninkmeijer, P. J. Crutzen
To cite this version:
J. Kaiser, T. Röckmann, C. A. M. Brenninkmeijer, P. J. Crutzen. Wavelength dependence of isotope
fractionation in N2O photolysis. Atmospheric Chemistry and Physics, European Geosciences Union,
2003, 3 (2), pp.303-313. �hal-00295239�
www.atmos-chem-phys.org/acp/3/303/
Chemistry
and Physics
Wavelength dependence of isotope fractionation in N
2
O photolysis
J. Kaiser1, 2, 4, T. R¨ockmann2, C. A. M. Brenninkmeijer1, and P. J. Crutzen1, 31Abteilung Chemie der Atmosph¨are, Max-Planck-Institut f¨ur Chemie, Mainz, Germany 2Bereich Atmosph¨arenphysik, Max-Planck-Institut f¨ur Kernphysik, Heidelberg, Germany
3Center for Atmospheric Sciences, Scripps Institution of Oceanography, University of California, San Diego, USA 4now at: Department of Geosciences, Princeton University, Princeton, New Jersey, USA
Received: 15 July 2002 – Published in Atmos. Chem. Phys. Discuss.: 28 October 2002 Revised: 4 February 2003 – Accepted: 27 February 2003 – Published: 21 March 2003
Abstract. In previous reports on isotopic fractionation in
the ultraviolet photolysis of nitrous oxide (N2O) only
enrich-ments of heavy isotopes in the remaining N2O fraction have
been found. However, most direct photolysis experiments have been performed at wavelengths far from the absorption maximum at 182 nm. Here we present high-precision mea-surements of the15N and18O fractionation constants (ε) in photolysis at 185 nm. Small, but statistically robust deple-tions of heavy isotopes for the terminal atoms in the linear N2O molecule are found. This means that the absorption
cross sections σ (15N14N16O) and σ (14N218O) are larger than
σ(14N216O) at this specific wavelength. In contrast, the
cen-tral N atom becomes enriched in 15N. The corresponding fractionation constants (±1 standard deviation) are
15ε 1=σ (15N14N16O)/σ (14N216O) − 1 = (3.7 ± 0.2) ‰, 18ε = σ (14N 218O)/σ (14N216O) − 1 = (4.5 ± 0.2) ‰ and 15ε 2=σ (14N15N16O)/σ (14N216O)−1 = (−18.6 ± 0.5)‰.
To our knowledge, this is the first documented case of such a heavy isotope depletion in the photolysis of N2O which
supports theoretical models and pioneering vacuum ultra-violet spectroscopic measurements of15N substituted N2O
species that predict fluctuations of ε around zero in this spec-tral region (Selwyn and Johnston, 1981). Such a variabil-ity in isotopic fractionation could have consequences for at-mospheric models of N2O isotopes since actinic flux varies
also strongly over narrow wavelength regions between 175 and 200 nm due to the Schumann-Runge bands of oxygen. However, the spacing between maxima and minima of the fractionation constants and of the actinic flux differ by two orders of magnitude in the wavelength domain. The wave-length dependence of fractionation constants in N2O
photol-ysis can thus be approximated by a linear fit with negligible consequences on the actual value of the spectrally averaged fractionation constant. In order to establish this linear fit, Correspondence to: J. Kaiser (kaiser@princeton.edu)
additional measurements at wavelengths other than 185 nm were made using broadband light sources, namely D2, Hg/Xe
and Sb lamps. The latter lamp was used in conjunction with various interference filters to shift the peak photolysis rate to longer wavelengths. From these experiments and existing data in the literature, a comprehensive picture of the wave-length dependence of N2O photolysis near room-temperature
is created.
1 Introduction
N2O isotope fractionation by photolysis at various
wave-lengths has been the subject of at least eight recent exper-imental studies (Johnston et al., 1995; Rahn et al., 1998; R¨ockmann et al., 2000, 2001; Toyoda et al., 2001a; Tu-ratti et al., 2000; Umemoto, 1999; Zhang et al., 2000). In line with theoretical calculations (Johnson et al., 2001; Yung and Miller, 1997), the measured fractionation constants ex-hibit a dependence on the wavelength of photolysis radiation. Photolysis (reaction 1) comprises approximately 90% of the global N2O sink and is the dominant cause of the observed
isotopic enrichment of N2O in the stratosphere (Griffith et al.,
2000; Kim and Craig, 1993; Moore, 1974; Rahn and Wahlen, 1997; R¨ockmann et al., 2001; Toyoda et al., 2001b; Yoshida and Toyoda, 2000) The remaining 10% of the total N2O sink
are due to the reaction of N2O with O(1D) (reactions 2 and
3).
N2O + hν → N2+O(1D) (185 nm < λ < 230 nm)(90%)(1)
N2O + O(1D) → 2 NO (6%) (2)
N2O + O(1D) → N2+O2 (4%) (3)
Maximum photolysis rates of N2O in the stratosphere
oc-cur between 195 and 205 nm (Minschwaner et al., 1993), but depending on altitude and latitude there are contributions down to 185 nm and up to 230 nm. Below 185 nm absorption
by O2prohibits the penetration of solar light, above 230 nm
the photolysis rates are constrained by O3absorption and the
decrease of the N2O cross section.
By way of reaction 2, N2O is the major source of
strato-spheric NOx and is thus linked to the O3 cycle. The
tro-pospheric mixing ratio of N2O has increased by about 17%
from its pre-industrial value and grows by 0.2 to 0.3% per year at present. This must be of concern considering the long atmospheric lifetime of about 120 years (Prather et al., 2001) and the role of N2O as a greenhouse gas and its
po-tential for O3depletion. Thanks to the reduced emissions of
organic halogen compounds as demanded by the 1987 Mon-treal Protocol and its subsequent adjustments and amend-ments, stratospheric chlorine levels are expected to decrease in the future (WMO, 1999). However, this will reinforce the role of N2O as a source gas for ozone depleting NOxradicals
(Randeniya et al., 2002). Therefore quantification of N2O
source and sink fluxes are important pieces in global Earth system models. It is hoped that isotope measurements can be used to improve our knowledge of the atmospheric bud-get of this species, since current estimates suffer from large uncertainties.
Models of atmospheric chemistry and transport require ki-netic data on reaction rate constants (k) and photochemical absorption cross sections (σ ) as input values. Slight vari-ations of these quantities may occur as a result of isotopic substitution. These kinetic isotope effects are conveniently expressed relative to the most abundant, light species using fractionation factors (α) or fractionation constants (ε). We adopt here the definition of α found in many geological text-books and used in most previous papers on N2O
isotopo-logues, but note that it is inverse to custom in chemical ki-netics and an IUPAC recommendation (M¨uller, 1994): α = kheavy
klight
=1 + ε (4)
kheavy and klight denote the reaction rate constants of the
isotopically heavy and light species (e.g. 15N14N16O and
14N
216O). Photolysis rates (J ) are proportional to σ , so that
in this case k can be substituted by σ , adopting the recom-mended value of 1 for the quantum yield of O(1D) in photol-ysis of all N2O isotopologues and isotopomers.
Heavy isotope enrichments in a single sample of strato-spheric N2O were first noticed by Moore (1974), but it took
nearly 20 years before the data were backed up by further measurements (Kim and Craig, 1993). Already then, UV photolysis was suspected as origin of the isotopic enrich-ment. However, a direct measurement at 185 nm found no significant oxygen isotope fractionation at 185 nm (John-ston et al., 1995) and – together with an apparent lack of N2O sources to balance the atmospheric budget
(Wat-son et al., 1990, 1992) – rekindled speculations about a suite of “non-standard” N2O sources or sinks (McElroy
and Jones, 1996; Prasad, 1997; Wingen and Finlayson-Pitts, 1998; Zipf, 1980). Finally though, a zero point
en-ergy (ZPE) model of N2O photolysis (Yung and Miller,
1997) postulated wavelength-dependent isotopic fractiona-tions: Near-zero fractionations at the absorption maximum of N2O (≈ 182 nm) were expected as against to isotope
enrich-ments of the residual N2O at longer and depletions at shorter
wavelengths. This explained the stratospheric enrichments (at least qualitatively) and the measurements at 185 nm. In retrospect, this was also in agreement with pioneering vac-uum ultraviolet (VUV) spectroscopy of15N substituted N2O
species (Selwyn and Johnston, 1981), although they seem to have been overlooked at that time. The further predic-tion of posipredic-tion-dependent enrichments of 15N in the N2O
molecule led to the development of new spectrometric tech-niques (Brenninkmeijer and R¨ockmann, 1999; Toyoda and Yoshida, 1999; Turatti et al., 2000). Subsequent tests of this theory found it to be in qualitative agreement with new ex-perimental data, but the measured enrichment constants were always higher than predicted (Rahn et al., 1998; R¨ockmann et al., 2000, 2001; Toyoda et al., 2001a; Turatti et al., 2000; Umemoto, 1999; Zhang et al., 2000). Ab initio calculations by Johnson et al. (2001) gave better fits to the measurements, except for the15N14N16O isotopomer.
Here, we present high-precision measurements of the18O and of the position-dependent 15N fractionation in room-temperature N2O photolysis at 185 nm. They validate the
ex-isting VUV spectroscopic measurements (Selwyn and John-ston, 1981) and are supplemented by additional measure-ments with broadband UV light sources. Together with the data from previous reports, a synopsis of the wavelength-dependent isotope fractionation in N2O photolysis is created
which is then used to evaluate the effects of N2O photolysis
in the region of the Schumann-Runge bands on the overall isotopic fractionation.
2 Experimental methods
The change of isotopic composition by photolysis in a closed-system can be described as a Rayleigh fractionation process (Rayleigh, 1896):
δ = yε−1 (5)
For applications to isotopes, the so-called δ value is de-fined here as relative enrichment of the isotope ratio at any time of the reaction (R) against the isotope ratio at the be-ginning of the reaction: δ = R/R0−1. y = c/c0 is the
total remaining fraction of the light isotopologue, but can be equated to a very good degree of approximation with the to-tal remaining N2O fraction for samples at natural abundance
(Kaiser et al., 2002a).
In this study, the calculation of fractionation constants ε was based on a linearised form of Eq. (5) using either the ra-tio of ln(1 + δ)/ ln y in each individual experiment or least squares fits to Rayleigh plots of ln(1 + δ) vs ln y. Given suf-ficient experimental precision and provided the y-axis offset
in a Rayleigh plot is zero, the latter approach is more suitable to detect influences of reaction parameters on ε.
N2O in N2 bath gas was irradiated by different light
sources using four reactor types. All gases used were of 99.9999% chemical purity. Reactors A, B and C consist of quartz, stainless steel and borosilicate glass tubes, re-spectively, and were already used in previous photolysis ex-periments (Kaiser et al., 2002b; R¨ockmann et al., 2000). No significant influence of reactor type on the experimen-tal results was found. Reactor E is a borosilicate glass bulb (V ≈ 2.2 dm3) with a quartz insert (Kaiser et al., 2002a).
The photolysis experiments at 185 nm were performed in reactor E. A pencil style, low-pressure Hg(Ar) lamp (“Pen Ray lamp”, LOT Oriel) was put in the quartz insert and usu-ally operated at 18 mA (AC). The spectral output of Pen Ray lamps is known to be remarkably stable and temperature-insensitive, and even the total irradiance is reproducible to within 15% (Reader et al., 1996). The wavelengths of 19 spectral lines in the range 253 to 579 nm were within ±0.002 nm of published values for Hg emission lines (San-sonetti et al., 1996). However, the 185 nm-line was not inves-tigated. Its intensity relative to the 253.65 nm-line is stated as 3% (LOT Oriel), but may vary from lamp to lamp. There-fore, additional experiments were performed with a second lamp. The precise wavelength of the “185 nm”-line for the natural Hg isotope mixture is given as 184 950 nm (Lide, 1999). Other intense Hg lines in the emission spectrum of these lamps are located at wavelengths > 250 nm and are not of importance for N2O photolysis.
The irradiation by the lamp led to temperatures of about 50◦C at the inner wall of the quartz inset and as high as
100◦C at the lamp itself. Therefore, one experiment was
con-ducted at a reduced current of 10 mA, giving only ≈ 40◦C
and ≈ 85◦C, respectively. The temperature of the gas mix-ture itself was measured with a thermocouple at different po-sitions of the reactor and amounted to fairly homogeneous values of 28◦C/25.5◦C for 18/10 mA. To check for any influ-ence of O2photolysis and subsequent O3production on the
irradiation spectrum, the quartz cavity was flushed with N2
during three experiments. The photolysis times varied from 2.1 to 40.9 h, resulting in final yields of 3.5 to 84.5%.
A mixture of 1.0 mmol/mol N2O/N2was used for the
ex-periments at initial pressures of about 1000 mbar. Higher mixing ratios can lead to artefacts which were traced back in a recent study to O(1D) production by NO2
photoly-sis and subsequent reaction of N2O with O(1D) (Kaiser
et al., 2002b). Pressures were corrected for non-linearity of the sensor and temperature variations. The remaining N2O fraction (y) was determined by quantitative
extrac-tion in an ultra-high efficient Russian Doll-type trap (Bren-ninkmeijer and R¨ockmann, 1996). Blank experiments with-out photolysis gave an indication of the precision of the degree of conversion (σln y = 0.009) and of the δ values
(σδ15N=0.1‰; σ1δ15N=σ2δ15N=0.25‰; σδ18O=0.15‰)
from which the fractionation constants are calculated. N2O
samples were purified on a preparatory gas chromatograph (Kaiser et al., manuscript in preparation) and analysed on a Finnigan MAT 252 isotope ratio mass spectrometer for45δ,
46δ and31δ (Kaiser et al., 2002a). The available Faraday
cup configuration of this instrument did not allow to project m/z30 and m/z 31 beams simultaneously on the centre of a cup. Instead, the cup configuration for O2 isotope
anal-ysis was used and ion currents of the NO+ fragment were measured on the peak flanks. Thus, precision of the NO+ fragment analysis was slightly impaired, but by no means compromises the conclusions drawn here.
Photolysis experiments with broadband light sources (D2,
Hg/Xe and Sb lamps, partly used in conjunction with inter-ference filters) were performed with a 4.0 mmol/mol N2O/N2
mixture using reactors A to C. The possible presence of an artefact from the reaction of N2O with O(1D) for this higher
mixing ratio is discussed in Sect. 4. Due to the strong in-frared radiation from the Hg/Xe lamp, it was used together with a water filter which protected the photolysis reactor from excessive heating. The filter was filled with high-purity water (MilliQ) and was cooled continuously by wa-ter. Unlike the measurements at 185 nm, the31δ values for the NO+fragment were measured on a Micromass Prism II mass-spectrometer with adjustable cups, so that the standard-deviation of31δ(0.04‰) is comparable to that of45δand46δ (0.02‰ and 0.04‰).
3 Isotopic depletions by N2O photolysis at 185 nm
The results of photolysis at 185 nm are shown in Figs. 1a and b. Up to the largest degrees of conversion, the frac-tionation constants give a consistent picture of isotopic de-pletions at the terminal positions of the residual N2O (δ18O
and1δ15N). There is no clearly discernible influence of lamp specimen, operating current or nitrogen flushing. The ab-sence of any significant variation of ε with ln y indicates that most probably no other than the desired fractionation pro-cess was taking place, as opposed to the artefacts noticed at higher mixing ratios (Kaiser et al., 2002b). The absence of artefacts was also confirmed by irradiation of an O2/N2
mixture (0.62 mmol/mol) for 13.5 h. After the entire extrac-tion and purificaextrac-tion procedure, 0.38 µl N2O (standard
ambi-ent temperature and pressure, SATP) were recovered corre-sponding to the system blank of ≈ 0.3 µl N2O (SATP). N2O
production from N2+O(1D) can thus be neglected, in
agree-ment with its low rate constant of 2.8 · 10−36c(N
2)cm6s−1
(Estupi˜n´an et al., 2002).
Figure 1b shows the directly calculated fractionation con-stants for each experiment. We argue that the best estimate of the “true” fractionation constants is not the mean of these directly calculated fractionation constants since they are sub-ject to a small error if the y-axis offset in a Rayleigh plot is not exactly zero, especially if the degree of conversion is small (ln y ≈ 0). Rather, the slope in a Rayleigh plot
-3 -2 -1 -20 -10 0 10 20 -3 -2 -1 -40 -30 -20 -10 0 10 20 30 40 50 60 70 18 ε 15 ε 15ε 2 15ε 1 Pen-Ray lamp I, 18 mA
Pen-Ray lamp I, 18 mA, flushing with N2
Pen-Ray lamp II, 18 mA Pen-Ray lamp II, 10 mA
ε /‰ ln y a b ln(1+δ18 O) ln(1+δ15 N) ln(1+2δ15 N) ln(1+1δ15 N) ln (1 + δ )/‰ ln y
Fig. 1. Rayleigh fractionation plot
(panel a) of ln(1 + δ) vs ln y and di-rectly calculated fractionation constants
ε (panel b) for photolysis with
low-pressure Hg(Ar) lamps at 185 nm. y
is the remaining N2O fraction.
Frac-tionation constants for the terminal and
central nitrogen positions in the N2O
molecule are designated15ε1and15ε2;
the18O fractionation is represented by
18ε and the average15N fractionation
by15ε = (15ε1+15 ε2)/2. The
cor-responding δ values are1δ15N,2δ15N,
δ18O and δ15N. Two different lamps
were used at operating currents of 10 and 18 mA, with or without nitrogen
flushing. Errors from N2O extraction
and isotope analysis are smaller than the symbol size, unless indicated.
Table 1. Fractionation constants for N2O photolysis at 185 nm obtained by different ways of calculation as described in the main text. Errors
represent one standard deviation. The y-axis offset of zero for the “mean direct” values corresponds to the calculation of ε from ln(1+δ)/ ln y
“mean direct” “Rayleigh plot”
ε/‰ y-axis offset ε/‰ y-axis offset r2
15ε −4.4±0.5 0 −4.5±0.2 0.0±0.2 0.989 15ε 1 12.2±1.2 0 10.3±0.3 −1.5±0.5 0.992 15ε 2 −20.7±1.3 0 −18.6±0.5 1.7±0.7 0.994 18ε 4.2±0.5 0 3.7±0.1 −0.3±0.2 0.990
(Fig. 1a) is a more reliable estimate of the fractionation con-stant and is therefore adopted as “true” ε. The results of two calculation methods (“mean direct” and “Rayleigh plot”) are shown in Table 1, together with errors at the 1σ level. The positive values for15ε1and18εare the first documented cases
of isotopic depletion in the residual gas by N2O photolysis.
In contrast to the results presented here, Johnston et al. (1995) did not find any significant oxygen isotope frac-tionation at 185 nm. Re-analysis of their original data gives
18ε = (0.2±0.2)‰. Although Johnston and co-workers used
a low-pressure mercury resonance lamp powered by a
mi-crowave instead of an electrical discharge, differences be-tween the light sources are very unlikely to account for the differences in18ε. In principle, contributions from Hg lines at other wavelengths could have caused the discrepancy in
18εvalues, but were not observed for the Pen Ray lamps at
wavelengths relevant to N2O photolysis (i.e. λ < 240 nm)
and were also absent in the spectrum of the microwave pow-ered lamp (Jeff Johnston, personal communication, 2002). Under exceptional conditions such as dramatically increased nitrogen purge flows and reduced plasma voltages, 194.2 nm-emission from Hg+was noticed with intensities of up to 20%
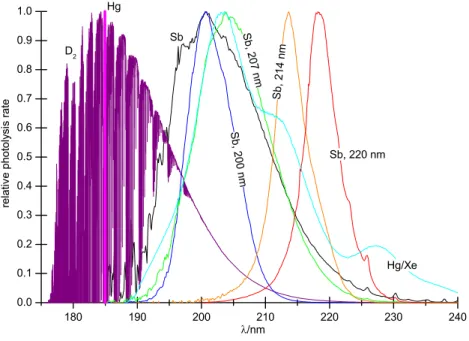
180 190 200 210 220 230 240 0.0 0.1 0.2 0.3 0.4 0.5 0.6 0.7 0.8 0.9 1.0 Sb S b, 200 nm S b, 207 nm Sb, 214 nm Sb, 220 nm Hg/Xe D2 Hg rela tiv e phot ol ys is rate λ/nm
Fig. 2. Relative N2O photolysis rates
for filtered and unfiltered light from dif-ferent broadband lamps. The photoly-sis rates have been normalised by divi-sion through their maximum values so that they can be compared more
eas-ily. The closely spaced O2
Schumann-Runge bands account for the structured
appearance of the D2lamp spectrum.
Table 2. Fractionation constants for N2O photolysis with broadband light sources
ε/‰ D2lamp HgXe lamp Sb lamp, Sb lamp, Sb lamp,
200 nm filter 214 nm filter 220 nm filter
15ε −20.0±0.1 −48.9±1.5 −39±7 −59±10 −69±5 15ε 1 −8.4±0.4 −28.1±2.1 n.a.a −41±7 −43±3 15ε 2 −31.4±0.3 −69.5±2.8 n.a.a −74±13 −95±7 18ε −15.9±0.1 −46.9±1.9 −43±8 −52±9 −61±5 ln ˆyb −1.2 −0.39 −0.040 −0.034 −0.076
an.a.: not analysed
byˆ: maximum degree of conversion
relative to the 185 nm-line (Cantrell et al., 1997; Lanzendorf et al., 1997), but under thermally normal operating condi-tions the relative emission intensity does not exceed a few percent. Analytical errors are more probable to be blamed for the discrepancy between the two studies: Rather than analysing N2O directly, Johnston et al. decomposed it first
to N2and O2in a quartz tube with gold insert at > 800◦C
and separated N2 and O2 afterwards (Cliff and Thiemens,
1994), since they wanted to analyse17O/16O variations as well. If separation of N2 from O2 is not quantitative, this
may compromise the accuracy of the δ18O and especially
δ17O values, because N2may interfere with O2isotope
mea-surements (Sowers et al., 1989). This interference is likely to be mass-spectrometer specific and is presumably caused by stray N+2 ions reaching the Faraday cup collectors for O2
species. The unlikely slope of a ln(1 + δ17O) vs ln(1 + δ18O) plot of −1.5±0.4 derived from re-analysis of Johnston et al.’s data set lends support to this interpretation. A more realistic value of this slope should be close to 0.5.
4 Photolysis with broadband light sources
Additional photolysis experiments were performed with a set of different broadband light sources. The corresponding spectral photolysis rates (Fig. 2) were calculated from direct measurements of the emission spectra of the Sb (R¨ockmann et al., 2001) and Hg/Xe lamps (Saueressig, 1999), convoluted (where appropriate) with transmission spectra of four inter-ference filters (Melles Griot) and the N2O absorption
spec-trum at room temperature (Selwyn et al., 1977; Yoshino et al., 1984). The emission spectrum of the D2lamp was not
measured directly, but was calculated from measurements of the spectral radiant intensity of a D2 calibration lamp
(Mathias Richter, personal communication, 2001), transmis-sion functions of synthetic silica windows (Hamamatsu) and high-resolution O2absorption cross sections (Minschwaner
et al., 1992).
Photolysis half-life times were about 11 h for the D2lamp
-100 -80 -60 -40 -20 0 20 40 160 170 180 190 200 210 220 λ/nm ε/‰ 18ε -100 -80 -60 -40 -20 0 20 40 160 170 180 190 200 210 220 λ/nm ε/‰ 15ε -100 -80 -60 -40 -20 0 20 40 160 170 180 190 200 210 220 λ/nm ε/‰ 15ε 1 -100 -80 -60 -40 -20 0 20 40 160 170 180 190 200 210 220 λ/nm ε/ ‰ 15ε 2 20
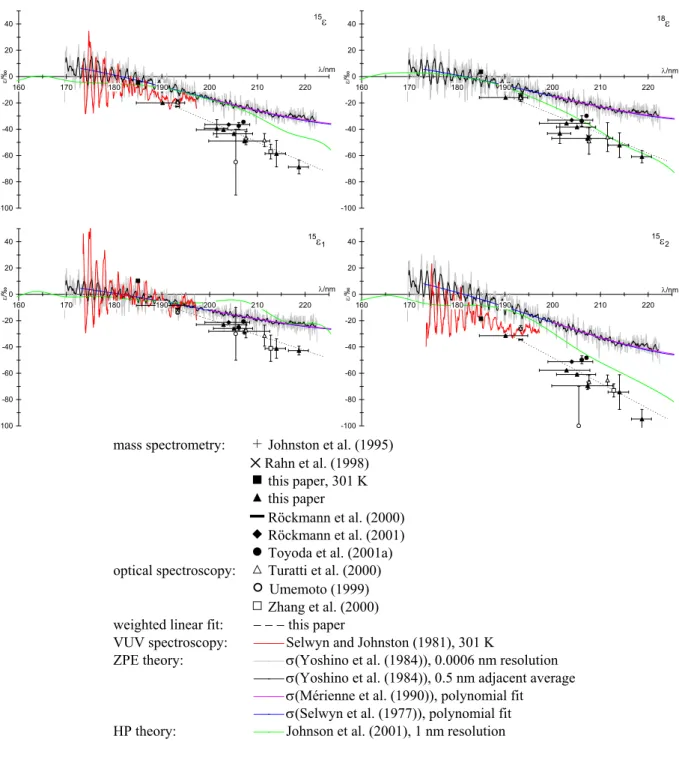
Figure 3. Measured and theoretically predicted fractionation constants for N2O photolysis at
room temperature (unless indicated:)
mass spectrometry: 2 Johnston et al. (1995) ✕ Rahn et al. (1998) ! this paper, 301 K % this paper
▬ Röckmann et al. (2000) " Röckmann et al. (2001) # Toyoda et al. (2001a) optical spectroscopy: + Turatti et al. (2000)
) Umemoto (1999) ' Zhang et al. (2000) weighted linear fit: − − − this paper
VUV spectroscopy: Selwyn and Johnston (1981), 301 K
ZPE theory: σ(Yoshino et al. (1984)), 0.0006 nm resolution σ(Yoshino et al. (1984)), 0.5 nm adjacent average
σ(Mérienne et al. (1990)), polynomial fit
σ(Selwyn et al. (1977)), polynomial fit HP theory: Johnson et al. (2001), 1 nm resolution
Fig. 3. Measured and theoretically predicted fractionation constants for N2O photolysis at room temperature (unless indicated)
conversion were achieved within reasonable irradiation time (extending up to 22 and 33 h, respectively), and the fraction-ation constants derived from Rayleigh plots have small errors (Table 2).
The fractionation constants measured with the unfiltered Sb lamp and in combination with the 207 nm filter (20 nm FWHM) have been presented before (Kaiser et al., 2002b; R¨ockmann et al., 2001). To confine the spectrum of the Sb lamp to narrower wavelength regions, 200 nm, 214 nm and
220 nm filters were used in spectral bandwidths of 10 nm (FWHM). However, this also reduced the light available for photolysis and considerably lengthened the required irradi-ation times. This was aggravated by the low peak transmis-sions of the filters (13 to 18%) and by light loss due to the fact that the extensive discharge of the Sb lamp could not be well focussed on the filter diameter of 25 mm. Therefore, only small extents of photolysis could be achieved within reason-able times, e.g. after 216 h of irradiation with the 220 nm
filter ln y was only −0.076. Furthermore, the 200 nm filter went blind after 72 h total irradiation time. Rayleigh plots of ln(1 + δ) are still well approximated by linear fits to ln y, but the error introduced by the extraction procedure is not negligible anymore at these low extents of photolysis. De-termined from blank runs, the average standard deviation of ln y is σln y =0.004 for reactors A to C. This is smaller than
for reactor E, probably because of the better reproducibility of the manual extraction procedure for smaller reactor sizes. Following Williamson (1968) and York (1966) linear least-squares fits are applied to the data that take into account the mass-spectrometric errors of ln(1 + δ) and assume an invari-able error of 0.004 for ln y. Therefore the calculated fraction-ation constants for the experiments with Sb lamp and the 200, 214 and 220 nm filters have larger errors (Table 2). The ap-proach by Williamson/York has the advantage over a simple linear least squares fit that it considers errors of both depen-dent and independepen-dent variables and that it is symmetric with respect to co-ordinate exchange.
We note that these broadband photolysis measurements were obtained with an N2O mixing ratio of 4.0 mmol/mol.
This may introduce artefacts by interference of the reaction of N2O + O(1D) as discussed for high-precision
measure-ments at 1.0 and 4.0 mmol/mol with the Sb lamp (Kaiser et al., 2002b). The necessary upward corrections depend on ln y, the “true” values for ε and the lamp spectrum. Extrap-olating the empirical formula derived for the Sb lamp with and without 207 nm interference filter (Kaiser et al., 2002b) to correct the fractionation constants measured here, gives upward revisions of 1|15ε2| = 6‰ at ln y = −0.39 for the
Hg/Xe lamp as the worst case. However, considering the dif-ferent emission spectra, a direct extrapolation might not be justified. Therefore and since the estimated correction is only 2σ15ε
2, we leave the measurements uncorrected. It should be
noted that corrections could be warranted for the results of other studies, too, but are difficult to quantify in retrospect.
5 Synoptic view of the wavelength dependence
Figure 3 is an overview of measured and theoretically pre-dicted ε values plotted against wavelength, including the data from this paper. In general, both experimental data and the-oretical predictions qualitatively agree on increasing enrich-ments at higher wavelengths and the order15ε2<18ε <15ε1,
but differ in the magnitudes of ε as well as in its sign near the absorption maximum at 182 nm. The experimental re-sults are approximated by a linear fit from 190 to 220 nm (Table 3).
Data were adopted from the original publications and are presented with 1σ y-error bars as stated by the authors. Ex-perimental data from laser photolysis mostly represent “sin-gle wavelengths” except for the measurements with ArF lasers at 193.3 nm which were performed at the natural line-width of 0.7 nm (FWHM). In case of the broadband
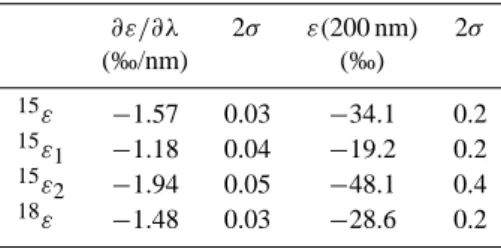
pho-Table 3. Parameters for a y-error weighted linear fit of the
wave-length dependence of ε derived from the results of N2O photolysis
experiments (Fig. 3): ε = ε(200 nm) + ∂ε/∂λ(λ − 200 nm) ∂ε/∂λ 2σ ε(200 nm) 2σ (‰/nm) (‰) 15ε −1.57 0.03 −34.1 0.2 15ε 1 −1.18 0.04 −19.2 0.2 15ε 2 −1.94 0.05 −48.1 0.4 18ε −1.48 0.03 −28.6 0.2
tolysis experiments, data points are located at the median wavelengths for 50% photolysis. The “x-error bars” indicate the 25% and 75% quartiles. If these quartiles are symmetric about the median and if the slope ∂ε/∂λ does not change too much over the range of photolysis, the fractionation constant is close to a hypothetical “single wavelength” measurement at the median λ. Since the actual slope ∂ε/∂λ appears to be almost constant between 190 and 220 nm and the spec-tral photolysis rates of the broadband light sources are fairly symmetric indeed about their median wavelength (Fig. 2), this explains the relative good agreement between broadband and “single wavelength” data. The weighted linear fit shown in Fig. 3 therefore only considers the errors of ε.
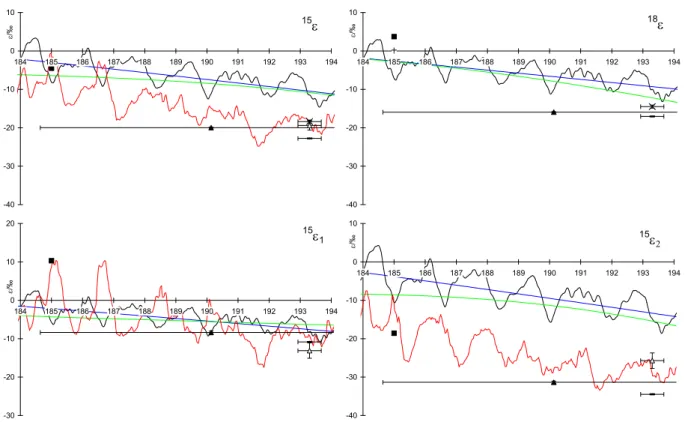
The fractionation constants of the15N isotopomers mea-sured by direct photolysis experiments are complemented by VUV spectroscopic measurements between 173 and 197 nm (Selwyn and Johnston, 1981). The cross-sections are used to calculate ε. The “fine-structure” of ε is in good agree-ment with the “single wavelength” measureagree-ments at 185 and 193.3 nm (Fig. 4) and lends support to the view that the VUV spectroscopic data are most probably adequate to represent the high resolution fractionation constants within their wave-length range. Unfortunately, this range ends at 197 nm, short of the 195–205 nm region most important for stratospheric N2O photolysis.
The fractionation constants predicted by the zero point en-ergy (ZPE) theory (Miller and Yung, 2000; Yung and Miller, 1997) have been derived by blue-shifting the high resolution absorption spectrum of Yoshino et al. (1984) in addition to the polynomial approximations of ln σ proposed by Selwyn et al. (1977) and M´erienne et al. (1990), assuming that these spectra represent essentially the absorption cross section of the most abundant N2O species,14N216O. Although the
rel-ative order of18O and position-dependent15N fractionations is predicted correctly, their magnitudes are about a factor of 2 too low. Also, at wavelengths close to the absorption max-imum, the theoretical “fine structure” is not in phase with VUV spectroscopic measurements (Fig. 4).
The ab initio calculations by Johnson et al. (2001) were performed using the Hermite propagator (HP) on a two-dimensional (2-D) potential energy surface (PES) (spanned
310 J. Kaiser et al.: Wavelength dependence of isotope fractionation
22
direct measurements and VUV spectroscopy in the range from 184 to 194 nm. The same
symbols as in Fig. 3 have been used, but the high-resolution ZPE calculation has been omitted
for clarity.
-40 -30 -20 -10 0 10 184 185 186 187 188 189 190 191 192 193 194 ε/‰ 18ε -40 -30 -20 -10 0 10 184 185 186 187 188 189 190 191 192 193 194 ε/‰ 15ε -30 -20 -10 0 10 20 184 185 186 187 188 189 190 191 192 193 194 ε/‰ 15ε 1 -40 -30 -20 -10 0 10 184 185 186 187 188 189 190 191 192 193 194 ε/‰ 15ε 2Fig. 4. Comparison between fractionation constants derived from theoretical predictions, direct measurements and VUV spectroscopy in the
range from 184 to 194 nm. The same symbols as in Fig. 3 have been used, but the high-resolution ZPE calculation has been omitted for clarity.
by NN-O distance and bending angle) at 1 nm resolution and therefore lack the “fine structure” seen in the ZPE predictions and VUV spectroscopic measurements (Matthew S. John-son, personal communication, 2002). The agreement with the measurements is good for14N218O and better than the
ZPE theory for14N15N16O, but15N14N16O is not adequately modelled, also as a consequence of the 2-D-PES.
6 Implications for the stratosphere and modelling
For stratospheric modelling, one now has the choice between various data sets. Considering the underestimated fractiona-tion constants of the theoretical predicfractiona-tions (except for18ε in the HP model), it seems that the linear fit through the ex-perimental data represents the wavelength dependence of ε more adequately. This fit also agrees reasonably well with the VUV spectroscopic measurements up to 197 nm. In a separate publication (Kaiser et al., 2002b), we have presented temperature dependent measurements of fractionation con-stants for broadband photolysis with the Sb lamp (median wavelength: 203 nm). At lower temperatures, the HP the-ory predictions compared slightly better to the experimental measurements than at room temperature, but were still off by more than a factor of two for15N14N16O, underscoring the remaining deficiencies of the model. However, one has to be
careful in extrapolating the derived temperature dependence to other wavelengths, e.g. values of15ε2 derived from the
VUV spectroscopic measurements at 197 nm and 213 K were identical to those for broadband photolysis at the same tem-perature and longer wavelengths. This seems to imply a con-stant value of15ε2between 197 and ≈ 203 nm, in
disagree-ment to the observed wavelength-dependence at room tem-perature. However, errors in the VUV spectroscopic cross-sections could also account for this discrepancy and cannot be entirely excluded.
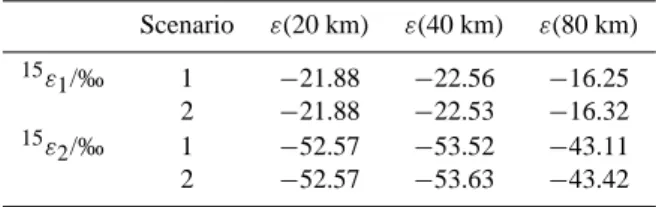
Using the validated VUV spectroscopic measurements, we can now consider additional complications for atmospheric modelling from the “oscillations” and changes of sign of ε below 190 nm. Due to the strong variation of actinic flux over narrow wavelength regions in the Schumann-Runge bands below 200 nm, this may have noticeable influences on the fractionation constants. We have therefore calculated the ex-pected fractionation constants for photolysis using actinic fluxes at 20, 40 and 80 km (US standard atmosphere, so-lar zenith angle 30◦) (Minschwaner et al., 1993). The data were averaged to about 0.1 nm resolution in the Schumann-Runge region and to about 1 nm above 200 nm. This is more than sufficient to sample the maximum and minimum val-ues of the N2O fractionation constants which occur with a
period of about 2 nm. Altitudes of 20 and 40 km are below and above the region of maximum N2O photolysis in the
Table 4. Calculated fractionation constants for N2O photolysis at
20, 40 and 80 km (US standard atmosphere, solar zenith angle: 30◦)
Scenario ε(20 km) ε(40 km) ε(80 km) 15ε 1/‰ 1 −21.88 −22.56 −16.25 2 −21.88 −22.53 −16.32 15ε 2/‰ 1 −52.57 −53.52 −43.11 2 −52.57 −53.63 −43.42
mosphere and should therefore provide limits for the frac-tionation constants. Mesospheric N2O photolysis at 80 km is
negligible, but has been included for comparison. Given the sparse database at lower temperatures, we restrict our calcu-lations to room temperature, although this is clearly not rep-resentative for the stratosphere and mesosphere. However, the vibrational structures in the N2O absorption spectrum
become less intense with lower temperatures (Selwyn and Johnston, 1981) and so should the oscillations in ε. There-fore, the room temperature calculations are a “worst-case” scenario for any interference of Schumann-Runge bands and N2O isotope fractionation. Two scenarios have been
inves-tigated: The first one was created from the high-resolution VUV spectroscopic data for15ε2and15ε1(Selwyn and
John-ston, 1981) up to 190 nm, complemented by the linear fit (Fig. 3) for higher wavelengths. In the second scenario, the linear fit is extrapolated also to wavelengths below 190 nm. For the sake of argument, the linear fit is extended in both scenarios to wavelengths up to 240 nm. Any errors thus in-troduced will be minor due to the small contribution of this wavelength range to the total N2O loss at all three altitudes.
Table 4 shows the results of the calculations.
Interestingly, the differences between scenario 1 and 2 are negligible for both fractionation constants and all altitudes. More surprising is the small altitude dependence of ε. There is barely any variation in ε at 20 km and at 40 km due to the change of actinic flux. The minute increase of |ε| with alti-tude is in line with previous qualitative considerations which postulated an increase of |ε| with altitude due to the decreas-ing influence of O3absorption in the Hartley band (Yoshida
and Toyoda, 2000). The negligible difference between sce-narios 1 and 2 is a consequence of the different spacing between individual rotational lines in the Schumann-Runge bands (≈ 175 to ≈ 200 nm) and the vibrational structure in the N2O UV absorption spectrum (≈ 170 to ≈ 190 nm).
7 Conclusions
The new photolysis measurements at 185 nm have demon-strated for the first-time heavy isotope depletions in the resid-ual gas of N2O photolysis experiments. The absorption
cross-sections of N2O species with isotopic substitutions at
the terminal positions of the molecule are larger than for the most abundant14N216O isotopologue, corresponding to an
inverse kinetic isotope effect. In contrast, isotope enrich-ments are observed at the central nitrogen position as found at longer wavelengths in other studies.
Taken together with measurements of “single wavelength photolysis” at 193.3 nm and of broadband photolysis by a D2 lamp with a median wavelength for N2O photolysis of
190 nm, these results serve to validate existing VUV spectro-scopic measurements of15N isotopomers in the wavelength range from 173 to 197 nm. However, most of the atmospheric N2O photolysis occurs at wavelengths from 195 to 205 nm,
warranting an extension of the high-resolution spectroscopic analyses of isotopically substituted N2O species to longer
wavelengths. This should cover the whole range of strato-spherically relevant temperatures (200 to 300 K) and should also include17O and18O isotopologues. For the moment, the existing experimental data can be used to create a compre-hensive view of the wavelength dependence of isotope frac-tionation in N2O photolysis. A linear fit to the data in the
range from 190 to 220 nm describes the existing measure-ments of15ε,15ε1,15ε2and18εquite well (Table 3).
An estimation of the dependence of fractionation constants on changes of actinic flux with altitude has shown that the average fractionation constants are only negligibly affected between 20 and 40 km. The contribution of isotopic frac-tionation by photolysis in the region of O2Schumann-Runge
bands can be well approximated by an extension of the linear fit derived from the photolysis experiments.
Acknowledgement. Many thanks to Ken Minschwaner for the ac-tinic flux data, to Matt Johnson for the results from the HP theory
calculations, to Mathias Richter for the D2lamp spectrum, to John
Crowley for spectroscopic measurements and to Lukas Baumgart-ner for access to the Prism II mass spectrometer. This paper also benefited from numerous useful discussions with these colleagues as well as valuable contributions from Christoph Br¨uhl, Terry Dil-lon, Ralf Dreiskemper, Abraham Horowitz, Jeff Johnston, Han-nelore Keller-Rudek, Tae Siek Rhee and Verena Trautner.
References
Brenninkmeijer, C. A. M. and R¨ockmann, T.: Russian doll type cryogenic traps: Improved design and isotope separation effects, Anal. Chem., 68 (17), 3050–3053, 1996.
Brenninkmeijer, C. A. M. and R¨ockmann, T.: Mass spectrometry of the intramolecular nitrogen isotope distribution of environmental nitrous oxide using fragment-ion analysis, Rapid Commun. Mass Spectrom., 13 (20), 2028–2033, 1999.
Cantrell, C. A., Zimmer, A., and Tyndall, G. S.: Absorption cross sections for water vapor from 183 to 193 nm, Geophys. Res. Lett., 24 (17), 2195–2198, 1997.
Cliff, S. S. and Thiemens, M. H.: High-precision isotopic
deter-mination of the18O/16O and17O/16O ratios in nitrous oxide,
Anal. Chem., 66 (17), 2791–2793, 1994.
Estupi˜n´an, E. G., Stickel, R. E., Nicovich, J. M., and Wine, P. H.:
photolysis of O3/N2/O2, J. Phys. Chem. A, 106 (24), 5880–5890, 2002.
Griffith, D. W. T., Toon, G. C., Sen, B., Blavier, J.-F., and Toth, R. A.: Vertical profiles of nitrous oxide isotopomer fractionation measured in the stratosphere, Geophys. Res. Lett., 27 (16), 2485– 2488, 2000.
Johnson, M. S., Billing, G. D., Gruodis, A., and Janssen, M. H. M.: Photolysis of nitrous oxide isotopomers studied by time-dependent Hermite propagation, J. Phys. Chem. A, 105 (38), 8672–8680, 2001.
Johnston, J. C., Cliff, S. S., and Thiemens, M. H.: Measurement
of multioxygen isotopic (δ18O and δ17O) fractionation factors
in the stratospheric sink reactions of nitrous oxide, J. Geophys. Res., 100 (D8), 16 801–16 804, 1995.
Kaiser, J., Brenninkmeijer, C. A. M., and R¨ockmann, T.:
In-tramolecular15N and18O fractionation in the reaction of N2O
with O(1D) and its implications for the stratospheric N2O
isotope signature, J. Geophys. Res., 107 (D14), 4214, doi: 10.1029/2001JD001506, 2002a.
Kaiser, J., R¨ockmann, T., and Brenninkmeijer, C. A. M.:
Tem-perature dependence of isotope fractionation in N2O
photol-ysis, Phys. Chem. Chem. Phys., 4 (18), 4220–4230, doi: 10.1039/B204837J, 2002b.
Kim, K.-R. and Craig, H.: Nitrogen-15 and oxygen-18 characteris-tics of nitrous oxide: A global perspective, Science, 262 (5141), 1855–1857, 1993.
Lanzendorf, E. J., Hanisco, T. F., Donahue, N. M., and Wennberg, P. O.: Comment on: “The measurement of tropospheric OH radicals by laser-induced fluorescence spectroscopy during the POPCORN field campaign” by Hofzumahaus et al. and “Inter-comparison of tropospheric OH radical measurements by multi-ple folded long-path laser absorption and laser induced fluores-cence” by Brauers et al., Geophys. Res. Lett., 24 (23), 3037– 3038, 1997.
Lide, D. R.: CRC Handbook of Chemistry Physics, CRC Press, Boca Raton, 1999.
McElroy, M. B. and Jones, D. B. A.: Evidence for an additional
source of atmospheric N2O, Global Biogeochem. Cycles, 10 (4),
651–659, 1996.
M´erienne, M. F., Coquart, B., and Jenouvrier, A.: Temperature
ef-fect on the ultraviolet absorption of CFCl3, CF2Cl2, and N2O,
Planet. Space Sci., 38 (5), 617–625, 1990.
Miller, C. E. and Yung, Y. L.: Photo-induced isotopic
fractiona-tion of stratospheric N2O, Chemosphere: Global Change Sci., 2,
255–266, 2000.
Minschwaner, K., Anderson, G. P., Hall, L. A., and Yoshino,
K.: Polynomial coefficients for calculating O2Schumann-Runge
cross sections at 0.5 cm−1resolution, J. Geophys. Res., 97 (D9),
10 103–10 108, 1992.
Minschwaner, K., Salawitch, R. J., and McElroy, M. B.: Absorption
of solar radiation by O2: Implications for O3 and lifetimes of
N2O, CFCl3, and CF2Cl2, J. Geophys. Res., 98 (D6), 10 543–
10 561, 1993.
Moore, H.: Isotopic measurement of atmospheric nitrogen com-pounds, Tellus, 26 (1/2), 169–174, 1974.
M¨uller, P.: Glossary of terms used in physical organic chemistry, Pure Appl. Chem., 66, 1077–1184, 1994.
Prasad, S. S.: Potential atmospheric sources and sinks of nitrous
ox-ide: 2. Possibilities from excited O2, “embryonic” O3, and
opti-cally pumped excited O3, J. Geophys. Res., 102 (D17), 21 527–
21 536, 1997.
Prather, M., Ehhalt, D., Dentener, F., Derwent, R., Dlugokencky, E., Holland, E., Isaksen, I., Katima, J., Kirchhoff, V., Matson, P., Midgley, P., and Wang, M.: Atmospheric chemistry and green-house gases, in: Climate Change 2001: The Scientific Basis: Contribution of Working Group I to the Third Assessment Re-port of the Intergovernmental Panel of Climate Change, (Eds) Houghton, J. T., Ding, Y., Griggs, D. J., Noguer, M., van der Linden, P. J., Dai, X., Maskell, K., and Johnson, C.A., pp. 239– 287, Cambridge University Press, Cambridge, United Kingdom and New York, NY, USA, 2001.
Rahn, T. and Wahlen, M.: Stable isotope enrichment in strato-spheric nitrous oxide, Science, 278 (5344), 1776–1778, 1997. Rahn, T., Zhang, H., Wahlen, M., and Blake, G. A.: Stable
iso-tope fractionation during ultraviolet photolysis of N2O,
Geo-phys. Res. Lett., 25 (24), 4489–4492, 1998.
Randeniya, L. K., Vohralik, P. F., and Plumb, I. C.: Stratospheric ozone depletion at northern mid latitudes in the 21st century: The importance of future concentrations of greenhouse gases nitrous oxide and methane, Geophys. Res. Lett., 29 (4), 4, 2002. Rayleigh, J. W. S.: Theoretical considerations respecting the
sepa-ration of gases by diffusion and similar processes, Philos. Mag., S. 5, 42, 493–498, 1896.
Reader, J., Sansonetti, C. J., and Bridges, J. M.: Irradiances of spec-tral lines in mercury pencil lamps, Appl. Opt., 35 (1), 78–83, 1996.
R¨ockmann, T., Brenninkmeijer, C. A. M., Wollenhaupt, M., Crow-ley, J. N., and Crutzen, P. J.: Measurement of the isotopic
frac-tionation of15N14N16O,14N15N16O and14N14N18O in the UV
photolysis of nitrous oxide, Geophys. Res. Lett., 27 (9), 1399– 1402, 2000.
R¨ockmann, T., Kaiser, J., Brenninkmeijer, C. A. M., Crowley, J. N., Borchers, R., Brand, W. A., and Crutzen, P. J.: The isotopic
enrichment of nitrous oxide (15N14NO,14N15NO,14N14N18O)
in the stratosphere and in the laboratory, J. Geophys. Res., 106 (D10), 10 403–10 410, 2001.
Sansonetti, C. J., Salit, M. L., and Reader, J.: Wavelengths of spec-tral lines in mercury pencil lamps, Appl. Opt., 35 (1), 74–77, 1996.
Saueressig, G.: Bestimmung von kinetischen Isotopentrennfaktoren in den atmosph¨arischen Methanabbaureaktionen, Ph. D. thesis, Johannes-Gutenberg-Universit¨at, Mainz, 1999.
Selwyn, G., Podolske, J., and Johnston, H. S.: Nitrous oxide ultravi-olet absorption spectrum at stratospheric temperatures, Geophys. Res. Lett., 4 (10), 427–430, 1977.
Selwyn, G. S. and Johnston, H. S.: Ultraviolet absorption spectrum of nitrous oxide as function of temperature and isotopic substitu-tion, J. Chem. Phys., 74 (7), 3791–3803, 1981.
Sowers, T., Bender, M., and Raynaud, D.: Elemental and isotopic
composition of occluded O2 and N2 in polar ice, J. Geophys.
Res., 94 (D4), 5137–5150, 1989.
Toyoda, S. and Yoshida, N.: Determination of nitrogen isotopomers of nitrous oxide on a modified isotope ratio mass spectrometer, Anal. Chem., 71 (20), 4711–4718, 1999.
Toyoda, S., Yoshida, N., Suzuki, T., Tsuji, K., and Shibuya, K.: Isotopomer fractionation during photolysis of nitrous oxide by ultraviolet of 206 to 210 nm, in: International Conference on the Study of Environmental Change Using Isotope Techniques,
edited by IAEA, International Atomic Energy Agency, Vienna, Austria, 2001a.
Toyoda, S., Yoshida, N., Urabe, T., Aoki, S., Nakazawa, T.,
Sug-awara, S., and Honda, H.: Fractionation of N2O isotopomers in
the stratosphere, J. Geophys. Res., 106 (D7), 7515–7522, 2001b. Turatti, F., Griffith, D. W. T., Wilson, S. R., Esler, M. B., Rahn,
T., Zhang, H., and Blake, G. A.: Positionally dependent15N
fractionation factors in the UV photolysis of N2O determined by
high resolution FTIR spectroscopy, Geophys. Res. Lett., 27 (16), 2489–2492, 2000.
Umemoto, H.:14N/15N isotope effect in the UV photodissociation
of N2O, Chem. Phys. Lett., 314, 267–272, 1999.
Watson, R. T., Meira Filho, L. G., Sanhueza, E., and Janetos, A.: Greenhouse gases: Sources and sinks, in: Climate Change: The IPCC Scientific Assessment, (Eds) Houghton, J.T., Callander, B. A., and Varney, S. K., pp. 29–46, Cambridge University Press, Cambridge, UK, 1992.
Watson, R. T., Rodhe, H., Oeschger, H., and Siegenthaler, U.: Greenhouse gases and aerosols, in: Climate Change: The IPCC Scientific Assessment, (Eds) Houghton, J. T., Jenkins, G. J., and Ephraums, J. J., pp. 5–40, Cambridge University Press, New York, 1990.
Williamson, J. H.: Least-squares fitting of a straight line, Can. J.
Phys., 46, 1845–1847, 1968.
Wingen, L. M. and Finlayson-Pitts, B. J.: An upper limit on the
production of N2O from the reaction of O(1D) with CO2in the
presence of N2, Geophys. Res. Lett., 25 (4), 517–520, 1998.
WMO: Scientific Assessment of Ozone Depletion: 1998. Global Ozone Research and Monitoring Project, 732 pp., World Meteo-rological Organization, Geneva, Switzerland, 1999.
York, D.: Least-squares fitting of a straight line, Can. J. Phys., 44 (5), 1079–1086, 1966.
Yoshida, N. and Toyoda, S.: Constraining the atmospheric N2O
budget from intramolecular site preference in N2O isotopomers,
Nature, 405, 330–334, 2000.
Yoshino, K., Freeman, D. E., and Parkinson, W. H.: High resolution
absorption cross section measurements of N2O at 295–299 K in
the wavelength region 170–222 nm, Planet. Space Sci., 32 (10), 1219–1222, 1984.
Yung, Y. L. and Miller, C. E.: Isotopic fractionation of stratospheric nitrous oxide, Science, 278 (5344), 1778–1780, 1997.
Zhang, H., Wennberg, P. O., Wu, V. H., and Blake, G. A.:
Frac-tionation of14N15N16O and 15N14N16O during photolysis at
213 nm, Geophys. Res. Lett., 27 (16), 2481–2484, 2000. Zipf, E. C.: A laboratory study on the formation of nitrous oxide
by the reaction N2(A3P+u) +O2 → N2O + O, Nature, 287,