Bipartite networks provide new
insights on international trade markets
The MIT Faculty has made this article openly available.
Please share
how this access benefits you. Your story matters.
Citation
Fernandez, Maximiliano, Javier Galeano, and Cesar Hidalgo.
“Bipartite Networks Provide New Insights on International Trade
Markets.” NHM 7, no. 3 (September 2012): 399–413. © 2012
American Institute of Mathematical Sciences
As Published
http://dx.doi.org/10.3934/nhm.2012.7.399
Publisher
American Institute of Mathematical Sciences (AIMS)
Version
Final published version
Citable link
http://hdl.handle.net/1721.1/92266
Terms of Use
Article is made available in accordance with the publisher's
policy and may be subject to US copyright law. Please refer to the
publisher's site for terms of use.
c
American Institute of Mathematical Sciences
Volume 7, Number 3, September 2012 pp. 399–413
BIPARTITE NETWORKS PROVIDE NEW INSIGHTS ON INTERNATIONAL TRADE MARKETS
Maximiliano Fernandez
Grupo de Sistemas Complejos Universidad Polit´ecnica de Madrid, Spain
Javier Galeano
Grupo de Sistemas Complejos E.U.I.T Agr´ıcola
Universidad Polit´ecnica de Madrid, Spain
Cesar Hidalgo
The Media Laboratory Massachusetts Institute of Technology
Cambridge, MA, USA
Abstract. Adam Smith is considered the father of modern economics. His research on the Wealth of Nations [10] is the first scientific work that theo-rized about the complexity of economic systems and how an invisible hand self-regulates markets and their behavior. In this way, we study international trade markets as complex networks. We analyze their topological properties, structure and temporal dynamics based on actual data. Our main premise states that trade networks are bipartite in nature because importers and ex-porters play a different role in the system. We apply a methodology developed for mutualistic ecosystems, finding minor gaps in it. We address such gaps by using well-known techniques from other related scientific work. The evidence supports the fact that our premise is a realistic hypothesis.
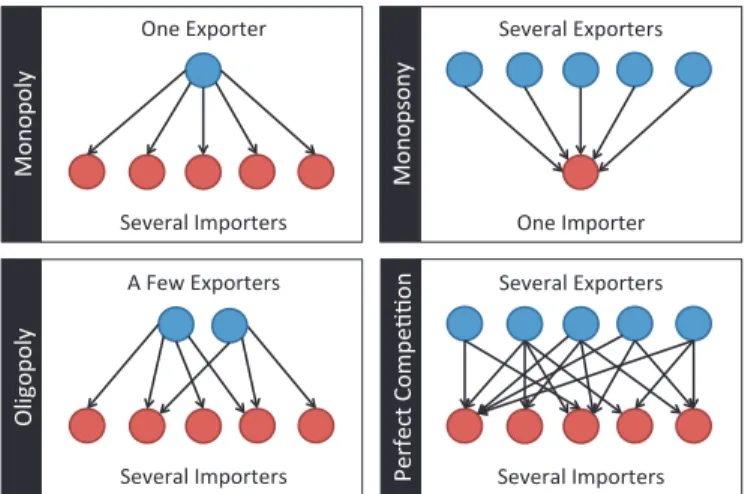
1. Introduction. Economists often take for granted the microeconomic theory and, in particular, the market theory. Although Adam Smith has already explained free market behavior [10] more than two centuries ago, our understanding of such behavior is still a high-level explanation. In contrast to the way that physicists un-derstand the relationship between pressure and volume of an ideal gas, economists sometimes underestimate the complexity of market structure on a low-level per-spective. Unlike physical phenomena, economic systems do not always follow a set of well-defined laws. For instance, economic systems tend to change their configu-ration and rules whenever a crisis appears. But under certain conditions, like those we find in international markets, complex network analysis may be of great help to provide new insights on economic complexity and an opportunity to potentially expand market theory. After all, the microeconomic theory does describe the ba-sic markets in such a way that network graphs may easily be used to depict them (Figure 1).
One of the earliest scientific work on trade networks as a complex networks is that of Serrano and coworkers [8, 9]. These papers studied the commodity trade as a directed and unweighted complex network. The trade network in these papers
2000 Mathematics Subject Classification. Primary: 58F15, 58F17; Secondary: 53C35. Key words and phrases. Complex networks, economics, markets, mutualism, Bipartite netwoks.
!"#$%&'()*#)$ +#,#)-.$/0'()*#)1$ +#,#)-.$%&'()*#)1$ !"#$/0'()*#)$ 2$3#4$%&'()*#)1$ +#,#)-.$/0'()*#)1$ +#,#)-.$%&'()*#)1$ +#,#)-.$/0'()*#)1$ 5( "( '( .6 $ 5( "( '1( "6 $ !. 78 ( ' ( .6 $ 9# ):# ;* $<( 0 '# = = ( "$
Figure 1. We show the basic markets as defined by the microeco-nomic theory through network graphs. We observe that the exis-tence of highly connected nodes may indicate the presence of either a monopoly or a monopsony. Perfect competition is, in turn, an ideal case where agents have no power over the rest or the market itself.
was built upon the forty most important products in the year 2000. The conclusions of these papers suggest that trade networks are scale-free in nature, present a high clustering coefficient and have an assortative behavior as well. Further study was performed in order to address other topological aspects of trade networks. For instance, G. Fagiolo et al. [4] introduced a weighted analysis of trade networks. In this case, trade networks were also studied as weighted, and at the same time, directed complex networks. Similar topological conclusions can be identified.
However, the evidence extracted from the weighted analysis provides a set of new findings about trade networks. First, weight distribution generate a core-periphery structure due to the existence of a group of highly-connected countries where the majority of the trade takes place. Secondly, rich countries have much more intense trade links, and are more clustered than are poor countries. This study also introduced a temporal evolution analysis of trade networks 1981 to 2000. Another previous study deals with the rewiring of trade networks. Squartini et al. [11,12] has two parts. Part 1 deals with binary (non-weighted) networks and it does both undirected and directed analysis of trade networks. Part 2 is quite similar in the methodological approach, but it works on weighted networks. Both studies provided a view of unipartite-type networks and their conclusions suggest that more emphasis should be put upon the topology of trade network. This topology, by itself, is fully explained by the typical indicators proposed by the paper.
Now, even though this is not the first scientific work about trade networks, it is the first one to propose a bipartite approach, a key and distinctive aspect. We take this position since the importers and the exporters of a given product play different roles in the topology. For instance, the way exporters are connected to importers is based on a different decision-making process than that of the importers. We believe this is a sufficiently powerful reason to adopt the bipartite approach. We
also conduct a weighted study of these networks and test the bipartite hypothesis throughout the study.
2. Data analysis. We count on actual information about global product trading. This data is based on the United Nations Commodity Trade Statistics Database (UN comtrade) [13]. It includes 5039 products and 297 countries from 1995 to 2009, accounting for 127 trillion dollars in trade volume and 9×10⁷ links in that period.
This data is normalized due to reporting inconsistencies as well. We also build our trade networks based on the premise that, for them to be actually bipartite, each node is a combination of a country and a role. Hence, if a country is both an exporter and an importer of a given product, two different nodes will be added to the network, although this is rarely observed.
We apply the key bipartite indicators to a selection of this data. This set of bipar-tite indicators include: a) the degree distribution P (k), b) the strength-degree cor-relation S(k), c) the nearest-neighbor degree distribution Knn(k), d) the weighted and unweighted bipartite clustering distribution C4b(k) and C4bw(k), and e) the
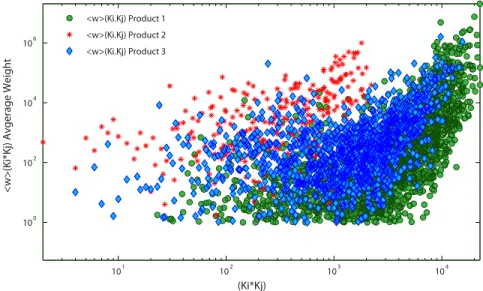
average weight as a function of the end-point degree hwi(ki ∗ kj) [2,5]. The follow-ing table shows a formal description of each indicator and their form for exporters and importers.
Equation
Indicator For exporters For importers
Node degree kj =Piaij ki=Pjaij S(k) Correlation sj =Piaijwij si=Pjaijwij Knn(k) Distribution s1 j PN i=1aijwijki s1 i PN j=1aijwijkj C4b(k) Clustering qj knn j Kj(kj− 1)/2 qi knn i Ki(ki− 1)/2 C4bw(k) (Weighted) P m,nqjmn(e wjm+wejn 2 ) knn j Kj(kj− 1)/2 P m,nqimn(e wim+wein 2 ) knn i Ki(ki− 1)/2
Table 1: Main formulas to compute the key bipartite indicators as described by Gilarranz et al. [5]
In the trade network at link level, the trade volume for each link is not uniformly distributed; in fact, few links in the network hold the majority of the trade volume. As a consequence, the countries involved in these links constitute the main compo-nent of a trade network. In this way, we create two scenarios based on the concept of Revealed Competitive Advantage index (RCA) [1,6].
It is defined as the ratio of the exports share of the product in a country to the share of total exports of a product in the world, which is defined by the expression:
RCA = x(c, i)/ P ix(c, i) P cx(c, i)/ P c,ix(c, i) ; (1)
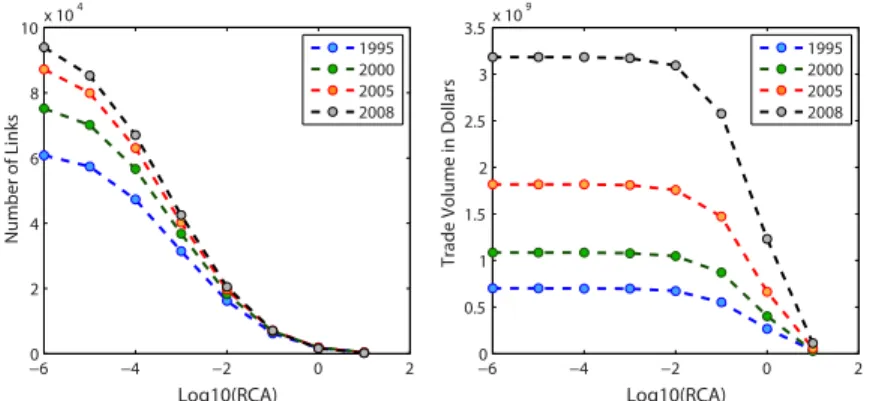
where the term x(c, i) is the exported value for product i in country c. The RCA serves as a link filter, which enables us to separate the core from the periphery of a trade network. Moreover, the number of links as a function of the RCA follows a
lognormal distribution. In figure 2, we present the results as a function of the RCA in terms of number of links and trade volume in dollars.
−60 −4 −2 0 2 2 4 6 8 10x 10 4 Log10(RCA) Number of Links −60 −4 −2 0 2 0.5 1 1.5 2 2.5 3 3.5x 10 9 Log10(RCA)
Trade Volume in Dollars
1995 2000 2005 2008 1995 2000 2005 2008
Figure 2. The figure on the left show the number of links that remain active as a function of the RCA for 35 selected products. As a result, virtually all links are active for a condition of RCA >= 10−6. In contrast, nearly all links are inactive when RCA >= 1. The figure on the left displays the trade volume in thousand dollars with the same methodology. Different colors show a selection of years.
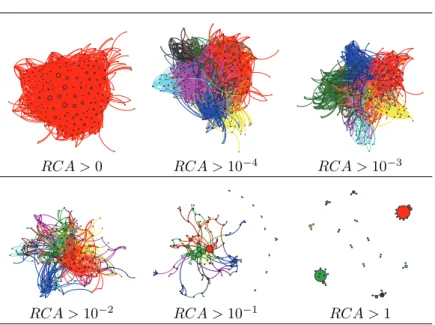
In this way, we show the evolution of a network from a condition with no RCA filter to another one with strong RCA filter. In figure 3, we observe how the link elimination process allow us to approach the core in the network, getting rid of the periphery and preserving the most important links for a selected product, beer in 2005. But when we continue to increase the filter value, we find that the network no longer exists for values of RCA higher than 1. Based on our analysis, only 50 percent of the links remain active when setting a filter of RCA >= 10−3. However, 99.5 percent of the trade volume is still active in the remaining links, demonstrating that this criterion is an effective filter to separate the core from the periphery of a trade network. In addition, we perform a selection process and define a sample of 35 highly representative products. After that, we repeat the experiment for each selected product, for each year, and for two scenarios. In this study, a scenario will be consistent with a given condition of RCA filter, namely, RCA >= 0 (no filter) and RCA >= 10−3 (filter applied).
3. Results. First of all, we process the network graphs for our 35 selected products (each selected product) and then we apply the RCA filter, repeating the procedure for each period.
3.1. The degree distribution P(k). When computing the degree distribution for both the exporters and importers, we realize that such distributions follow het-erogeneous patterns. In Figure 4, we show the degree distribution for the importers and exporters, taking in account all products and all periods. The subsets show a different behavior. In the subset of exporters, the best fit is obtained with a power
RCA > 0 RCA > 10−4 RCA > 10−3
RCA > 10−2 RCA > 10−1 RCA > 1
Figure 3. Figure 3. Evolution of a trade network to a selected product, beer in 2005, when RCA is a set to filter the less relevant links. We use the software Gephi v0.8 [13] to create the graph visualization [3] 106 107 105 104 103 102 101 100 100 101 102 k N ( K > k ) distr
ibution Exporters - All Products
Importers - All Products
Figure 4. We show the cumulative degree distribution for the exporters and importers for all products and all years. Exporters and importers show different behaviors. Solid lines represent the best fit. The best fit in the case of the exporters is a power law distribution, but in the case of the importers, the best fit is a truncated power law.
law distribution, whereas the best fit for the importers is a truncated power law of the form P (k) ∼ k−γe−k/kc.
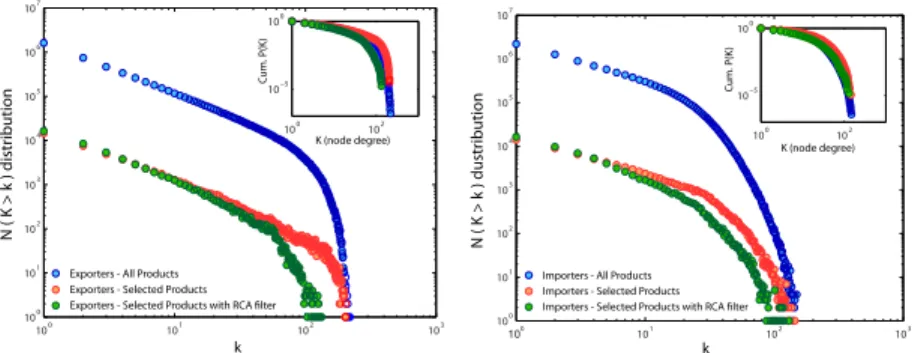
In addition, we also compute the same results for the 35 selected products. Then, we apply the RCA filter, repeating the procedure for each period. In Figure 5 we show the cumulative degree distribution for importers and exporters. In both of them, we show the distribution for all products, for the 35 selected products, and for these selected products filtered with a value of RCA of 10−3. In the inset of Figure 5, we show the cumulative, normalized distribution. In both cases, the behavior of the distributions do not show significative differences.
100 101 102 103 100 101 102 103 104 105 106 107 100 102 10−5 100 k N ( K > k ) distr ibution
Exporters - All Products Exporters - Selected Products Exporters - Selected Products with RCA filter
Cum. P(K ) K (node degree) 100 101 102 103 100 101 102 103 104 105 106 107 100 102 10−5 100 k N ( K > k ) dustr ibution Cum. P(K ) K (node degree)
Importers - All Products Importers - Selected Products Importers - Selected Products with RCA filter
Figure 5. We show the accumulative degree distribution for: all products, 35 selected products and these products with a RCA filter with RCA filter for the exporters (on the left) and for the importers (on the right). Insets show the normalized accumulative degree distributions
We propose an idea regarding the robustness of trade networks and its implica-tions in terms of economic theory. If P(k) comes down abruptly, then it means that we will not find any highly-connected node or hub in a trade network. By implica-tion, this provides such a network a condition of high robustness to either directed or random attacks. In addition, we have already implied, in the introduction, that the existence of a hub in a trade network would be consistent with the presence of either a monopoly or a monopsony. Hence, a P(k) that shows a tail that comes down normalized is also a piece of evidence about the way in which international trade markets are organized. This suggests that a trade market will be organized so that no monopoly or monopsony is allowed in the topology. This fact, in addition to the fact that the exporters and the importer have quite different distributions, are the key findings that are enabled by using this methodology.
3.2. The strength-degree correlation S(k). In addition to the previous idea regarding monopolies and monopsonies in trade networks, it is relevant to evaluate the effect of link strength or weights in the bipartite matrix. And, indeed, our anal-ysis uses a weighted approach by design. But, on the other hand, what conclusions can we draw from this fact?
To answer this question, we use the strength-degree correlation or S(k), a stan-dard measurement in weighted networks [2]. In this case, we also compute the S(k) for the importers and the exporters in a separate way. Thus, we find that the S(k) in trade networks follow a power law pattern of the form S(k) ∼ kβ. Figure 6 shows the S(k) for the 3 products as examples.
100 101 102 101 102 103 104 105 106
107 S(k) Prod 1Fit Prod 1
S(k) Prod 2 Fit Prod 2 S(k) Prod 3 Fit Prod 3 100 101 102 101 102 103 104 105 106 107 k k S(k) S tr ength-deg ree c or rela tion S(k) S tr ength-deg ree c or rela tion S(k) Prod 1 Fit Prod 1 S(k) Prod 2 Fit Prod 2 S(k) Prod 3 Fit Prod 3 R = 0,8289 (Prod1) R = 0,8147 (Prod2) R = 0,7955 (Prod3) 2 2 2 R = 0,7697 (Prod1) R = 0,8523 (Prod2) R = 0,8175 (Prod3) 2 2 2
Figure 6. We show the strength-degree correlation with no filter for the exporters (right) and the importers (left). Product 1 = Computers, Product 2 = Soya-bean oil, and Product 3 = Beer. (We use the same examples throughout the article). Dashed lines show the best fit for our data. Every case shows a power law correlation as the best fit for the data.
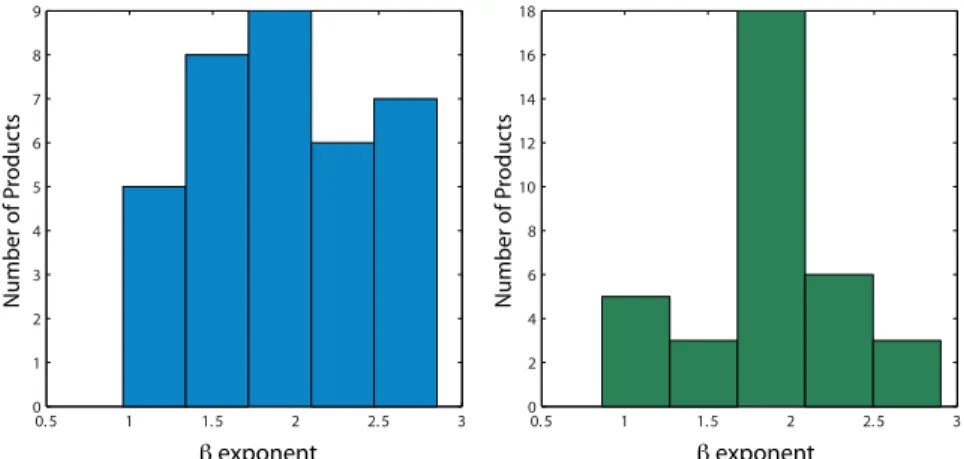
The β exponents of the S(k) correlation in trade networks are higher than 1, reaching values up to 3. This is not a trivial fact, for it proves that the trade volume is not randomly distributed across the nodes. Instead, it follows a close relationship with the node degree. In figure 7, we show the histogram of the β exponents for exporters and importers.
0.5 1 1.5 2 2.5 3 0 1 2 3 4 5 6 7 8 9 0.5 1 1.5 2 2.5 3 0 2 4 6 8 10 12 14 16 18 β exponent β exponent Number of P roduc ts Number of P roduc ts
Figure 7. We show the strength-degree correlation with RCA fil-ter implemented for the exporfil-ters (right) and the imporfil-ters (left). They are all obtained with a power law type of behavior.
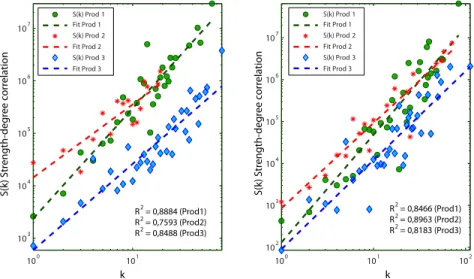
As previously mentioned, the typical value of β is higher than 1 in both the exporters and the importers. Only a few products remain close to the random case or (β = 1). This evidence provides the basis for further arguments about the topology of trade networks, which is later presented on the Discussion section. In addition, Figure 8 depicts the behavior of S(k) after the RCA filter has been applied. The β exponents are similar in value, but the errors decline while the correlation coefficients increase, making these exponents a much more representative picture of the core in trade networks.
100 101 103 104 105 106 107 100 101 102 102 103 104 105 106 107 k k S(k) S tr ength-deg ree c or rela tion S(k) S tr ength-deg ree c or rela tion R = 0,8884 (Prod1) R = 0,7593 (Prod2) R = 0,8488 (Prod3) 2 2 2 R = 0,8466 (Prod1) R = 0,8963 (Prod2) R = 0,8183 (Prod3) 2 2 2 S(k) Prod 1 Fit Prod 1 S(k) Prod 2 Fit Prod 2 S(k) Prod 3 Fit Prod 3 S(k) Prod 1 Fit Prod 1 S(k) Prod 2 Fit Prod 2 S(k) Prod 3 Fit Prod 3
Figure 8. We show the strength-degree correlation with RCA fil-ter implemented for the exporfil-ters (right) and the imporfil-ters (left). The exponents are βprod1= 2.10, βprod2= 1.39; βprod3 = 1.64 for
the exporters, and βprod1 = 2.57, βprod2 = 2.03; βprod3 = 2.12 for
the importers.
3.3. The nearest-neighbor degree distribution Knn(k). The P(k) and S(k) provide good information about the topology structure. We compute now the nearest-neighbor degree distribution, which is an effective measurement of how nodes interconnect themselves to others. In contrast to the previous indicators, the Knn(k) distribution shows a mixed behavior across the different products. In some cases, the patterns in Knn(k) are still consistent with a power law of the form Knn(k) ∼ kν [2]. Figure 9 depicts the distributions for the 3 products as an
exam-ple. In these examples, it is not clear the power law distribution, but an assortative behavior seems to suggest that higher Knn values in higher degrees.
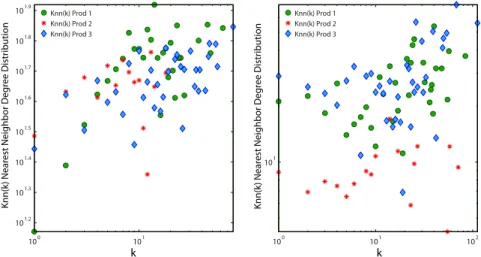
We also find that the RCA is critical to Knn(k), changing the results when the filter is implemented. Moreover, the evidence suggests the nodes in the core of a trade network are more likely to be assortative than are those in the periphery.
An assortative behavior is a reasonable finding within an economic system such as trade networks. It means that the nodes of a trade network, depending on their own degree, tend to connect to other nodes that are, at least, as equally connected in terms of node degree. This finding can also be appreciated from a distribution
100 101 102 102 100 101 102 101 102 Knn(k) Prod 1 Knn(k) Prod 2 Knn(k) Prod 3 k k Knn(k) Near est Neighbor D eg ree Distr ibution Knn(k) Near est Neighbor D eg ree Distr ibution Knn(k) Prod 1 Knn(k) Prod 2 Knn(k) Prod 3
Figure 9. We show the Knn(k) distribution without RCA filter for the exporters (right) and the importers (left).
standpoint. Consequently, the Figure 10 shows the Knn(k) results when the RCA filter is active. 100 101 101.2 101.3 101.4 101.5 101.6 101.7 101.8 101.9 100 101 102 101 Knn(k) Prod 1 Knn(k) Prod 2 Knn(k) Prod 3 Knn(k) Prod 1 Knn(k) Prod 2 Knn(k) Prod 3 k k Knn(k) Near est Neighbor D eg ree Distr ibution Knn(k) Near est Neighbor D eg ree Distr ibution
Figure 10. We show the Knn(k) distribution with RCA filter im-plemented for the exporters (right) and the importers (left).
But this is not the only aspect or indicator that measures the way in which nodes in trade networks connect to each other, we also need to review the results of the bipartite clustering.
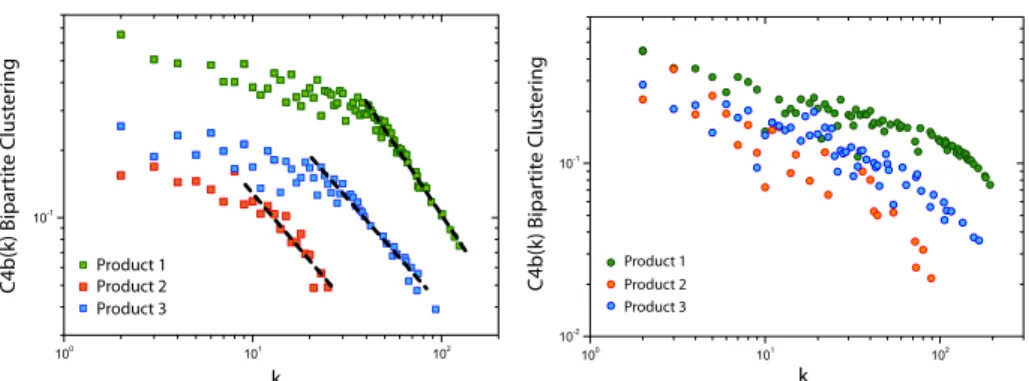
3.4. The bipartite clustering distribution C4b(k) and C4bW(k). We use the clustering distribution, from an economic standpoint, as an indicator of the tendency to form connectivity clusters within the market structure or topology. In that sense, we compute the C4b(k) distribution, which is an unweighted indicator. In Figure 11, we show the results of the 3 products we use as example.
k C4b(k) Bipar tit e Clust er ing Product 1 Product 2 Product 3 k C4b(k) Bipar tit e Clust er ing Product 1 Product 2 Product 3
Figure 11. We show the unweighted C4b(k) distribution without RCA filter for the exporters (left) and the importers (right). In this case, we observe different behavior between exporters and im-porters. In the exporters, two different regimes can be observed. The solid lines show the best fits with power laws distributions only in the last regimes.
On a first approach to analyzing the form of the clustering distribution, we find two different and distinct behaviors. In the exporters, the first one is for low values of node degree and the second one can be found where a sudden change in the exponent takes place. From that value of node degree, which is particular for each product, we have obtained the best fit with a power law distribution of the form C4b(k) ∼ kπ. In the Figure 11, the exponents for the best fits for the three products
are: −1.3 ± 0.3, −0.99 ± 0.11, and −0.96 ± 0.04, (with r2 of 0.99, 0.93, and 0.98,
respectively). In the importers, the value of the clustering decrease monotonously with the degree.
The evidence in the clustering behavior suggests that, in general, a low degree node tend to form much more dense clusters than those in high degree nodes. The implications of this fact are later argued in the discussion section. Then, we also compute the weighted clustering distribution, which is shown in Figure 12. The behavior is similar to that of the unweighted case. We also observe a dual behavior in terms of exponent values.
In Figure 13, we show the ratio between weighted and unweighted clustering for the product 1 as example. We observe the the ratio of the weighted to the unweighted clustering is higher as the node degree grows larger. In this figure, we have plotted the ratio C4bw/C4b (green squares in Figure 13), which increases for larger values of node degree.
In this case, we also compute the bipartite clustering after the RCA filter is im-plemented. Now, although this was demonstrated to be very useful for previous network indicators, it is barely useless when it comes to clustering measurement. The RCA filter inactivates a considerable amount of links, extracting relevant in-formation for the clustering calculation in particular.
3.5. The average weight as a function of the end-point degree. In weighted networks, not all interactions have the same weight. Are links connected between high-degree countries stronger than those connected between low-degree countries? One way to answer this question is to calculate the dependence of the weight on
k C4b w(k) W eigh ted Bipar tit e Clust er ing Product 1 Product 2 Product 3 k C4b w(k) W eigh ted Bipar tit e Clust er ing Product 1 Product 2 Product 3
Figure 12. We show the weighted C4bW(k) distribution for the exporters (left) and the importers (right) for the same products. The plotted solid lines represent the best fits with a power law distribution. The exponents are: −0.7 ± 0.2 and −0.49 ± 0.05 (with the r2values of 0.98 and 0.89, respectively)
k
C4b(k) ; C4b
w(k) ; [ C4b
w / C4b ]
C4b - Prod 1 C4bw - Prod 1 C4bw/C4b Prod 1Figure 13. We show the weighted clustering C4bW(k) distribu-tion and the unweighted clustering C4b for the exporters for Prod-uct 1. The black squares represent the C4b, the red squares rep-resent the C4bW, and the green squares reprep-resent the ratio of the weighted to the unweighted clustering.
the end-point degree, ki˙kj[2]. Thus, we compute the values and present the results
in Figure 14. In some cases, this indicator can be approximated through a power law function of the form hwi ∼ (KiKj)θ.[2]. If the exponent θ is greater than 0, there is a positive correlation between end-point degree and the average weight of a link. Therefore, highly-connected countries tend to be linked through stronger interactions. In Figure 14, this behavior can be only suggested to high values of
end-point degree. For low values of end-point degree, the θ exponent could be approximately zero in contrast.
101 102 103 104 100 102 104 106 <w>(Ki.Kj) Product 1 <w>(Ki.Kj) Product 2 <w>(Ki.Kj) Product 3 (Ki*Kj)
<w>(Ki*Kj) Avgerage Weight
Figure 14. We show the average weight as a function of the end-point degree for the 3 products as example.
In Figure 15, we also show the distribution after the RCA filter is implemented. We observe that the same type of behavior seems to remain present when applying this filter. 100 101 102 103 101 102 103 104 105 106 107 <w>(Ki.Kj) Product 1 <w>(Ki.Kj) Product 2 <w>(Ki.Kj) Product 3 (Ki*Kj)
<w>(Ki*Kj) Avgerage Weight
Figure 15. We show the average weight as a function of the end-point degree with RCA filter for the 3 products as example.
4. Discussion and conclusions. Our goal for this study was related to a combi-nation of two science fields, complex networks and economics. Working upon a few premises, we needed to test and validate these assumptions through hard data and consistent results.
The first premise was related to the bipartite approach. We have argued that exporters, on one hand, and importers, on the other hand, have intrinsically different roles in the topology and that this is mainly due to the nature of the decisions they make when connecting to other nodes or trade partners. The evidence supports this approach since most of the topology indicators consistently show a clear difference in the behavior of exporters and importers.
We have also arrived to define the bipartite approach from mutualistic ecological networks [5]. In this case, the bipartite approach shows a particular ecological interaction: mutualism. This behavior depicts the interactions of mutual benefit between species in a community. For example, a set of animals, pollinators, interacts with another set of plants, hosts, but there are not interactions within sets. In our case, the bipartite approximation shows a different way to explore different rules of the International Trade Market.
Our second premise was the implementation of two scenarios. Even though this approach was found to be useful by Hidalgo et al. (2007), the level of information in this work required us to readapt the concept of the revealed competitive advantage, or RCA, to our dataset. We believe that the use of an economy-based filter has been a good choice, not only because it enabled us to effectively separate the core from the periphery of a trade network, but also because it has showed a more comprehensive view of the various distributions, increasing the correlation coefficients, decreasing the errors, and revealing new power law patterns in some cases.
Now, in order to account for our last premise, a weighted network approach, we propose a set of arguments that are also related to the economic side of this study. First of all, we find that the form of the degree distribution in trade networks, when consolidating a large sample of products, is a truncated power law. This fact is a distinct aspect in terms of network topology and structure. The evidence shows that, indeed, there are no extremely connected hubs in a trade network. We believe this is not the result of a random process, but rather the result of an emergent phenomenon. The microeconomic theory teaches us about the concept of profit maximization. This principle states that a firm or a person will always act so that its own gain can be maximized. In this way, it is fair to presume that a trade market is created and works upon self-interest. Then, it is interesting to realize that, although each exporter and importer will try to obtain the greatest benefit, the market will reach an equilibrium over time and organize itself so that no monopoly or monopsony exist.
Secondly, from our examples, it is possible to appreciate the intricate relationship between weights and topology when characterizing the world trade market. The weighted nature of our trade networks has also provided valuable new insights on market structure. As previously stated, the β exponents in the majority of the products are much higher than β = 1, a case in which the weights are randomly distributed across the nodes. This fact cannot be the result of a random process. Instead, we find an alternative view. Let us assume an early stage when a new market is being created. Each exporter has a probability of attracting importers, which is likely to be a function of the comparative advantage of its own product. Then, the exporter whose product has the greatest price-quality relationship will
be more likely to attract importers. Since the exporter works upon self-interest and assuming an unbiased bargaining process, he will decide to sell its product to the importer that offers to buy the greatest quantity at the market price. Thus, the exporter will start attracting more and more importers, becoming a highly connected node in the network and giving priority to those importers with the highest trade volume. This simple process, although highly simplified, may well explain the values of the β exponents. It also means that, in trade networks, the rich does get richer.
Thirdly, and regarding the nearest-neighbor degree distribution, we find an eco-nomic meaning in an assortative behavior. As previously proposed, a positive ν exponent supposes that a node with a given degree will tend to connect to trade partners of the same or higher degree. This, in addition to a negative clustering ex-ponent, provides evidence to support a selective behavior of the economic agents in trade networks. This means not only that an importer tries to connect to exporters of higher degree, but also that the more connected an exporter is, the less likely it is to form clusters at the same time. In this way, the ratio of the weighted to the unweighted clustering increases with the degree of the countries. This behavior could indicate the market is more clustered around countries with larger degree as well. This may well be another emergent behavior that makes it very hard for small agents to succeed and increase its trade volume. This selectivity may be not only a consequence of self-interest and competition, but also a concept that requires further analysis in future scientific work.
In sum, we believe our study provides new insights to both complex network and economic theory. And although some of the conclusions are previously described by related work, our bipartite methodology does increase the level of details to analyze a trade network and take full advantage of this bipartite approach, concluding that a combined (weighted and bipartite) analysis is a valuable and suitable option for problems of economic nature. Finally, we acknowledge that the study of the dynamics in trade networks with our weighted and bipartite methodology is still an opportunity. We will continue to develop this methodology, looking for more findings and new conclusion in the near future.
Acknowledgments. This work was funded by project PGUI of the Comunidad de Madrid MODELICO-CM/S2009ESP-1691.
REFERENCES
[1] B. Balassa,Comparative advantage in manufactured goods: A reappraisal, Rev. Econ. Stat., 68 (1986), 315–319.
[2] A. Barrat, M. Barthelemy, R. Pastor-Satorras and A. Vespignani,The architecture of complex weighted networks, Proc. Nat. Acad. Sci., 101 (2004), 3747–3752.
[3] M. Bastian, S. Heymann and M. Jacomy, “Gephi: An Open Source Software for Exploring and Manipulating Networks,” International AAAI Conference on Weblogs and Social Media, 2009.
[4] G. Fagiolo, J. Reyes and S. Schiavo,World-trade web: Topological properties, dynamics and evolution, Phys. Rev. E, 79 (2009), 036115.
[5] L. J. Gilarranz, J. M. Pastor and J. Galeano,The architecture of weighted mutualistic net-works, Oikos, 121 (2012), 1154–1162.
[6] C. A. Hidalgo, B. Klinger, A. L. Barab´asi and R. Hausmann,The product space conditions the development of nations, Science, 317 (2007), 482–487.
[7] P. G. Lind, M. C. Gonz´alez and H. J. Herrmann, Cycles and clustering in bipartite networks, Physical Review E, 72 (2005), 056127.
[8] M. A. Serrano and M. Borguna,Topology of the world trade web, Phys. Rev. E, 68 (2003), 015101(R).
[9] M. A. Serrano, M. Borguna and A. Vespignani, Patterns of dominant flows in the world trade web, J. Econ. Interac. Coord., 2 (2007), 111–124.
[10] A. Smith, “An Inquiry Into The Nature And Cause Of The Wealth of Nations,” W. Strahan and T. Cadell, London, 1776.
[11] T. Squartini, G. Fagiolo and D. Garlaschelli,Randomizing world trade. I. A binary network analysis, Phys. Rev. E, 84 (2011), 046117.
[12] T. Squartini, G. Fagiolo and D. Garlaschelli,Randomizing world trade. II. A weighted network analysis, Phys. Rev. E, 84 (2011), 046118.
[13] “United Nations Commodity Trade Statistics Database (UN Comtrade),” 2011. Available from: http://comtrade.un.org/db/.
Received December 2011; revised June 2012.
E-mail address: [email protected]
E-mail address: [email protected]