Publisher’s version / Version de l'éditeur:
Vous avez des questions? Nous pouvons vous aider. Pour communiquer directement avec un auteur, consultez la Questions? Contact the NRC Publications Archive team at
PublicationsArchive-ArchivesPublications@nrc-cnrc.gc.ca. If you wish to email the authors directly, please see the first page of the publication for their contact information.
https://publications-cnrc.canada.ca/fra/droits
L’accès à ce site Web et l’utilisation de son contenu sont assujettis aux conditions présentées dans le site LISEZ CES CONDITIONS ATTENTIVEMENT AVANT D’UTILISER CE SITE WEB.
Research Report (National Research Council of Canada. Institute for Research in
Construction), 2008-10-22
READ THESE TERMS AND CONDITIONS CAREFULLY BEFORE USING THIS WEBSITE. https://nrc-publications.canada.ca/eng/copyright
NRC Publications Archive Record / Notice des Archives des publications du CNRC :
https://nrc-publications.canada.ca/eng/view/object/?id=7d0fba70-2e04-412f-983b-9584572a5d3b https://publications-cnrc.canada.ca/fra/voir/objet/?id=7d0fba70-2e04-412f-983b-9584572a5d3b
NRC Publications Archive
Archives des publications du CNRC
For the publisher’s version, please access the DOI link below./ Pour consulter la version de l’éditeur, utilisez le lien DOI ci-dessous.
https://doi.org/10.4224/20378280
Access and use of this website and the material on it are subject to the Terms and Conditions set forth at
Analyses of Post-flashover Fires in a Medium-sized Residential Room
Under Different Ventilation Conditions
http://irc.nrc-cnrc.gc.ca
A n a l y s e s o f P o s t - F l a s h o v e r F i r e s i n a
M e d i u m - S i z e d R e s i d e n t i a l R o o m U n d e r
D i f f e r e n t V e n t i l a t i o n s C o n d i t i o n s
R R - 2 6 4
S a b e r , H . H . ; K a s h e f , A . ; B w a l y a , A . C . ;
L o u g h e e d , G . D .
O c t o b e r 2 2 , 2 0 0 8
The material in this document is covered by the provisions of the Copyright Act, by Canadian laws, policies, regulations and international agreements. Such provisions serve to identify the information source and, in specific instances, to prohibit reproduction of materials without written permission. For more information visit http://laws.justice.gc.ca/en/showtdm/cs/C-42
Les renseignements dans ce document sont protégés par la Loi sur le droit d'auteur, par les lois, les politiques et les règlements du Canada et des accords internationaux. Ces dispositions permettent d'identifier la source de l'information et, dans certains cas, d'interdire la copie de documents sans permission écrite. Pour obtenir de plus amples renseignements : http://lois.justice.gc.ca/fr/showtdm/cs/C-42
Analyses of Post-Flashover Fires in a Medium-Sized
Residential Room Under Different Ventilation
Conditions
By
Hamed H. Saber, Ahmed Kashef, Alex Bwalya and Gary Lougheed
Research Report # 264
Date of Report: October 22, 2008
66 Pages
Institute for Research in Construction Fire Research Program
PREFACE
This report presents the results of numerical simulations of fire development in a medium-sized residential room. The objective of this preliminary study was to evaluate the effect of various sizes and configurations of ventilation openings on fire development and thereby assist in the design of fire experiments for the Characterization of Fires in Multi-Suite Residential Dwellings (CFMRD) consortium project.
The CFMRD project is a four-year collaborative undertaking with industries, provincial governments and city authorities that was initiated by NRC-IRC in 2006 to study fires in low-rise multi-suite residential dwellings of light-frame construction. The main objectives of the project are to: a) address the lack of realistic characterized fire types, known as design fires, which are required to aid the development of methods for achieving performance-based solutions to fire problems, and b) further the understanding of how fires in residential buildings sometimes cause fatalities and substantial property losses, as revealed by fire statistics.
The CFMRD project focuses on fires in dwelling units, such as apartments, semi-detached houses, duplex houses, townhouses or row houses, secondary suites and residential care facilities as these fires have a potentially greater impact on adjacent suites.
The main tasks/deliverables of the project are:
1. To conduct fire experiments to characterize fires originating in various living spaces within multi-suite dwellings.
2. To conduct numerical simulations of various fire scenarios in order to interpolate and extend the data beyond that obtained in the experimental studies.
3. To produce a set of realistic design fires for multi-suite dwellings from the experimental data.
4. To develop an analytical method that can be used to calculate design fires for multi-suite dwellings.
The research approach employed by the project utilizes literature reviews, surveys to determine typical configurations and combustibles, computer simulations and fire
experiments. A well-instrumented test facility, equipped with a calorimeter, will be used to conduct medium- and full-scale fire experiments in order to determine the combustion characteristics of typical household furnishings found in living spaces that have a high incidence of fires, individually in a single room and collectively in realistically furnished and well-instrumented simulated residential rooms. Numerical modelling of fire development, using suitable fire models, will be conducted at various stages to assist in the design and instrumentation of the full-scale fire experiments as well as to study the effect of various parameters, such as the ventilation conditions, geometry, and fire load density on the development of the fire.
Characterization of Fires in Multi-Suite Residential
Dwellings (CFMRD)
NRC-IRC gratefully acknowledges the financial and technical support of the Project Consortium, which consists of representatives from the following participating organizations:
Canadian Automatic Sprinkler Association
Canadian Concrete Masonry Producers Association Canadian Council of Furniture Manufacturers
Canadian Wood Council City of Calgary
FPInnovations - Forintek Division Gypsum Association
Masonry Worx
Ontario Ministry of Municipal Affairs and Housing Régie du Bâtiment du Québec
ACKNOWLEDGMENT
The authors acknowledge the contribution of all of the members of the technical and advisory groups of the project at the NRC-IRC Fire Research Program: Eric Gibbs, Bruce Taber and Joseph Su.
Analyses of Post-Flashover Fires in a Medium-Sized
Residential Room Under Different Ventilation Conditions
By
Hamed H. Saber, Ahmed Kashef, Alex Bwalya and Gary Lougheed
ABSTRACT
Establishing proper design fire scenarios is a challenging task and an essential
component for conducting fire safety design of different buildings. A design fire scenario is a qualitative description of a fire with time identifying key events that characterize the fire (ignition, growth, fully-developed, and decay stages of a fire). In addition, it
describes the ventilation conditions that will impact the course of a fire. A number of fire ventilation scenarios were investigated in order to identify the proper ventilation scheme for conducting design fire tests in a compartment of a size 4.2 m long, 3.8 m wide, and 2.4 m high. This effort is a part of the process of designing fire experiments in a project concerning the characteristics of fires in various rooms in low-rise residential dwelling units of light-frame construction. The fuel package that was used in all scenarios consisted of a mock-up sofa and two wood cribs underneath it. The mock-up sofa was constructed entirely out of flexible polyurethane foam. The two wood cribs provided additional fuel load to sustain a fully-developed fire. The selection of this fuel package is supported by fire statistics that many fatal residential fires begin with an item of
upholstered furniture.
The fire characteristics of nine ventilation scenarios (SC1 through SC9) are available in the previous report [1] which describes flow fields within the compartment, flow through the opening(s), location of the neutral plane(s) in the opening(s), the heat release rate, shapes and sizes of the flames. In this report, two more ventilation scenarios (SC10 and SC11) were conducted in order to cover ventilation- and fuel-controlled burning in a room of a size of 4.2 m long, 3.8 m wide and 2.4 m high. Furthermore, the effect of window opening size, doorway size, and fire load location on the heat release rate, period of burning, remaining mass of the fire load, effective heat of combustion, temperature during the period of fully-developed fire (flashover), onset of post-flashover, and period of post-flashover were investigated.
The Computational Fluid Dynamics (CFD) technique was used to conduct the numerical simulations for all ventilation scenarios using the Fire Dynamics Simulator (FDS) version 5 [6]. Unlike the previous versions of FDS, the new combustion model in the FDS version 5 accounts for both mixing of fuel and oxygen without burning and the CO production (incomplete combustion). These are important features for the proper modelling of under-ventilated fires. The CFD simulations conducted in this study will assist in the design of medium and large-scale fire tests to be conducted to evaluate various fire scenarios. In a later stage of this project, the CFD model will be used to conduct parametric studies to determine the effect of various parameters, such as the ventilation conditions, geometry, and type of fire load on the fire development. This information will be used to evaluate the impact of a fire on the life safety, structure integrity, and property protection.
Table of Contents
Preface ... ii
1
Introduction ... 1
2
CFD Simulation... 7
3
Results and Discussions... 10
3.1 Temporal Change in Heat Release Rate ... 11
3.2 Effect of Window Opening Size on Fire Characteristics ... 14
Ventilation scenarios using one window opening with different sizes ... 14
Ventilation scenarios using a window opening and doorway in the opposite walls. 18 Ventilation scenarios using a window opening and doorway in the same wall ... 21
3.3 Effect of Doorway Size on Fire Characteristics ... 22
3.4 Effect of Fire Location on Fire Characteristics ... 26
3.5 Stage of Fully-Developed Fire (Post-flashover) ... 31
Babrauskas’ correlation for post-flashover ... 31
Temperature and mass loss during post-flashover stage ... 34
Comparison of post-flashover temperatures of different scenarios... 36
4
Summary and Conclusion ... 43
5
References ... 45
6
Appendix–A: Average Temperatures and Mass Losses within
the Period of Post-flashover for all Ventilation Scenarios ... 46
List of Figures
Figure 1-1 Room size and fire load [1] ... 2 Figure 1-2 Ventilation parameters for scenarios using a window opening (different sizes)
... 4 Figure 1-3 Ventilation parameters for scenarios using a window opening (different sizes) and doorway (same size) facing each other ... 5 Figure 1-4 Ventilation parameters for scenarios using a window opening (different sizes) and doorway (same size) in the same wall ... 5 Figure 1-5 Ventilation parameters for scenarios using a doorway (different sizes) ... 6 Figure 1-6 Ventilation parameters for scenarios using a window opening (same size) and different fire load locations ... 6 Figure 2-1 Stretched mesh in the x- and y-directions to capture the important
phenomena. ... 9 Figure 2-2 A schematic of the calculated flame cross-section for a given mesh and the actual flame surface ... 10 Figure 3-1 Heat Release Rate of ventilation scenario SC1 (window opening 1.5x1.5 m)
... 12 Figure 3-2 Comparison of the HRRs for ventilation scenarios using one window opening with different sizes...13 Figure 3-3 Status of the wood cribs at the time at which the polyurethane sofa was completely burned in SC1, SC3, SC10 and SC11 ... 15 Figure 3-4 Status of the wood cribs when the burning stopped in SC1, SC3 & SC11 (HRR = ~1 kW) and at the end of simulation in SC10 (HRR ~ 1500 kW at 900 s) ... 16 Figure 3-5 Comparison of the HRRs for ventilation scenarios using window opening (different sizes) and doorway (same size) facing each other... 17 Figure 3-6 Status of the wood cribs at time at which the polyurethane sofa was
completely burned in SC2 and SC4 ... 19 Figure 3-7 Status of the wood cribs when the burning stopped in SC2 and SC4 (HRR = ~1 kW)... 19 Figure 3-8 Comparison of the HRRs for ventilation scenarios using window opening (different sizes) and doorway (same size) located in the same wall side ... 20 Figure 3-9 Status of the wood cribs at time at which the polyurethane sofa was
completely burned in SC7 and SC8 ... 21 Figure 3-10 Status of the wood cribs when the burning stopped in SC7 and SC8 (HRR = ~1 kW)... 22 Figure 3-11 Comparison of the HRRs for ventilation scenarios using a doorway with different sizes ... 24 Figure 3-12 Status of the wood cribs at time at which the polyurethane sofa was
completely burned in SC5 and SC6 ... 25 Figure 3-13 Status of the wood cribs when the burning stopped in SC5 and SC6 (HRR = ~1 kW)... 25 Figure 3-14 Comparison of the HRRs for ventilation scenarios using same window opening size and different fire load locations ... 27 Figure 3-15 Status of the wood cribs at time at which the polyurethane sofa was
completely burned in SC3 and SC9 ... 28 Figure 3-16 Status of the wood cribs when the burning stopped in SC3 and SC9 (HRR = ~1 kW)... 28
Figure 3-17 Comparison of the average temperature over the period of post-flashover with that obtained using Babrauskas’ correlation [11] for all scenarios... 33 Figure 3-18 Comparison of the average temperatures and mass losses during the period of post-flashover for scenarios using a window opening with different sizes ... 37 Figure 3-19 Comparison of the average temperatures and mass losses during the period of post-flashover for scenarios using window opening and doorway facing each other . 38 Figure 3-20 Comparison of the average temperatures and mass losses during the period of post-flashover for scenarios using window opening and doorway located in the same wall ... 39 Figure 3-21 Comparison of the average temperatures and mass losses during the period of post-flashover for scenarios using doorway with different sizes ... 40 Figure 3-22 Comparison of the average temperatures and mass losses during the period of post-flashover for scenarios with different fire load locations... 41 Figure 3-23 Average temperature of all ventilation scenarios over the period of post-flashover... 42 Figure 6-1 Temperature and mass loss during the period of post-flashover for ventilation scenario SC1... 47 Figure 6-2 Temperature and mass loss during the period of post-flashover for ventilation scenario SC2... 48 Figure 6-3 Temperature and mass loss during the period of post-flashover for ventilation scenario SC3... 49 Figure 6-4 Temperature and mass loss during the period of post-flashover for ventilation scenario SC4... 50 Figure 6-5 Temperature and mass loss during the period of post-flashover for ventilation scenario SC5... 51 Figure 6-6 Temperature and mass loss during the period of post-flashover for ventilation scenario SC6... 52 Figure 6-7 Temperature and mass loss during the period of post-flashover for ventilation scenario SC7... 53 Figure 6-8 Temperature and mass loss during the period of post-flashover for ventilation scenario SC8... 54 Figure 6-9 Temperature and mass loss during the period of post-flashover for ventilation scenario SC9... 55 Figure 6-10 Temperature and mass loss during the period of post-flashover for
ventilation scenario SC10 ... 56 Figure 6-11 Temperature and mass loss during the period of post-flashover for
List of Tables
Table 1-1 Ventilation conditions for all scenarios... 3
Table 1-2 Mass of fire load used in all ventilation scenarios [1]... 3
Table 3-1 Comparison of the maximum HRR and burning rate of all scenarios ... 29
Table 3-2 Comparison of the time and burned mass when sofa completely burned ... 30
Table 3-3 Comparison of the total mass losses, total energy release and the effective heat of combustion... 30
Table 3-4 Calculated average temperature over the period of post-flashover based on CFD simulations and Babrauskas’ correlation [11] for all scenarios ... 33
1 Introduction
This report documents the analyses for a series of CFD numerical simulations that were conducted in order to study the effect of ventilation settings on fire dynamics in a room of a size of 4.2 m long, 3.8 m wide and 2.4 m high. The fire was initiated by igniting an item of upholstered furniture. A fuel package consisted of a mock-up sofa constructed with exposed polyurethane foam, the dominant combustible constituent of upholstered furniture, and two wood cribs. The mock-up sofa was ignited first and the wood cribs provided the remaining fire load to sustain a fully-developed fire. The details of the fuel package and its characteristics are available in [1 – 5]. This mode of fire initiation is supported by fire statistics that many fatal residential fires begin with upholstered furniture.
Eleven CFD simulations for different ventilation scenarios were investigated in order to identify the proper ventilation scheme for conducting design fire tests. These scenarios covered a wide range of ventilation factor,
Ψ
, of ~0.01 – 0.08 m1/2, (Ψ
=
A
oH
o/
A
T, where Ao = area of the opening(s), AT = total surface area of the compartment, and Ho =weighted average of the opening(s) height). In this ventilation range, both ventilation-controlled and fuel-ventilation-controlled burning were covered. This report extends the previous effort [1] with a focus on:
(a) Investigating the effect of window opening size on the fire characteristics (in terms of heat release rate, period of burning, remaining mass of the fire load, effective heat of combustion, temperature, onset of fully-developed fire (post-flashover), period of post-flashover, etc) for ventilation scenarios using: (1) one window opening with different sizes (Figure 1-2), (2) a window opening and doorway in opposite walls (Figure 1-3), and (3) a window opening and doorway in the same wall (Figure 1-4),
(b) Investigating the effect of doorway size on the fire characteristics (Figure 1-5), (c) Investigating the effect of fire location on the fire characteristics (Figure 1-6), and (d) Comparing the average temperature over the period of post-flashover for a wide
range of ventilation factor,
Ψ
.In all CFD simulations, the fire load that was used consisted of a polyurethane sofa and two wood cribs (Figure 1-1 and Table 1-1). The dimensions and thermal properties of the polyurethane sofa and wood cribs are available in reference [1]. In the next phase, after identifying the proper ventilation scheme and conducting tests, the numerical results will be compared with experimental results. After verifying the CFD simulation, a parametric analysis will be performed to investigate the effect of different parameters of interest (e.g. fire size, fire location, geometry, etc).
4.2
3.8
2.4
Ea
st
Wa
ll
West W
all
Floor
Ceiling
All dimensions in m
Wood crib
Wood crib
Polyurethane sofa
x
z
y
4.2
3.8
2.4
Ea
st
Wa
ll
West W
all
Floor
Ceiling
All dimensions in m
Wood crib
Wood crib
Polyurethane sofa
x
z
y
x
z
y
Table 1-1 Ventilation conditions for all scenarios
Window Opening
Size (m) Doorway Size (m)
Window Opening
Location Doorway Location Ventilation
Scenario
Width Height Width Height Side Center (x,y,z)
(m) Side
Center (x,y,z) (m)
Fire Load Location
SC1 1.5 1.5 Closed West (0,1.9,1.25) Closed Center of room
SC2 1.5 1.5 0.9 2.0 West (0,1.9,1.25) East (4.2,1.9,1.0) Center of room
SC3 2.0 1.5 Closed West (0,1.9,1.25) Closed Center of room
SC4 1.0 1.0 0.9 2.0 West (0,1.9,1.5) East (4.2,1.9,1.0) Center of room
SC5 Closed 0.9 2.0 Closed East (4.2,1.9,1.0) Center of room
SC6 Closed 1.5 2.0 Closed East (4.2,1.9,1.0) Center of room
SC7 1.0 1.5 0.9 2.0 East (4.2,2.85,1.25) East (4.2,0.95,1.0) Center of room
SC8 1.0 1.0 0.9 2.0 East (4.2,2.85,1.5) East (4.2,0.95,1.0) Center of room
SC9 2.0 1.5 Closed West (0,1.9,1.25) Closed Corner of room*
SC10 1.0 1.0 Closed West (0,1.9,1.0) Closed Center of room
SC11 1.4 1.2 Closed West (0,1.9,1.1) Closed Center of room
* Fire load was separated by 0.10 m from the east and north walls
Table 1-2 Mass of fire load used in all ventilation scenarios [1]
Ventilation scenario Polyurethane sofa
mass (kg) Number of wood cribs
Wood moisture
content (%w) Total wood mass (kg)
SC10
:
Window 1.0x1.0 m
SC10
:
Window 1.0x1.0 m
SC11
:
Window 1.4x1.2 m
SC11
:
Window 1.4x1.2 m
SC3
:
Window 2.0x1.5 m
SC3
:
Window 2.0x1.5 m
SC1
:
Window 1.5x1.5 m
SC1
:
Window 1.5x1.5 m
SC2
:
Window 1.5x1.5 m
Door 0.9x2.0 m
SC2
:
Window 1.5x1.5 m
Door 0.9x2.0 m
SC4
:
Window 1.0x1.0 m
Door 0.9x2.0 m
SC4
:
Window 1.0x1.0 m
Door 0.9x2.0 m
Figure 1-3 Ventilation parameters for scenarios using a window opening (different sizes) and doorway (same size) facing each other
SC8:
Window 1.0x1.0 m
Door 0.9x2.0 m
SC8:
Window 1.0x1.0 m
Door 0.9x2.0 m
SC7:
Window 1.0x1.5 m
Door 0.9x2.0 m
SC7:
Window 1.0x1.5 m
Door 0.9x2.0 m
SC5:
Door 0.9x2.0 m
SC5:
Door 0.9x2.0 m
SC6:
SC6:
Door 1.5x2.0 m
Door 1.5x2.0 m
Figure 1-5 Ventilation parameters for scenarios using a doorway (different sizes)
SC3:
Window 2.0x1.5 m
SC3:
Window 2.0x1.5 m
SC9:
Window 2.0x1.5 m
Fire Load at the corner
SC9:
Window 2.0x1.5 m
Fire Load at the corner
2 CFD Simulation
The Fire Dynamic Simulator (FDS) is a Computational Fluid Dynamics (CFD) model developed to idealize fire-driven fluid flow. The model numerically solves a form of the Navier-Stokes equations appropriate for low-speed, thermally driven flow, with an emphasis on smoke and heat transport from fires. The partial differential equations for conservation of mass, momentum, and energy are discretized using the finite difference method, and the solution is updated in time on a three-dimensional, rectilinear grid. Thermal radiation is computed using a finite volume technique on the same grid as the flow solver. Lagrangian particles are used to simulate smoke movement and sprinkler discharge. FDS computes the temperature, density, pressure, velocity, and chemical composition within each numerical grid cell at each discrete time step. FDS computes the temperature, heat flux, mass loss rate, and various other quantities at solid surfaces.
Version 5 of FDS [6-7] was used to simulate the eleven ventilation scenarios listed in Table 1-1 in a room of a size of 4.2 x 3.8 x 2.4 m (Figure 1-1). Grids or meshes were developed in which the volume within the room was divided into hundreds of thousands of control volumes or cells. In each cell, the governing equations (momentum, energy, and diffusion equations) are simultaneously solved for velocities, temperatures and mass fractions as a function of time. Only one mesh (stretched in x- and y-directions, and uniform in z-direction) was designed for each ventilation scenario. The total number of cells was 720,000. As shown in Figure 2-1, the mesh was refined in the regions where large temporal and/or spatial gradients of key flow quantities are anticipated (e.g. in the vicinity of the fire, doorway and window opening). In order to capture the steep change of the key quantities with time, the time step (Δt) was selected according:
]
/
z)
y,
x,
min[(
t
=
Δ
Δ
Δ
2α
Δ
, (2-1)where α is the thermal diffusivity [
α
=
k
/(
ρ
C
p)
], and Δx, Δy, Δz are the cell size in x-, y-and z-directions, respectively. Note that, the local heat release rate (HRR) was calculated from the local oxygen consumption rate at the flame surface. Therefore, a fine mesh is necessary where the flame exists in order to capture the profile of the flame surface (see Figure 2-2), and hence accurately predict the HRR. The CPU time using the NRC-IRC cluster machine for each scenario was ~14 – 21 days.
The walls, floor and ceiling of the room were assumed inert and perfectly insulated (adiabatic) in all scenarios. This represented the case of most severe fire conditions. In all scenarios, the window openings and doorways were leading to the exterior (i.e. open to the outside), meaning that the inflow to the compartment is fresh air at ambient conditions. Ventilation vents were introduced to mimic the doorways and window openings as shown in Figure 1-2 through Figure 1-6 and Table 1-1. The total local pressure (dynamic + static + gravitational pressure) in the room with and without fire is equal to the atmospheric pressure. To satisfy this condition, the boundary conditions at the window openings and doorways were treated as open vents. Upon initiating the fire, the flow field inside the room will be modified such that the total local pressure in the room will equal the atmospheric pressure. Subsequently, the mass flow rates at the doorways and window openings were calculated and these values were different
period of 900 s. The CFD simulation in each scenario was terminated after the
combustion process was completely stopped. As will be shown later, the combustion of the fire load was completely stopped at different periods of time for these ventilation scenarios.
Unlike the previous versions of FDS, the new combustion model in the FDS version 5 accounts for both mixing of fuel and oxygen without burning and the CO production (incomplete combustion). These are important features for the proper modelling of under-ventilated fires. Before conducting the CFD simulations for all scenarios, many numerical tests and debugging were carried out in order to (a) find out the optimum mesh size, and (b) test the validity of the new combustion model in FDS version 5 (see reference [1] for more details).
x
y
z
α =[k/(ρ Cp)] α = 0.03 cm2/s (sofa) α = 0.002 cm2/s (wood) Δt = min[(Δx, Δy, Δz)2/α]x
y
z
x
y
z
x
y
z
α =[k/(ρ Cp)] α = 0.03 cm2/s (sofa) α = 0.002 cm2/s (wood) Δt = min[(Δx, Δy, Δz)2/α]Figure 2-1 Stretched mesh in the x- and y-directions to capture the important phenomena.
Actual
Flame
Surface
Calculated
Flame
Surface
It is assumed that fuel and oxygen
cannot co-exist in this region (Oxygen
concentration = 0.0)
Actual
Flame
Surface
Calculated
Flame
Surface
It is assumed that fuel and oxygen
cannot co-exist in this region (Oxygen
concentration = 0.0)
Figure 2-2 A schematic of the calculated flame cross-section for a given mesh and the actual flame surface
3 Results and Discussions
In this section, the results of the different ventilation scenarios are presented and discussed. The fire characteristics of ventilation scenarios SC1 through SC9 are available in the previous report [1], which describes flow fields within the compartment, flow through the opening(s), location of the neutral plane(s) in the opening(s), heat release rate, shapes and sizes of the flames. In this report, two more ventilation scenarios (SC10 and SC11) were conducted in order to cover ventilation- and fuel-controlled burning. Scenario SC10 had a square window opening of a size of 1.0 m. Scenario SC11 had a 1.4 m wide and 1.2 m high rectangular window opening, which is the average size of window openings in multi-family dwellings based on a survey that was conducted recently [3]. In the next subsections, the effect of window opening size, doorway size and fire location on the heat release rate, period of burning, remaining mass of the fire load, effective heat of combustion, temperature during the period of fully-developed fire (post-flashover), onset of post-flashover, and period of post-flashover are discussed.
3.1 Temporal Change in Heat Release Rate
An example for heat release rate (HRR) is shown in Figure 3-1 for scenario SC1. Snapshots for flame shapes at different times are shown in inserts (a) through (f) of Figure 3-1. As shown in this figure, the HRR increased rapidly with time and reached its maximum value (6,092 kW) at 24 s. At this time the size of the flame was large and filled a significant portion of the room (insert a). After 24 s, the HRR decreased rapidly with time until 37 s. In the period from 37 s to 236 s, the HRR was more or less constant and its mean value was 3,850 kW. In this period, the size of the flame was smaller (insert b, c) than that at 25 s (insert a), and the HRR was due to burning both the polyurethane sofa and wood cribs. In the period from 236 s to 269 s, the HRR was approximately constant (its mean value equal 3,965 kW). After 269 s, the HRR
decreased with time, reaching its minimum value (479 kW) at 325 s. At this time (325 s), the size of the flame reached its minimum size and the majority of the HRR was due to burning of the wood crib that was located further from the window opening (see insert d). After that the HRR and the flame size increased again with time, reaching another peak (2,347 kW, insert e) at 400 s. In the period from 400 s – 425 s, the HRR decreased slowly with time. For example, the HRR decreased from 2,347 kW to 2,211 kW as the time increased from 400 s to 425 s. After 425 s, the HRR decreased rapidly.
Eventually, the HRR decreased to ~1 kW at 600 s (see the amount of wood remaining in the insert (g) in Figure 3-1). In the later stages of burning, the predicted flame size above the wood crib located further from the window opening was larger than that above the wood crib located closer to the window opening (e.g. see the inserts d, e, f). As a result, the amount of mass loss from the wood crib located further from the window opening was greater than that from the wood crib located closer to the window opening as shown in the insert (g). A similar trend for the HRR and predicted flame shapes were obtained for other ventilation scenarios.
0
1000
2000
3000
4000
5000
6000
7000
0
60
120
180
240
300
360
420
480
540
600
Sofa + Wood Wood ONLYTime (s)
Heat Release Rate (kW)
at 6
00
s
(en
d o
f b
urn
ing
)
(a)
(b)
(c)
(d)
(f)
(e)
(g)
at 25 s
at 120 s
at 236s, sofa completely burned
at 325 s
at 400 s
at 445 s
Sofa +
Wood
Wood
Only
0
1000
2000
3000
4000
5000
6000
7000
0
60
120
180
240
300
360
420
480
540
600
Sofa + Wood Wood ONLYTime (s)
Heat Release Rate (kW)
at 6
00
s
(en
d o
f b
urn
ing
)
(a)
(b)
(c)
(d)
(f)
(e)
(g)
at 25 s
at 120 s
at 236s, sofa completely burned
at 325 s
at 400 s
at 445 s
Sofa +
Wood
Wood
Only
0 1000 2000 3000 4000 5000 6000 7000 0 60 120 180 240 300 360 420 480 540 600 660 720 780 840 900
SC10
SC10SC11
SC11 Wood ONLY Sofa + Wood Wood ONLY Sofa + Wood SC1 SC3 Sofa +Wood WoodONLY Wood ONLY Sofa + Wood
SC3
SC1
Time (s)
Heat Release Rate (k
W)
Figure 3-2 Comparison of the HRRs for ventilation scenarios using one window opening with different sizes
SC1: Window opening
SC3: Window opening SC11: Window opening SC10: Window opening
3.2 Effect of Window Opening Size on Fire Characteristics
In this section, the effect of different sizes of window openings on the fire characteristics is investigated. This includes ventilation scenarios that: (1) use a window opening with different sizes, (2) use a window opening with different sizes and doorway with the same size located in the opposite wall, and (3) use a window opening with different sizes and doorway with the same size located in the same wall.
Ventilation scenarios using one window opening with different sizes
Figure 3-2 compares the HRRs for SC1, SC3, SC10 and SC11. Scenarios SC1 and SC10 had a square window opening of a size of 1.5 m and 1.0 m, respectively.
Scenario SC3 had a large rectangular window opening of a size of 2.0 m wide and 1.5 m high. Additionally, scenario SC11 was considered, which had a rectangular window opening with a size (1.4 m wide and 1.2 m high), which equal the average size of a large number of window openings based on the survey [3]. In these scenarios (Figure 1-2), the fire load was located at the room center, and the coordinates (in meters) of the window opening centers were located at (0.0,1.9,1.25), (0.0,1.9,1.25), (0.0,1.9,1.0) and (0.0,1.9,1.1) for SC1, SC3, SC10 and SC11, respectively (Table 1-1).
As shown in Figure 3-2, the size of the window opening had a significant effect on the fire characteristics during the period of burning in these scenarios. A larger window opening size resulted in higher maximum HRR and a shorter period of burning. For example, the maximum HRR in SC3 with the largest window opening was 6,940 kW compared to 4,400 kW for SC10 with the smallest window opening size (Table 3-1). In all scenarios, after ~60 s from ignition, and during the period of burning the polyurethane sofa and wood cribs simultaneously, and the period of early stage of burning wood only, the HRR was more or less constant.
It took a shorter time for the sofa to be completely burned in scenarios with a larger window opening size. For example, the sofa was completely burned at 192 s in the scenario with the largest window opening size (SC3) compared to 779 s in the scenario with the smallest window opening size (SC10). At these times, the HRRs in SC1, SC3, SC10 and SC11 were ~4,120, 5,350, 1,390, and 2,930 kW, respectively. A snapshot showing the status of the wood cribs at the time when the sofa was completely burned is shown in Figure 3-3 for these scenarios. As shown in this figure, the amount of mass loss from the wood cribs was highest in SC11 (see Table 3-2).
As shown in Figure 3-2, the HRR dropped to its minimum value earlier in the scenario with the larger window opening size. For example, the minimum HRR in scenario SC3 (581 kW at 279 s) was reached 220 s earlier than in scenario SC11 (493 kW at 499 s). Similarly, the second peak of the HRR was reached earlier with a higher value in the scenario with the larger window opening size. For example, the value of the HRR at the second peak in scenario SC3 was 2,800 kW (at 358 s) compared to 2,350 kW (at 399 s) and 1,890 kW (at 583 s) in scenarios SC1 and SC11, respectively.
During the period from ~60 s – end of simulation (900 s) in the scenario with the smallest window opening size (SC10), the HRR was more or less constant. The duration of burning in this scenario was the longest (HRR ~1,500 kW at 900s). On the other hand,
the fire was extinguished earlier in the scenario with the larger window opening size. The fire was extinguished (HRR ~ 1 kW) after 545, 600, and 823 s in SC3 (2.0x1.5 m window opening), SC1 (1.5x1.5 m window opening), and SC11 (1.4x1.2 m window opening), respectively. Snapshots showing the status of the wood cribs at the time when the fire was extinguished in scenarios SC1, SC3 and SC11, and at the end of simulation (900 s) are shown in Figure 3-4. As shown in this figure, the amount of mass loss was the highest in scenario SC11 (see Table 3-3).
SC10
:
Window 1.0x1.0 m
SC11
:
Window 1.4x1.2 m
SC1: Window 1.5x1.5 m
SC3: Window 2.0x1.5 m
Time = 236 s
Time = 779 s
Time = 192 s
Time = 378 s
SC10
:
Window 1.0x1.0 m
SC10
:
Window 1.0x1.0 m
SC11
:
Window 1.4x1.2 m
SC11
:
Window 1.4x1.2 m
SC1: Window 1.5x1.5 m
SC1: Window 1.5x1.5 m
SC3: Window 2.0x1.5 m
SC3: Window 2.0x1.5 m
Time = 236 s
Time = 779 s
Time = 192 s
Time = 378 s
Figure 3-3 Status of the wood cribs at the time at which the polyurethane sofa was completely burned in SC1, SC3, SC10 and SC11
SC1: Window 1.5x1.5 m
Time = 600 s
SC1: Window 1.5x1.5 m
SC1: Window 1.5x1.5 m
Time = 600 s
SC10
:
Window 1.0x1.0 m
Time = 900 s
HRR = 1547 kW
SC10
:
Window 1.0x1.0 m
SC10
:
Window 1.0x1.0 m
Time = 900 s
HRR = 1547 kW
SC3: Window 2.0x1.5 m
Time = 545 s
SC3: Window 2.0x1.5 m
SC3: Window 2.0x1.5 m
Time = 545 s
SC11
:
Window 1.4x1.2 m
Time = 823 s
SC11
:
Window 1.4x1.2 m
SC11
:
Window 1.4x1.2 m
Time = 823 s
Figure 3-4 Status of the wood cribs when the burning stopped in SC1, SC3 & SC11 (HRR = ~1 kW) and at the end of simulation in SC10 (HRR ~ 1500 kW at 900 s)
0 1000 2000 3000 4000 5000 6000 7000 0 60 120 180 240 300 360 420 480 540 SC2 SC4 Wood ONLY Sofa + Wood Sofa +
Wood WoodONLY
SC4
SC2
Time (s)
Heat Release Rate (k
W)
Figure 3-5 Comparison of the HRRs for ventilation scenarios using window opening (different sizes) and doorway (same size) facing each other SC2: Window opening 1.5x1.5 m D 0 9 2 0 SC4: Window opening 1.0x1.0 m D 0 9 2 0
Ventilation scenarios using a window opening and doorway in the opposite
walls
Figure 3-5 compares the HRR for SC2 and SC4. Scenarios SC2 and SC4 had a square window opening of a size of 1.5 m and 1.0 m, respectively. The coordinates (in meters) of the center of the window openings were (0.0,1.9,1.25) and (0.0, 1.9, 1.5) for SC2 and SC4, respectively. Both scenarios had a rectangular opening of a size of 0.9 m wide and 2.0 m high located in the wall opposite the window opening and its center was located at (4.2, 1.9, 1.0) (Table 1-1). The fire load was located at the room center in both scenarios (Figure 1-3).
Figure 3-5 clearly showed that the HRRs in these scenarios were different. The scenario with a larger window opening size (SC2) resulted in a higher maximum HRR (7,292 kW in SC2 compared to 6,816 kW in SC4). The HRR at its second peak in the scenario with the larger window opening size (SC2) was much higher (5,258 kW) and reached 141 s earlier (at 168 s) than that in the scenario with the smaller window
opening size (SC4) (2,591 kW at 309 s). The minimum HRR before reaching its second peak in SC2 (4,744 kW occurred at time = 156 s) was also much higher than that in SC4 (1,442 kW occurred at time = 238 s).
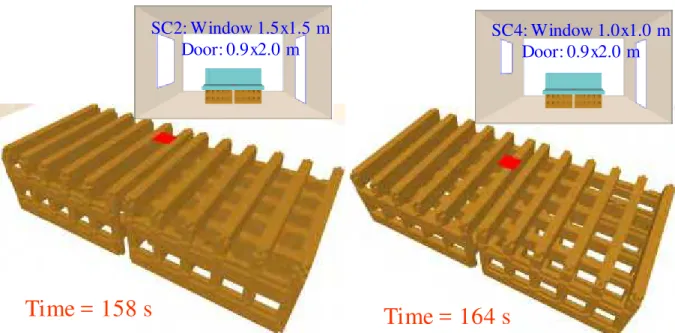
Figure 3-6 shows a snapshot of the status of the wood cribs when the sofa was completely burned. In these two scenarios, the sofa took about the same time to be completely burned (158 s and 166 s in SC2 and SC4, respectively). Also, at this time, the amount of mass loss from the wood was slightly larger in the scenario with the larger window opening size (49.0 kg in SC2 compared to 48.3 kg in SC4, Table 3-2).
The size of the openings and their locations play an important role in the thermal feedback to the bulk fuel and its surface temperature, and hence on the fire
development. Because of the larger amount of heat losses by convection and radiation through the openings in the scenario with the larger window opening size (SC2), the amount of net heat feedback to the fuel surface was smaller. As a result, the fire lasted for a shorter period in the scenario with the larger window opening size (300 s in SC2 compared to 435 s in SC4). Figure 3-7 shows a snapshot of the status of the wood cribs when the fire was extinguished (HRR ~ 1 kW). As shown in this figure, scenario SC4 resulted in more mass loss than scenario SC2. The remaining mass from the wood cribs in scenario SC2 was 31% compared to 21% (by mass) in scenario SC4 (Table 3-3).
SC4: Window 1.0x1.0 m
Door: 0.9x2.0 m
Time = 164 s
SC4: Window 1.0x1.0 m
Door: 0.9x2.0 m
SC4: Window 1.0x1.0 m
Door: 0.9x2.0 m
Time = 164 s
SC2: Window 1.5x1.5 m
Door: 0.9x2.0 m
Time = 158 s
SC2: Window 1.5x1.5 m
Door: 0.9x2.0 m
SC2: Window 1.5x1.5 m
Door: 0.9x2.0 m
Time = 158 s
Figure 3-6 Status of the wood cribs at time at which the polyurethane sofa was completely burned in SC2 and SC4
SC2: Window 1.5x1.5 m
Door: 0.9x2.0 m
Time = 300 s
SC2: Window 1.5x1.5 m
Door: 0.9x2.0 m
SC2: Window 1.5x1.5 m
Door: 0.9x2.0 m
Time = 300 s
SC4: Window 1.0x1.0 m
Door: 0.9x2.0 m
Time = 435 s
SC4: Window 1.0x1.0 m
Door: 0.9x2.0 m
SC4: Window 1.0x1.0 m
Door: 0.9x2.0 m
Time = 435 s
Figure 3-7 Status of the wood cribs when the burning stopped in SC2 and SC4 (HRR = ~1 kW)
0 1000 2000 3000 4000 5000 6000 7000 0 60 120 180 240 300 360 420 480 540 SC7 Sofa + Wood Wood ONLy Sofa + Wood Wood ONLy SC8
SC8
SC7
Time (s)
Heat Release Rate (k
W)
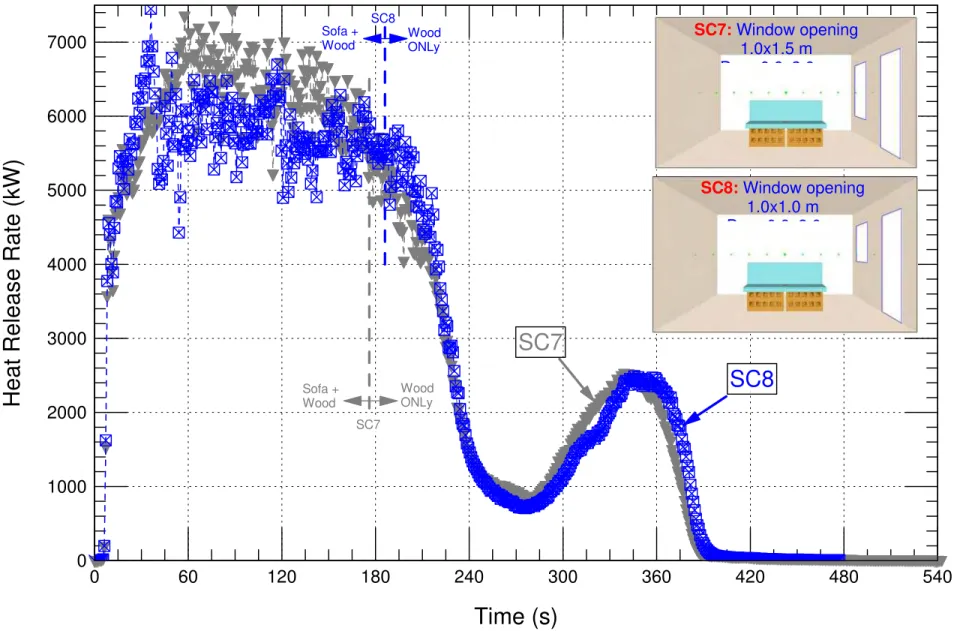
Figure 3-8 Comparison of the HRRs for ventilation scenarios using window opening (different sizes) and doorway (same size) located in the same wall side
SC8: Window opening 1.0x1.0 m D 0 9 2 0 SC7: Window opening 1.0x1.5 m D 0 9 2 0
Ventilation scenarios using a window opening and doorway in the same
wall
Figure 3-8 compares the HRR when both the window opening and doorway were located on the same wall in scenarios SC7 and SC8. Scenario SC7 had a rectangular window opening of a size of 1.0 m wide and 1.5 m high, while SC8 had a window
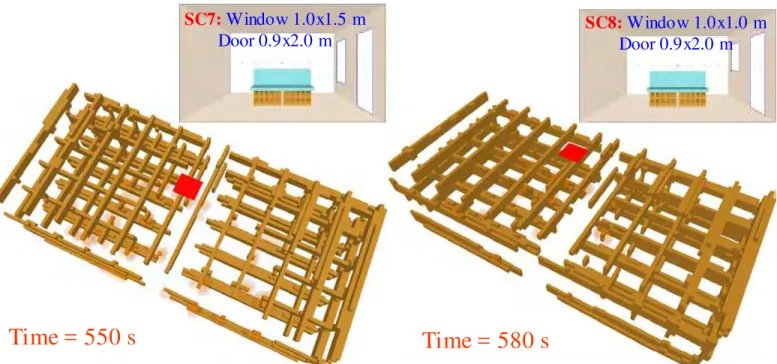
opening of a square exterior opening of a size of 1.0 m (Figure 1-4). The coordinates (in meters) of the window opening centers were (4.2,2.85,1.25) and (4.2,2.85,1.5) in SC7 and SC8, respectively (Table 1-1). A doorway of a rectangular exterior opening of a size of 0.9 m wide and 2.0 m high was used in both scenarios. As shown in Figure 3-8, there was insignificant difference in the fire characteristics during the whole period of burning in these scenarios. For example, the maximum HRRs were about the same in both scenarios (7,431 kW and 7,450 kW in SC7 and SC8, respectively). The sofa was completely burned at 176 s and 186 s in SC7 and SC8, respectively (Table 3-2 and Figure 3-9). Additionally, the remaining mass from the wood cribs was the same in both scenarios (20% by mass) (Table 3-3 and Figure 3-10). More details about the flow field in the room, locations of the neural planes in the window opening and doorway, etc. are available in [1].
In summary, in the case of using a window opening and doorway in the same wall, the size of the window opening did not affect the fire characteristics (see SC7 and SC8). However, the size of the window opening had a significant effect on the fire
characteristics in the cases of using a window opening and doorway in opposing walls (see SC2 and SC4), and only a window opening (see SC1, SC3, SC10 and SC11).
SC7:
Window 1.0x1.5 m
Door 0.9x2.0 m
Time = 176 s
SC7:
Window 1.0x1.5 m
Door 0.9x2.0 m
SC7:
Window 1.0x1.5 m
Door 0.9x2.0 m
Time = 176 s
SC8:
Window 1.0x1.0 m
Door 0.9x2.0 m
Time = 185 s
SC8:
Window 1.0x1.0 m
Door 0.9x2.0 m
SC8:
Window 1.0x1.0 m
Door 0.9x2.0 m
Time = 185 s
Figure 3-9 Status of the wood cribs at time at which the polyurethane sofa was completely burned in SC7 and SC8
SC7:
Window 1.0x1.5 m
Door 0.9x2.0 m
Time = 550 s
SC7:
Window 1.0x1.5 m
Door 0.9x2.0 m
SC7:
Window 1.0x1.5 m
Door 0.9x2.0 m
Time = 550 s
SC8:
Window 1.0x1.0 m
Door 0.9x2.0 m
Time = 580 s
SC8:
Window 1.0x1.0 m
Door 0.9x2.0 m
SC8:
Window 1.0x1.0 m
Door 0.9x2.0 m
Time = 580 s
Figure 3-10 Status of the wood cribs when the burning stopped in SC7 and SC8 (HRR = ~1 kW)
3.3 Effect of Doorway Size on Fire Characteristics
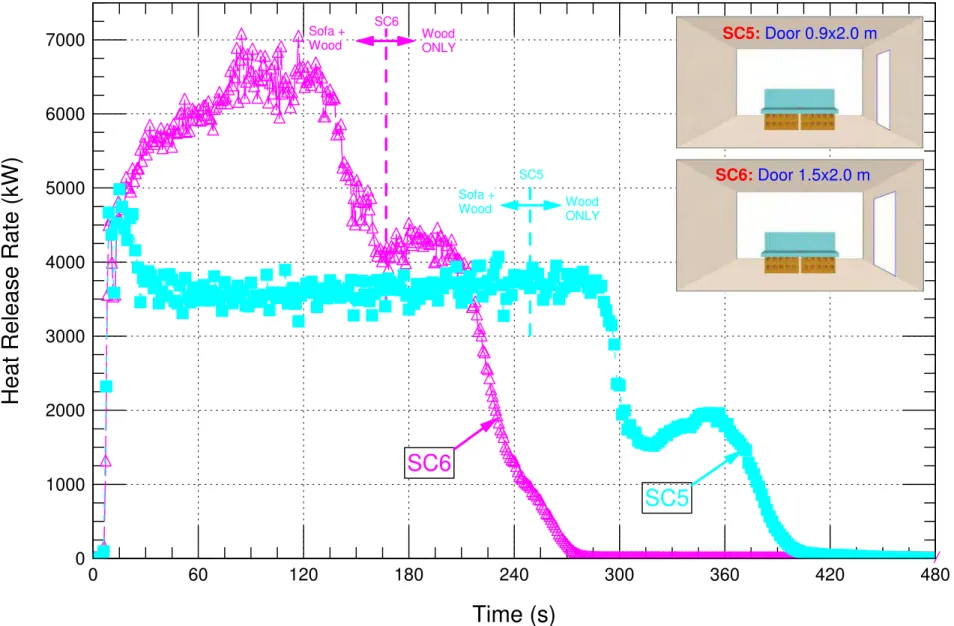
The ventilation scenario SC6 was similar to scenario SC5 except for having a wider doorway of a size of 1.5 m wide and 2.0 m high in the former compared to 0.9 m wide and 2.0 m high in the latter. The coordinates (in meters) of the doorway center in both scenarios were (4.2, 1.9, 1.0) (Table 1-1). The fire load was located at the room center in both scenarios (Figure 1-5).
Figure 3-11 compares the HRR for scenarios SC5 and SC6. As shown in this figure, the doorway size had a significant effect on the HRR. In the first 15 s, the HRR increased rapidly in both scenarios. After that the HRR increased further but with a lower rate and reached its first peak (7,069 kW) at 85 s in the scenario with a larger doorway size (SC6). In scenario SC5, however, the first peak HRR (4,983 kW) was achieved after ~15 s from initiating the fire, and within 12 s after reaching the first peak (from 15 s to 27 s), the HRR decreased rapidly with time from 4,983 kW to 3,460 kW.
As shown in Figure 3-11, the minimum HRR before reaching its second peak in the scenario with a larger doorway size (SC6) was much higher (4,156 kW) and reached 152 s earlier (at 167 s) than for scenario SC5 with a smaller doorway size (1,521 kW at 319 s). Furthermore, the value of the HRR at its second peak in SC6 was much higher (4,513 kW) and reached 171 s earlier (at 180 s) than for scenario SC5 (1,961 kW at 351 s). The sofa was completely burned in scenario SC6 at 167 s versus 249 s in scenario SC5. At these times, the amount of mass loss from the wood in the scenario with a smaller doorway size (SC5) was 52.4 kg (60% by mass) compared to 47.1 kg (54% by mass) in scenario SC6 (see Figure 3-12 and Table 3-2).
The larger exterior opening in SC6 (1.5 m x 2.0 m doorway) resulted in more heat losses (by convection and radiation) than that in SC5 (0.9 m x 2.0 m doorway). As such, the net thermal feedback to the fuel in SC6 was lower than that in SC5. For this reason, it took a shorter period to completely extinguish the fire in SC6 (346 s) than that in SC5 (536 s). A snapshot for the status of the wood when the fire was extinguished (HRR ~ 1 kW) is shown in Figure 3-13. At these times, the unburned mass of the wood was 25.6 kg (29% by mass) in SC6 compared to 18.3 kg (21% by mass) in SC5 (Table 3-3).
In the scenario with a larger doorway size (SC6), the total energy released due to burning 69.5 kg of the fire load (61.2 kg wood and 8.3 kg polyurethane sofa) was 1,198 MJ. The total energy released in this scenario (SC6) was about the same as in scenario SC5 (1,219 MJ), although the total mass loss in the former (69.5 kg) was 7.2 kg smaller than that in the latter (76.7 kg). Having a larger doorway size in scenario SC6 than in scenario SC5 resulted in higher oxygen concentration inside the compartment in the former than in the latter. Accordingly, the amount of CO production in the former was smaller (due to converting most of the CO to CO2) than in the latter. As a result, the
effective heat of combustion in scenario SC6 (17.2 MJ/kg) was greater than that in scenario SC5 (15.9 MJ/kg) (see Table 3-3). More details about the flow field in the room, locations of the neutral plane in the doorways, etc are available in [1].
0 1000 2000 3000 4000 5000 6000 7000 0 60 120 180 240 300 360 420 480
SC5
SC6
SC5 SC6 Wood ONLY Wood ONLY Sofa + Wood Sofa + WoodTime (s)
Heat Release Rate (k
W)
Figure 3-11 Comparison of the HRRs for ventilation scenarios using a doorway with different sizes
SC5: Door 0.9x2.0 m
SC5: Door: 0.9x2.0 m
Time = 249 s
SC5: Door: 0.9x2.0 m SC5: Door: 0.9x2.0 mTime = 249 s
SC6: Door 1.5x2.0 mTime = 167 s
SC6: Door 1.5x2.0 m SC6: Door 1.5x2.0 mTime = 167 s
Figure 3-12 Status of the wood cribs at time at which the polyurethane sofa was completely burned in SC5 and SC6
SC5: Door: 0.9x2.0 m
Time = 536 s
SC5: Door: 0.9x2.0 m
Time = 536 s
SC6: Door: 1.5x2.0 m
Time = 346 s
SC6: Door: 1.5x2.0 m
Time = 346 s
Figure 3-13 Status of the wood cribs when the burning stopped in SC5 and SC6 (HRR = ~1 kW)
3.4 Effect of Fire Location on Fire Characteristics
The ventilation scenario SC9 is similar to scenario SC3 except for placing the fire load at the northeast corner of the room in the former (100 mm from both the east and north walls), and at the room center in the latter (Figure 1-6). A rectangular window opening of a size of 2.0 m wide and 1.5 m high was used in these two scenarios. The coordinates (in meters) of the center of the window opening were (0.0,1.9,1.25) (Table 1-1). In SC9, a square exterior opening of a size of 0.2 m represented the leakage in the room and the coordinates of its center were (4.2,3.3,0.2).
Figure 3-14 shows the HRR for scenarios SC3 and SC9. As shown in this figure, the maximum HRR in scenario SC3 was much higher (6,940 kW) and reached much earlier (at 39 s) than in scenario SC9 (4,760 kW at 282 s). The sofa took a longer period to be completely burned in SC9 (283 s) than in scenario SC3 (192 s). Figure 3-15 shows a snapshot for the status of the wood cribs at the time when the sofa was completely burned in these scenarios. At this time, the mass loss from the wood cribs in scenario SC9 (53.4 kg, 62% by mass) was higher than in scenario SC3 (49.0 kg, 57% by mass). In both scenarios, after the sofa was completely burned, the HRR decreased and reached a minimum value of 581 kW at 279 s, and 594 kW at 375 s in SC3 and SC9, respectively. The second peak of the HRR in scenario SC3 was higher (2,800 kW) and reached 87 s earlier than in scenario SC9 (1,740 kW at 445 s).
Because the fire load was closer to the window opening in scenario SC3, the amount of heat losses by convection and radiation through it was higher than that in scenario SC9. Consequently, the amount of net heat feedback to the surface of the fuel was lower in SC3 than that in SC9. As a result, the duration of burning was 100 s shorter in scenario SC3 (545 s) than in scenario SC9 (645 s). A snapshot of the status of the wood when the fire was extinguished (HRR ~ 1 kW) is shown in Figure 3-16 for these scenarios. As shown in this figure, the amount of mass loss in scenario SC9 was greater than in scenario SC3. In summary, the fire load location had a significant effect on the fire characteristics.
0 1000 2000 3000 4000 5000 6000 7000 0 60 120 180 240 300 360 420 480 540 600
SC3
SC9
SC9 Wood ONLY Wood ONLY Sofa + Wood Sofa + Wood SC3Time (s)
Heat Release Rate (k
W)
Figure 3-14 Comparison of the HRRs for ventilation scenarios using same window opening size and different fire load locations
SC3: Window opening
SC9:Window opening 2.0x1.5 m
SC3:
Window 2.0x1.5 m
Time = 192 s
SC3:
Window 2.0x1.5 m
SC3:
Window 2.0x1.5 m
Time = 192 s
SC9:
Window 2.0x1.5 m
Fire Load at the corner
Time = 283 s
SC9:
Window 2.0x1.5 m
Fire Load at the corner
SC9:
Window 2.0x1.5 m
Fire Load at the corner
Time = 283 s
Figure 3-15 Status of the wood cribs at time at which the polyurethane sofa was completely burned in SC3 and SC9
SC3: Window 2.0x1.5 m
Time = 545 s
SC3: Window 2.0x1.5 m
SC3: Window 2.0x1.5 m
Time = 545 s
SC9:
Window 2.0x1.5 m
Fire Load at the corner
Time = 645 s
SC9:
Window 2.0x1.5 m
Fire Load at the corner
SC9:
Window 2.0x1.5 m
Fire Load at the corner
Time = 645 s
Figure 3-16 Status of the wood cribs when the burning stopped in SC3 and SC9 (HRR = ~1 kW)
Table 3-1 Comparison of the maximum HRR and burning rate of all scenarios
Maximum Heat Release Rate and its Time
Maximum Burn Rate and its Time Ventilation Scenario kW s kg/s s SC1 6,092 24 0.405 59 SC2 7,292 69 0.517 66 SC3 6,940 39 0.508 113 SC4 6,816 30 0.531 59 SC5 4,983 15 0.347 72 SC6 7,069 85 0.495 87 SC7 7,431 88 0.513 57 SC8 7,450 36 0.495 54 SC9 4,760 282 0.324 186 SC10 4,400 21 0.267 21 SC11 4,620 23 0.257 21
Table 3-2 Comparison of the time and burned mass when sofa completely burned
Ventilation Scenario
Time at which the sofa was
completely burned, t* (s) Burned mass of the wood cribs at t* (kg) Total burned mass at t* (kg) Percentage of Wood Cribs Burned at t* (%w) SC1 236 50.6 58.9 58 SC2 158 49.0 57.3 57 SC3 192 49.6 57.9 57 SC4 166 48.3 56.6 56 SC5 249 52.4 60.7 60 SC6 167 47.1 55.4 54 SC7 176 47.2 55.5 54 SC8 186 48.4 56.7 56 SC9 283 53.4 61.7 62 SC10 779 46.3 54.3 53 SC11 378 50.9 59.2 59
Table 3-3 Comparison of the total mass losses, total energy release and the effective heat of combustion Ventilation Scenario Total burned mass of the wood cribs (kg) Total burned mass (sofa + wood cribs) (kg) Total remaining mass of the wood cribs (kg) Percentage of total remaining mass of the wood cribs (%w) Total Energy released (MJ) Effective Heat of Combustion (MJ/kg) SC1 70.9 79.1 15.9 18 1,317 16.6 SC2 59.7 68.0 27.0 31 1,169 17.2 SC3 69.9 78.2 16.8 19 1,398 17.9 SC4 68.8 77.1 17.9 21 1,304 16.9 SC5 68.4 76.7 18.3 21 1,219 15.9 SC6 61.2 69.5 25.6 29 1,198 17.2 SC7 69.6 77.9 17.1 20 1,515 19.4 SC8 69.3 77.6 17.4 20 1470 18.9 SC9 69.5 77.8 17.2 20 1,511 19.4 SC10# 56.5 64.8 30.2 35 1,159 17.9 SC11 71.5 79.8 15.2 18 1,449 18.2
3.5 Stage of Fully-Developed Fire (Post-flashover)
Fully-developed (post-flashover) fire scenarios are typically used in the design and analysis of building fire safety systems, such as structural fire resistance or in estimating the potential for building-to-building fire spread. The stage of post-flashover is defined as the period when the mass of fuel was between 80% and 30% of the original,
unburned fuel mass [8]. There are several models and correlations available to predict the temperature of fully-developed enclosure fires [8 –11]. These models and
correlations predict compartment fire temperature based on input data for heat release curves, the amount of fuel in the compartment and compartment characteristics (e.g. compartment geometry, ventilation setting, and thermal properties of construction materials). While much attention has been focused on computer modelling in recent years, closed-form models are still representative of the state of the art in post-flashover enclosure fire modelling.
Recently Hurley [8] evaluated the closed-form models of fully-developed enclosure fires by comparing predictions of different correlations with temperature data from
experiments. The selected experimental data represented a wide spectrum of ventilation conditions, including fuel- and ventilation-controlled fires. Most of the available
correlations were found to under-predict compartment fire temperatures under some conditions [8].
In this section, the average temperature within the compartment and burning rate or the fuel mass losses during the stage of post-flashover were investigated for all ventilation scenarios. Additionally, the temperatures averaged over the period of post-flashover based on CFD simulations for all scenarios (SC1 through SC11) are presented as a function of ventilation factor,
Ψ
(Ψ
=
A
oH
o/
A
T). These temperatures were compared with that obtained using Babrauskas’ correlation [11].Babrauskas’ correlation for post-flashover
The average gas temperature in post-flashover based on the work of Babrauskas [11] is given as: 5 4 3 2 1 * ) ( − ×
θ
×θ
×θ
×θ
×θ
+ =T∞ T T∞ Tg , (3-1) where: gT
= average gas temperature (K)∞
T = ambient temperature (K)
*
T
= empirical constant = 1725 KThe factors
θ
1 throughθ
5 in the above equation account for different physical phenomena, which are burning rate stoichiometry (θ
1), wall steady-state heat losses (θ
2), wall transient heat losses (θ
3), opening height effect (θ
4), and combustion efficiency (θ
5). These factors are listed below:⎩
⎨
⎧
>
−
<
+
=
1
for
)
(ln
05
.
0
0
.
1
1
for
ln
51
.
0
0
.
1
3 / 5 1φ
φ
φ
φ
θ
, o o H A HRR 1500 =φ
, (3-2)⎥
⎥
⎦
⎤
⎢
⎢
⎣
⎡
⎟
⎠
⎞
⎜
⎝
⎛
⎟
⎟
⎠
⎞
⎜
⎜
⎝
⎛
−
−
=
3 / 1 3 / 2 21
.
0
0
.
94
exp
54
k
A
H
A
T o oδ
θ
, (3-3)⎥
⎥
⎦
⎤
⎢
⎢
⎣
⎡
⎟
⎟
⎠
⎞
⎜
⎜
⎝
⎛
⎟
⎟
⎠
⎞
⎜
⎜
⎝
⎛
−
−
=
4 . 0 6 . 0 31
.
0
0
.
92
exp
150
p T o oC
k
t
A
H
A
ρ
θ
, (3-4) 3 . 0 41
.
0
0
.
205
−−
=
H
oθ
, and (3-5) pb
ln
0
.
1
5=
+
θ
. (3-6) Where,HRR = heat release rate (kW), Ao = area of the opening(s) (m2),
AT = total area of the compartment – enclosing surfaces (m2), p
b
= the combustion efficiency with values in the range 0.5 – 0.9,Cp = wall specific heat (J/kg.K),
Ho = height of the opening (m),
k = wall thermal conductivity (W/m.K), t = time (s),
δ
= wall thickness (m),ρ
= wall density (kg/m3), andφ
= equivalence ratio (φ
= 1 at stoichiometry,φ
> 1 for fuel-rich burning, andφ
< 1 for fuel-lean conditions).Note that in the case of having more than one opening such as in scenarios SC2, SC4, SC7 and SC8, the height of the opening (Ho) is calculated as the weighted average of
the height as following:
∑
∑
= ==
n i i o n i i o i o oA
H
A
H
1 , 1 , , , (3-7) where, n = number of openings.Figure 3-17 and Table 3-4 compare the predicted temperature averaged over the period of post-flashover based on the CFD simulations and that obtained using Babrauskas’ correlation [11]. As mentioned earlier, the walls and ceiling of the compartment were insulated in the CFD simulations, which represented the most severe condition. On the other hand, some of the empirical constants in the Babrauskas’ correlation [11] were obtained based on the experimental data (i.e. heat losses through the walls and ceiling were accounted for). As such, the present CFD predictions for the average
temperatures of different ventilation scenarios were higher (<+25%) than that obtained using Babrauskas’ correlation [11] (see Figure 3-17).
Table 3-4 Calculated average temperature over the period of post-flashover based on CFD simulations and Babrauskas’ correlation [11] for all scenarios
Ventilation Scenario Total Opening Area (m2) Average Temperature based on CFD Simulations (oC) Average Temperature based on Babrauskas’ Correlation [11] (oC) SC1 2.25 740 694 SC2 4.05 579 545 SC3 3 885 739 SC4 2.8 896 721 SC5 1.8 836 685 SC6 3 852 761 SC7 3.3 923 790 SC8 2.8 903 773 SC9 3 715 737 SC10 1 577 459 SC11 1.68 675 620 200 300 400 500 600 700 800 900 1000 200 300 400 500 600 700 800 900 1000 +25% SC10 SC11 SC8 SC7 SC6 SC5 SC4 SC3 SC2 SC1 SC9 +20% -20%
Average temperature based on Babrauskas' correlation (oC)
A v erage tem p e ratu re b a s ed on CF D c a lc ula ti ons ( o C)
Figure 3-17 Comparison of the average temperature over the period of post-flashover with that obtained using Babrauskas’ correlation [11] for all scenarios
Temperature and mass loss during post-flashover stage
In this subsection, the average compartment temperature and mass loss are compared for each set of ventilation scenarios during the stage of fully-developed fire (post-flashover). As mentioned earlier, the stage of post-flashover was defined as the period when the mass of fuel was between 80% and 30% of the original, unburned fuel mass [8]. Predicting both the temperature and the onset of post-flashover and its period are important in terms of fire spread, and structure integrity and its fire resistance point of view. Figure 6-1 through Figure 6-11 in Appendix – A, show the average temperature and mass loss for each ventilation scenario (SC1 through SC11).
Figure 3-18 compares the temporal change of the average temperature within the compartment and mass loss for ventilation scenarios using only a window opening with different sizes. As shown in this figure, the average temperature increased by
increasing the window opening size. The calculated temperature averaged over the period of post-flashover in scenarios SC3 (2.0x1.5 m window opening, largest size), SC1 (1.5x1.5 m window opening), SC11 (1.4x1.2 m window opening) and SC10 (1.0x1.0 m window opening, smallest size) were 885, 740, 675 and 577oC, respectively. As shown in Figure 3-18, the onset of post-flashover took place earlier for ventilation scenarios with a larger window opening size. For example, in scenarios SC3, SC1, SC11 and SC10, the onset of post-flashover occurred at 65, 100, 132 and 304 s, respectively.
Furthermore, the period of the post-flashover decreased by increasing the window opening size. These periods were 174 s (from 65 – 239 s), 254 s (from 100 – 354 s), 291 s (from 132 – 423 s), and ~600 s (from 304 – ~900 s, see Figure 6-10 in Appendix – A for the entire range of the period of post-flashover) in scenarios SC3, SC1, SC11 and SC10, respectively.
Figure 3-19 compares the average temperature and mass loss for ventilation scenarios SC2 and SC4. Scenarios SC2 and SC4 had a square window opening of a size of 1.5 m and 1.0 m, respectively. These scenarios had a doorway of a size of 0.9 m wide and 2.0 m high located in the wall opposite to the window opening. The window opening size in scenario SC2 (2.25 m2) was 125% larger than that in scenario SC4 (1.0 m2); resulting in larger heat losses by convection and radiation in scenario SC2 than that in scenario SC4. Consequently, the average temperature in scenario SC4 was higher than scenario SC2. The temperature averaged over the period of post-flashover in scenario SC4 (896oC) was 317oC higher than in scenario SC2 (579oC). The onset of post-flashover took place at about the same time in both scenarios (~60 s). Additionally, the period of post-flashover in scenario SC4 was slightly longer than that in scenario SC2.
Figure 3-20 compares the average temperature and mass loss in the case of having both window opening and doorway located in the same wall in ventilation scenarios SC7 and SC8. These scenarios had the same doorway size (0.9 m wide and 2.0 m high) with different window opening sizes. As shown in this figure, the window opening size had an insignificant effect on both the average temperature and the onset of post-flashover and its period. The temperature averaged over the period of post-flashover in scenario SC7 (1.0x1.5 m window opening) (923oC) was only 20oC higher than in scenario SC8
(1.0x1.0 m window opening) (903oC). In both scenarios, the onset of post-flashover occurred at 63 s and its period was 168 s (from 63 – 231 s).
Figure 3-21 compares the average temperature and mass loss in the case of having only a doorway with different sizes as in ventilation scenarios SC5 (0.9x2.0 m doorway) and