Publisher’s version / Version de l'éditeur:
Vous avez des questions? Nous pouvons vous aider. Pour communiquer directement avec un auteur, consultez la
première page de la revue dans laquelle son article a été publié afin de trouver ses coordonnées. Si vous n’arrivez pas à les repérer, communiquez avec nous à [email protected].
Questions? Contact the NRC Publications Archive team at
[email protected]. If you wish to email the authors directly, please see the first page of the publication for their contact information.
https://publications-cnrc.canada.ca/fra/droits
L’accès à ce site Web et l’utilisation de son contenu sont assujettis aux conditions présentées dans le site LISEZ CES CONDITIONS ATTENTIVEMENT AVANT D’UTILISER CE SITE WEB.
2009 Building Envelope Symposium [Proceedings], pp. 21-30, 2009-10-26
READ THESE TERMS AND CONDITIONS CAREFULLY BEFORE USING THIS WEBSITE. https://nrc-publications.canada.ca/eng/copyright
NRC Publications Archive Record / Notice des Archives des publications du CNRC : https://nrc-publications.canada.ca/eng/view/object/?id=2a6ff366-a1c3-4f08-a657-1df3412b1eed https://publications-cnrc.canada.ca/fra/voir/objet/?id=2a6ff366-a1c3-4f08-a657-1df3412b1eed
NRC Publications Archive
Archives des publications du CNRC
This publication could be one of several versions: author’s original, accepted manuscript or the publisher’s version. / La version de cette publication peut être l’une des suivantes : la version prépublication de l’auteur, la version acceptée du manuscrit ou la version de l’éditeur.
Access and use of this website and the material on it are subject to the Terms and Conditions set forth at
Development of energy ratings for insulated wall assemblies
http://www.nrc-cnrc.gc.ca/irc
Deve lopm e nt of e ne rgy ra t ings for insula t e d w a ll
a sse m blie s
N R C C - 5 1 4 1 9
Elmahdy, A.H; Maref, W.; Swinton, M.C.; Saber, H.H., Glazer, R.
O c t o b e r 2 0 0 9
A version of this document is published in / Une version de ce document se trouve dans:
2009 Building Envelope Symposium, San Diego, Ca. October 26-29, 2009, pp. 1-18
The material in this document is covered by the provisions of the Copyright Act, by Canadian laws, policies, regulations and international agreements. Such provisions serve to identify the information source and, in specific instances, to prohibit reproduction of materials without written permission. For more information visit http://laws.justice.gc.ca/en/showtdm/cs/C-42
Les renseignements dans ce document sont protégés par la Loi sur le droit d'auteur, par les lois, les politiques et les règlements du Canada et des accords internationaux. Ces dispositions permettent d'identifier la source de l'information et, dans certains cas, d'interdire la copie de documents sans permission écrite. Pour obtenir de plus amples renseignements : http://lois.justice.gc.ca/fr/showtdm/cs/C-42
DEVELOPMENT OF ENERGY RATINGS FOR INSULATED WALL ASSEMBLIES
by
Hakim Elmahdy*1, Wahid Maref *, Mike Swinton*, Hamed Saber* and Rock Glazer*
RCI Inc. 2009 Building Envelope Symposium Loews Coronado Bay Resort – San Diego, CA
October 26-27, 2009
INTRODUCTION:
Spray Polyurethane Foam insulation (SPF) has been gaining considerable attention in North America for a number of reasons, including: the claimed better thermal
performance of foamed walls relative to conventional poly-wrapped batts insulated walls; better air leakage performance, and the introduction of environmentally friendly blowing agents to reduce green house gases emission.
A few years ago, North American SPF industry joined forces to develop a replacement of the commonly used chlorofluorocarbon blowing agent. The introduction of the second generation of blowing agents (namely hydro-chlorofluorocarbon, HCFC) was seen as a positive step in the processing of SPF. Other agents were also developed and their performance was assessed and reported [1 and 2].
In recent years, the focus of building code and regulatory officials, professionals and researchers has shifted towards the performance of the entire wall system. The emphasis is on the contribution of SPF and other insulated walls to the control of heat, moisture and air through the system. Therefore, it is not sufficient to characterize the wall by its R-value alone, as was the case in the past.
This paper is one in a series to present information generated from a research project conducted jointly by the National Research Council Institute for Research in
Construction (NRC-IRC) and the polyurethane industry (contractors, and material
suppliers) to assess the overall performance of insulated walls. In an earlier paper [3], the authors presented a brief outline of the project objectives and a limited set of results of two walls that were available at that time. A second paper presented at an ASTM Symposium [4], where the test results of six walls were presented. These walls included
1(*)
National Research Council of Canada Institute for Research in Construction , (NRC-IRC), Ottawa, Ontario, Canada
glass fiber poly-sealed (two reference walls) as well as four walls of medium density foam (closed cell foam) insulation.
In this paper, more details about the testing program for six walls is presented, in addition to a brief description of the analytical approach used to determine the Wall Energy Rating (WER) of insulated wall assemblies. Four of the six walls presented here were insulated with light density (open cell foam, 6.8 to 12 kg/m3 nominal density) spray polyurethane foam and the remaining two walls were reference walls insulated with poly-wrapped glass fiber batts. The work in this project is progressing and the plan is to test additional walls to improve the correlation of data.
PROJECT OBJECTIVES:
The main objective of this project is to develop an accurate and reliable combined testing and analytical procedures to determine wall energy rating (WER) of the insulated wall assemblies. In addition, to introduce a new concept that combines the heat loss due to air leakage and that due to thermal conduction showing their interaction and impact on the overall thermal performance of wall assemblies.
METHODOLOGY:
The approach taken to achieve the project goals included two parallel paths: experimental and analytical. The experimental path is designed to determine: the wall air leakage rate (before and after wall conditioning), the thermal resistance (R-value before and after wall conditioning) and material characterization.
The analytical path is designed to predict the “apparent R-value” of walls with the presence of air leakage. It also provides a detailed account of the airflow path particularly around the corners and hidden joints. Once the results from laboratory testing and computer simulation are compiled, then the next step is to utilize all the results to determine their correlation and to characterize the combined air leakage and conduction heat losses through the wall assemblies. The result is an expression to determine WER as a function of R-value, air leakage rate and temperature difference.
THE EXPERIMENTAL PATH:
A number of wall samples were constructed and instrumented to record the intended measurements. Several tests were performed on all wall samples, which included air leakage tests, thermal transmission properties (R-value) and sample conditioning. Material characterization tests were performed on the foams only. Details of these tests are given in the following sections.
WALL SAMPLES DESCRIPTION:
Wall samples were constructed according to common practices in the construction industry in Canada (and perhaps in parts of the USA). Table 1 provides a brief
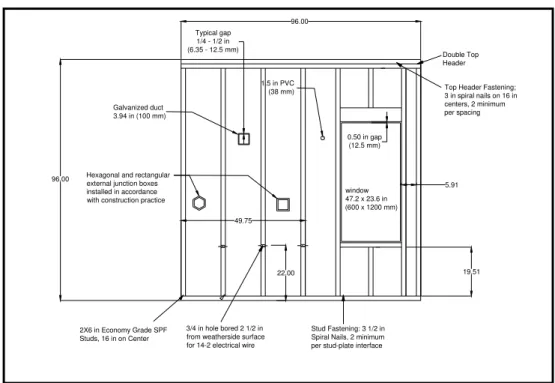
description of the six walls included in this paper. Figure 1 shows a schematic cross section diagram of a wall sample illustrating the construction details.
All walls included in this project were built using the conventional 2” by 6” wood stud frame construction. There were two reference walls filled with poly-wrapped and sealed glass fiber batts (WER-11 and WER-12) and four other walls (WER-AA to WER-DD) insulated with light density, open cell (6.8-12 kg/m3) spray polyurethane foam (SPF) insulation. Three walls were opaque and other three included variations of penetrations to simulate a window, electric boxes (indoor and outdoor), air vents (and ducting) and plastic pipes, as per the Canadian Construction Materials Centre (CCMC) Air Barrier Guide 07272 [5]. Figure 2 is a schematic of a wall sample with penetrations.
Table 1 A brief summary of wall description
Wall # Wall Description Comments
WER-AA Open cell foam-NO penetration
All walls were built according to common construction
practices WER-BB Open cell foam WITH
penetration
Foam is applied in the full cavity
WER-CC Open cell foam-NO
PENETRATION Same as above WER-DD Open cell foam-WITH
penetration Same as above WER-11 Poly-wrapped glass fiber, NO
penetration
Poly sheets are over lapped and sealed
WER-12 Poly-wrapped glass fiber, WITH penetration
Poly sheets are over lapped and sealed
Figure 1 A schematic cross section of the wall samples
96.00
96.00
2X6 in Economy Grade SPF Studs, 16 in on Center
Hexagonal and rectangular external junction boxes installed in accordance with construction practice
0.50 in gap (12.5 mm) Typical gap 1/4 - 1/2 in (6.35 - 12.5 mm) Double Top Header Stud Fastening: 3 1/2 in Spiral Nails, 2 minimum per stud-plate interface
Top Header Fastening; 3 in spiral nails on 16 in centers, 2 minimum per spacing
49.75
3/4 in hole bored 2 1/2 in from weatherside surface for 14-2 electrical wire
22.00 1.5 in PVC (38 mm) Galvanized duct 3.94 in (100 mm) window 47.2 x 23.6 in (600 x 1200 mm) 5.91 19.51
Figure 2 A diagram showing wall penetrations (CCMC Air Barrier Guide 07272)
TESTING PROTOCOL AND SEQUENCE:
- Air leakage rate before conditioning (at ∆P= 50 to 150 Pa) - Sample conditioning
- Air leakage rate after conditioning
- R-value in a guarded hot box at zero air leakage (and ∆T= 40 K)
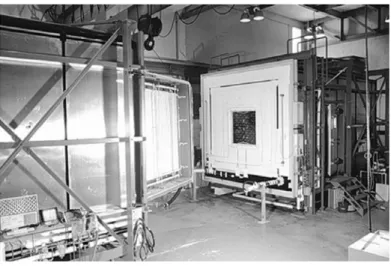
Figure 3 shows the air leakage and sample conditioning test facility, and Figure 4 is a picture of the NRC-IRC Guarded Hot Box (GHB). The test method used to determine the wall R-value is a well-established procedure developed at NRC-IRC and formed the basis for the ASTM GHB test standard and practice [7 and 8].
The material characterization of the open cell foam (light density, 6.8 to 12 kg/m3) was performed according to ASTM C 518 standard [9]. The test specimen was prepared according to the procedure outlined in ULC standard [10].
Figure 3: Air leakage and sample conditioning test facility
Figure 4: Guarded Hot Box test facility
All wall samples were conditioned according to the procedure detailed in the Canadian Construction Materials Centre (CCMC) Air Barrier Guide 07272 [5]. A pressure cycle
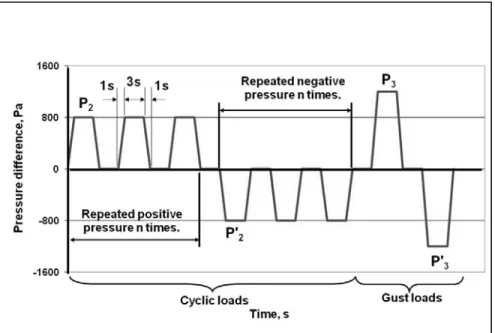
between +800 Pa and -800 Pa was applied to the sample in 2000 cycle (1000 cycle for +ve and 1000 for –ve pressure). A gust wind was simulated by a pressure wave of 1200 Pa (both negative and positive pressure pulse) and was applied to the wall sample accordingly. Figure 5 is a diagram showing the pressure cycles during the condition routine. The total estimated time for sample conditioning is 5 hours and 30 minutes.
Figure 5 A diagram showing the pressure cycle during sample conditioning.
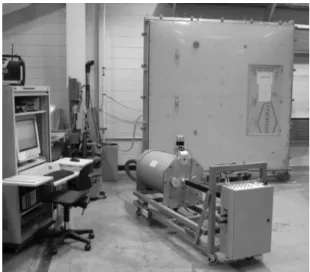
Figure 5 illustrates the wall sample conditioning routine as specified in the CCMC Air Barrier Guide. It shows the pressure cycle due to strong wind (up to 800 Pa), as well as the gust wind (up to 1200 Pa pressure pulse) in both positive and negative pressure pulses. This wall conditioning is a requirement to pass the CCMC certification. Figure 6 shows a wall sample mounted in the air leakage and conditioning test facility. The air leakage test method used is in accordance with ASTM E 283 [6].
RESULTS OF THE EXPERIMENTAL PATH:
A summary of the test results of all wall samples, included in this paper, is reported in the following sections. This includes air leakage tests before and after sample conditioning, GHB R-value and thermal conductivities of foam samples (material characterization).
Figure 6 A wall sample mounted in the air leakage and conditioning test facility.
SUMMARY OF AIR LEAKAGE TEST RESULTS:
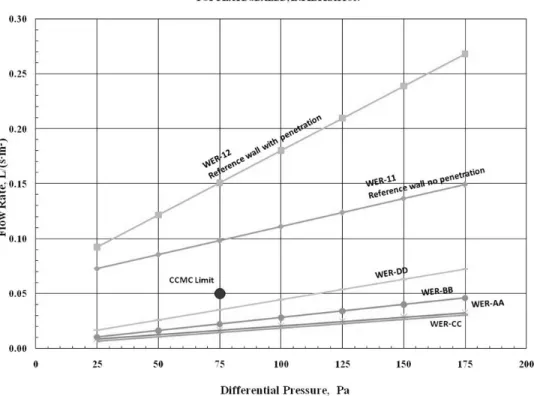
Figure 7 shows a summary of the air leakage test results of the six walls presented in this paper (i.e., two poly-wrapped and sealed glass fiber and four open cell foamed walls). The solid circle on the chart in Figure 7 signifies the maximum air leakage rate allowable to meet the CCMC Air Barrier requirements for walls (set at 0.05 l/(m2.s) at ∆P = 75 Pa). Figure 7 also shows that all foamed walls have met the CCMC requirement for air
barrier, whereas the two reference walls (poly-wrapped and sealed glass fiber walls) showed much higher air leakage rate at ∆P = 75 Pa.
There is a number of factors that may have contributed to the higher air leakage rate of the reference walls (WER-11 and 12). For example, cracks around the electric outlets and other penetrations were not sealed perfectly (compared to those in the SPF walls) and cracks at the corners where the studs meet the top and bottom plates may have
experienced similar imperfect seal. WER-11 and 12 were constructed according to common practices, and some efforts were made to improve their air tightness. However, it was beneficial to have wall samples that are “not very air tight” to check the validity of the developed WER procedure.
It is worth mentioning that many similar walls to WER-11 and 12 have passed the CCMC requirements as an air barrier. Therefore, it is important to interpret the results with caution.
Figure 7 Summary of the net air leakage test results of six walls
SUMMARY OF R-VALUE TEST RESULTS (GHB):
Figure 8 provides a summary of the R-value of the six walls as measured in the GHB at ∆P = 0 Pa and ∆T = 40 K (i.e., room side temperature = 20±1 ºC and weather side temperature = -20±1 ºC).
Figure 8 The R-value test results of the six walls measured in the GHB.
The R-value of all walls was expected to be close to RSI 3.52 (or R-20 on the British scale). However, construction details and other factors such as non-uniform thickness of foam, variability of foam density (see Material Characterization below), the presence of thermal bridges (such as wood studs), a dummy window (which was substituted by extruded polystyrene insulation), all contributed to the variation of the thermal resistance of the wall assemblies.
Although the focus of this study is not to determine the variability of the thermal resistance of wall assemblies or to compare the R-value of walls, it was critical for the development of the wall energy rating (WER) to determine, with GHB precision, the actual R-value of each wall.
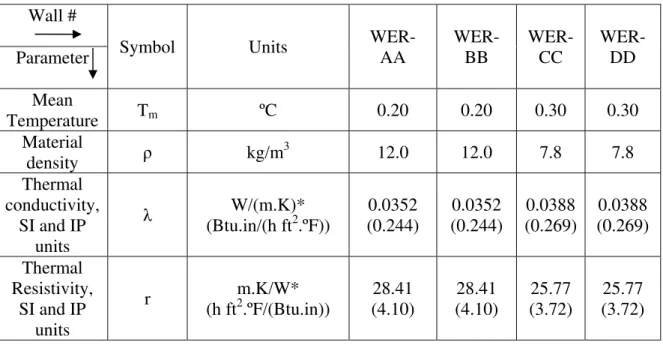
SUMMARY OF MATERIAL CHARACTERIZATION:
Table 2 provides a summary of the material characterization test results of the SPF as determined in the heat flow meter apparatus [9].
The thermal properties of the glass fiber insulation used in WER-11 and WER-12 were obtained from published thermal properties of insulation materials database [11].
As indicated earlier (when comparing the R-value of walls), the variability in the foam density from different manufacturers may have contributed to the difference in the final R-value of the walls. This is also reflected in calculated thermal resistivity (and thermal conductance) of the SPF.
Table 2 Summary of the material characterization test results of SPF.
Wall #
Symbol Units WER-AA WER-BB WER-CC WER-DD Parameter Mean Temperature Tm ºC 0.20 0.20 0.30 0.30 Material density ρ kg/m 3 12.0 12.0 7.8 7.8 Thermal conductivity, SI and IP units λ (Btu.in/(h ftW/(m.K)* 2 .ºF)) 0.0352 (0.244) 0.0352 (0.244) 0.0388 (0.269) 0.0388 (0.269) Thermal Resistivity, SI and IP units r m.K/W* (h ft2.ºF/(Btu.in)) 28.41 (4.10) 28.41 (4.10) 25.77 (3.72) 25.77 (3.72)
*IP (British) units are shown in brackets ( ).
THE ANALYTICAL PATH:
In this task, the focus is to develop a procedure to determine the wall energy rating (WER) of insulated wall assemblies. In addition, it is intended to reduce the financial burden on wall manufacturers by reducing the laboratory tests to a minimum. This is achieved by combining computer simulation models and wall test results to arrive at an accurate and reliable procedure to determine WER of walls constructed with different insulation material, with and without penetrations. The following is a summary of this task. More details about this task are the subject of other publications to be released in the future.
COMPUTER SIMULATION:
The NRC-IRC hygrothermal computer model, hygIRC-2D Model [12, 13, 14, 15, 16 and 17] was first used for the thermal and air leakage analysis of the wall assemblies.
However, an advanced version of this computer model is a 3D program called hygIRC-C, was used to determine the “apparent R-value” of wall assemblies with the presence of air leakage. The 3D model (hygIRC-C) was built on the same principles as hygIRC-2D and was benchmarked (supported with experimental work) against the 2D version. The comparison of hygIRC-2D and hygIRC-C produced almost the same R-value results, except that the 3D model (hygIRC-C) provided better analysis around the corners in 3D fashion (see Reference # 4 for detailed benchmarking of the two programs).
A brief summary of the computer model results and a comparison of the R-value of the six walls determined experimentally and analytically are presented below.
COMPARISON OF THE EXPERIMENTAL AND ANALYTICAL RESULTS:
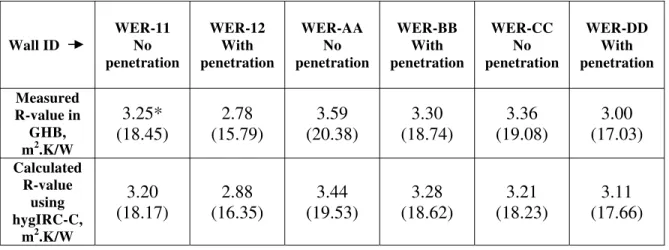
The hygIRC-C was used to calculate the R-value of all walls in the absence of air leakage through the assemblies. Table 3 and Figure 9 provide a summary of the GHB measured R-value at ∆P = 0 Pa, room side temperature of 20 ± 1 ºC and cold side temperature of -20 ± 1 ºC, and those calculated using hygIRC-C computer model at ∆P = 0 Pa. It is reported in the literature that the GHB test results are accurate within ± 6% [18], however the comparison between the GHB R-value and those determined by hygIRC-C model shows agreement better than ± 6%.
The next step is to use the hygIRC-C model to determine the “apparent R-value“ of the wall assemblies WITH the presence of air leakage. Table 4 provides a summary of the GHB R-value and the “apparent R-value” as determined using hygIRC-C computer model at three different pressure differentials across the walls (∆P= 0, 75 and 150 Pa). Table 4 shows that the presence of air leakage has a negative impact on the R-value of the wall assemblies, and hence, the overall thermal performance of the wall is decreased.
The result of this interaction between the air leakage and R-value is captured during the development of the wall energy rating.
Table 3 Comparison of the measured R-value and hygIRC-C results of six walls
Wall ID WER-11 No penetration WER-12 With penetration WER-AA No penetration WER-BB With penetration WER-CC No penetration WER-DD With penetration Measured R-value in GHB, m2.K/W 3.25* (18.45) 2.78 (15.79) 3.59 (20.38) 3.30 (18.74) 3.36 (19.08) 3.00 (17.03) Calculated R-value using hygIRC-C, m2.K/W 3.20 (18.17) 2.88 (16.35) 3.44 (19.53) 3.28 (18.62) 3.21 (18.23) 3.11 (17.66)
(*) R-value in IP units are shown in brackets ( ), h. ft2.ºF/Btu
Table 4 Comparison of measured R-value and the “apparent R-value” of walls with air leakage
Wall
Measured R-Value * (m2K/W)
Apparent R-Value Using hygIRC-C (m2K/W) ΔP = 0 Pa ΔP = 0 Pa ΔP = 75 Pa ΔP = 150 Pa WER-11 (NP) 3.25 (18.45)* 3.20 (18.17) 2.58 (14.65) 2.38 (13.51) WER-12 (P) 2.78 (15.79) 2.88 (16.35) 2.13 (12.09) 1.84 (10.45) WER-AA (NP) 3.59 (20.38) 3.44 (19.53) 3.31 (18.80) 3.23 (18.34) WER-BB (P) 3.30 (18.74) 3.28 (18.62) 3.14 (17.83) 3.04 (17.26) WER-CC (NP) 3.36 (19.08) 3.21 (18.22) 3.12 (17.72) 3.04 (17.26) WER-DD (P) 3.00 (17.03) 3.11 (17.66) 2.89 (16.41) 2.70 (15.33)
(*) R-value in IP units are shown in brackets ( ), h.ft2.ºF/Btu
In Table 4, the measured R-value (second column from the left) and the computer predicted R-value (at ΔP = 0 Pa) are very close and within the experimental tolerances. This comparison enhances the level of confidence in the computer predication of the thermal resistance of walls.
CORRELATION OF EXPERIMENTAL AND ANALYTICAL RESULTS
As indicated earlier, the main objective of this project is to develop a procedure to determine the overall wall energy rating (WER) of insulated walls that would take into account the impact of the air leakage on the overall thermal performance of the wall assembly. Figure 9 provides a comparison of the walls R-value as determined by measurements (in GHB) and as predicted using hygIRC-C 3-D computer model. This comparison is critical for the next step, when the wall “apparent R-value” is predicted with the presence of air leakage.
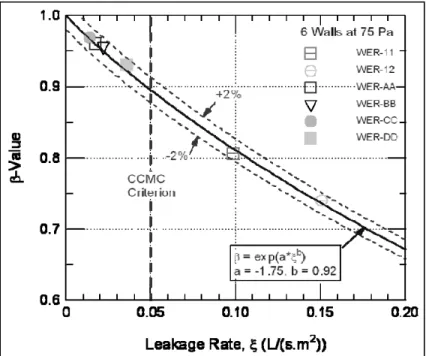
As explained above, and by investigating Table 4, it is observed that as the air leakage rate increases, the wall apparent R-value decreases. In order to capture the interaction between the air leakage rate and the “apparent R-value” of the walls determined with air leakage, RL, the results shown in Table 4 were used to develop a correlation between the
air leakage rate (ξ, l/(s. m2)) and the R-value ratio β, where Ro is the measured R-value at
∆P= 0 Pa. The parameter β is defined as:
(1)
The final expression for β is given by the following equation:
(2)
Figure 9 Comparison of measured and hygIRC-C computer model R-values.
Figure 10 Correlation between wall air leakage rate, ξ, and R-value ratio β.
The correlation coefficients (a=-1.75 and b=0.92) in Equation (2) are applicable to the six walls included in this paper. Currently, more walls are being tested, and revised
correlation coefficients are determined. They slightly vary from the values shown above. Obviously, the more wall samples included in the development of Equation 2, the better the final results one might expect.
FINAL FORM OF WALL ENERGY RATING (WER) OF INSULATED WALLS:
The expression for WER is a simple relationship in terms of the air leakage rate, ξ and the measured R-value of the wall at no air leakage (Ro in SI units). The final form is similar
to that developed for the energy rating of windows (ER) published by the Canadian Standards Association CSA A440.2 Standard [19]. Equation 3 provides the final expression for WER.
0 0 50 1 WER C T T RSI RSI
β
β
= − ⎛ Δ⎜ + Δ ⎛⎜ − ⎝ ⎠ ⎝ ⎠ ⎞ ⎞ ⎟ ⎟ (3)Conduction Air leakage heat loss heat loss Where:
C = 1, m2/W is a constant to normalize WER
The constant 50 in Equation 3 is intended to normalize the WER value and to make WER a positive number, since other two terms are always negative. In addition, to present a mathematically correct formula, a constant (C=1 m2/W) was introduced in Equation 3 in order to have a dimensionless WER in its final form. Therefore, WER in Table 5 is dimensionless and should be used only for product comparison purposes and not to be multiplied by area of a wall to give the heat loss in Watt/m2.
Table 5 provides a summary of WER determined for the six walls in this paper.
Table 5 A summary of WER determined for the six walls.
Wall ID Leakage at ∆P= 75 Pa, ξ (l/(s.m2) β-Value (---) Measured RSI0 at ∆P= 0 Pa (m2 K/W) (h.ft2.ºF/BTU) WER (---) WER-11 (NP) * 0.098 0.813 3.25 (18.45) 34.86 WER-12 (P) 0.151 0.736 2.78 (15.79) 30.44 WER-AA (NP) 0.017 0.959 3.59 (20.38) 38.38 WER-BB (P) 0.022 0.950 3.30 (18.74) 37.24 WER-CC (NP) 0.014 0.967 3.36 (19.08) 37.68 WER-DD (P) 0.036 0.922 3.00 (17.03) 35.53
(*) NP = No penetration and P = With penetration. IP units are in (--).
To illustrate the benefits and use of WER, three different cases are presented to show the impact of air leakage on the overall thermal performance of wall assemblies with
different air leakage rates.
Figures 11 through 13 provide three cases of insulated walls with different air leakage rate. In each case, the difference between the height of the bar on the left and that on the right is the reduction in WER as a result of air leakage through the wall. As the air leakage rate increases, the difference between the height of the two bars (in each figure) increases, hence a reduction in the overall thermal performance of the wall.
FUTURE WORK:
This project is a work in progress. New walls constructed with different insulation materials (e.g., cellulose fiber, blown fibers, etc.) are being considered for evaluation. It is imperative to add as many wall samples of different design and configuration to the group of walls already tested. This will add more data points to obtain better correlation coefficients that could be widely used in the construction industry. Ultimately, a draft of a national (and perhaps an international) standard will be considered by the relevant
organization. In addition, a proposal is being prepared for submission to the Canadian Construction Materials Centre for the development of a guide to determine WER of insulated walls.
Figure 11 A chart showing the effect of air leakage on WER of a wall with a high air leakage rate (0.62 l/(s.m2) at ∆P= 75 Pa
Figure 12 A chart showing the effect of air leakage on WER of a wall with a low air leakage rate (0.034 l/(s.m2) at ∆P= 75 Pa
Figure 13 A chart showing the effect of air leakage on WER of a wall with a very low air leakage rate (0.0221 l/(s.m2) at ∆P= 75 Pa
CLOSING REMARKS:
The presence of air leakage through wall has a clear negative impact on the overall thermal performance of the wall. This has been demonstrated by laboratory testing and analytical assessment of several walls insulated with different insulation materials.
An innovative procedure to combine laboratory testing and computer simulation was developed to determine the energy rating of insulated wall assemblies. This procedure proved to be a simple, accurate method and required minimum testing (only R-value in a Guarded Hot Box with zero air leakage and air leakage tests). The WER procedure is a tool for building designers and construction professionals that could be used to comply with current or future energy code requirements.
ACKNOWLEDGEMENTS:
The authors wish to acknowledge the contribution from the following: Canadian
Urethane Foam Contractors Association (CUFCA), Honeywell, BASF and Demilec. The authors also wish to thank Dr. Kumar Kumaran for his support and guidance during the development of the 3D hygIRC-C computer program and Mr. Mike Nicholls for his efforts in constructing the wall samples.
REFERENCES
[1] Bomberg, M.T.; Kumaran, M.K. 1989. "Report on sprayed polyure-thane foam with alternative blowing agents," CFCs and the Polyurethane Industry : Vol 2 : (A Compilation of Techni-cal Publications) pp. 112-128, 1989, (NRCC-31113) (IRC-P-1638).
[2] Kumaran, M.K.; Bomberg, M.T. 1990 "Thermal performance of sprayed
polyurethane foam insulation with alternative blowing agents," Journal of Thermal
Insulation, 14, (July), pp. 43-57, July, 1990, (NRCC-32365) (IRC-P-1695).
[3] Elmahdy, A. H., Maref, W. Swinton, M. C., Tariku, F. 2009. Energy rating of polyurethane spray foamed walls: procedures and preliminary results. 4th International Building Physics Conference, Istanbul, Turkey, 15-18 June, 2009.
[4] Maref, W., H. Elmahdy, M. C. Swinton and F. Tariku. 2009 Assessment of Energy Rating of Polyurethane Spray Walls: Procedure and Interim Results, ASTM 2nd Symposium on Heat-Air-Moisture Transpotr: Measurements and Implications in Buildings, Sponsored by ASTM C16 on Thermal Insulation, April 19-20, 2009, Vancouver, British Colombia, Canada.
[5] Canadian Construction Materials Center (CCMC). 1996. Technical Guide for Air Barrier Systems for Exterior Walls of Low-Rise Buildings, Masterformat Section 07272, National Research Council of Canada.
[6] ASTM 1997. E 283 Test Method for Rate of Air Leakage Through Exterior Windows, Curtain Walls and Doors, Philadelphia: American Society for Testing and Materials.
[7] ASTM 1998. ASTM C 1199 Test Method for Measuring the Steady State Thermal Transmittance of Fenestration Systems Using Hot Box Methods, Philadelphia: American Society for Testing and Materials.
[8] ASTM 1998-a. ASTM E 1423 Practice for Determining the Steady State Thermal Transmittance of Fenestration Systems, Philadelphia: American Society for Testing and Materials.
[9] ASTM 2004. ASTM C 518 Steady-State Thermal Transmission Properties by Means of the Heat Flow Meter Apparatus, Section 4, Volume 04.06, , Philadelphia: American Society for Testing and Materials.
[10] Underwriters' Laboratories of Canada (ULC): ULC S705.1-01, (Including
amendments 1&2) 2005. " Standard for Thermal Insulation - Spray Applied Rigid Polyurethane Foam, Medium Density Material - Specification". 7 Underwriters Road, Toronto ON, Canada M1R 3B4
[11] Kumaran, M.K., Lackey, J., Normandin, N., van Reenen, D., and Tariku, F.,2004. A Thermal Moisture and Transport Property Database for Common Building and Insulating Materials, Final Report, ASHRAE Research Project 1018-RP, Institute for Research in Construction, National Re-search Council, Ottawa, Ontario, Canada.
[12] Maref, W.; Kumaran, M.K.; Lacasse, M.A.; Swinton, M.C.; van Reenen, D. 2002-a "Laboratory measurements and benchmarking of an advanced hygrothermal model," Proceedings of the 12th International Heat Transfer Conference (Grenoble, France, August 18, 2002), pp. 117-122, October 01, 2002 (NRCC-43054).
[13] Maref, W.; Lacasse, M.A.; Kumaran, M.K.; Swinton, M.C. 2002-b "Benchmarking of the advanced hygrothermal model-hygIRC with mid-scale experiments," eSim 2002 Proceedings (University of Concordia, Montreal, September 12, 2002), pp. 171-176, October 01, 2002 (NRCC-43970) .
[14] Maref, W; Lacasse, M.A.; Booth, D.G. 2002-c Executive Summary of Research Contributions Related to Moisture Management of Exterior Wall Systems (MEWS) - Modeling, Experiments, and Benchmarking, Research Report, Institute for Research in Construction, National Research Council Canada, 127, pp. 15, December 01, 2002.
[15] Maref, W.; Lacasse, M.A.; Booth. D.G.2002-d Benchmarking of IRC's Advanced Hygrothermal Model - hygIRC Using Mid- and Large-Scale Experiments, Research Report, Institute for Research in Construction, National Research Council Canada, 126, pp. 38, December 01, 2002.
[16] Tariku, F.; Cornick, S.; Lacasse, M. 2007. Simulation of Wind-Driven Rain Effects on the Performance of a Stucco-Clad Wall. Proceedings of Thermal Performance of the Exterior Envelopes of Whole Buildings X International Conference. Dec. 2-7, Clearwater, FL.
[17] Tariku, F.; Kumaran, M. K. 2006. Hygrothermal Modeling of Aerated Concrete Wall and Comparison With Field Experiment. Proceeding of the 3rd International Building Physics /Engineering Conference, August 26-31, Montreal, Canada, pp 321-328.
[18] Elmahdy, A. H., 1992 "Heat transmission and R-value of fenestration systems using IRC hot box : procedure and uncertainty analysis," ASHRAE Transactions, 98, (2), ASHRAE Annual Meeting, pp. 630-637.
[19] CSA 2004. Canadian Standards Association: Energy performance of windows and other fenestration systems (CSA A440.2), 2004, 5060 Spectrum Way, Suite 100, Mississauga, Ontario, Canada, L4W 5N6.