HD28
.M41A
A
Behavioral
Analysis
of
Learning
Curve
Strategy
John
D.
Sterman,
Rebecca
Henderson,
Eric
D.
Beinhocker
and
Lee
I.Newman
A
BEHAVIORAL
ANALYSIS
OF
LEARNING
CURVE
STRATEGY
John
D.
Sterman*,
Rebecca
Henderson*,
Eric D.
Beinhocke^^
and Lee
INewman^
Abstract
Priorresearch
on
firm strategyin thepresenceof
learning curves suggeststhatiflearningishighly appropriable, early entrants
can
achievesustained competitiveadvantageby
rapidly buildingcapacity
and
by
pricingaggressively topreempt
competition.However
these studies allpresume
(1) rational actors
and
(2) equilibrium,implying
marketsclearatall pointsintime.We
considertherobustnessoftheaggressive strategy in thepresence of(1)
boundedly
rational agentsand
(2) acapacity acquisition lag.
Agents
areendowed
with highlocal rationalitybutimperfectunderstanding ofthe feedback structure ofthe market; they use intendedlyrational heuristics to
forecast
demand,
acquire capacity,and
set prices.These
heuristics aregrounded
inempirical studyand
experimental test.Using
asimulationoftheduopoly
casewe
show
theaggressive learningcurve strategy
becomes
suboptimalwhen
themarket
isdynamically
complex.
When
capacitycannot be adjustedinstantaneously, forecasting errors leadingtoexcess capacity
can
overwhelm
the costadvantage conferred
by
the learning curve.We
explorethesensitivity ofthe results tothefeedback
complexity
ofthemarket
and
therationality oftheagents' decisionmaking
procedures.The
results highlight thedanger
ofextrapolatingfrom
equilibriummodels
ofrationalactors totheformulation ofstrategic prescriptions
and
demonstratehow
disequilibrium behaviorand
bounded
rationalitycan be incorporatedintostrategic analysisto
form
a 'behavioralgame
theory'amenable
to rigorous analysis.
'
Sloan
School
ofManagement,
Massachusetts
Institute ofTechnology
^
McKinsey
&
Company
Pleasedirect
correspondence
toJohn
Sterman
attheMIT
SloanSchool
ofManagement, 50
Memorial
Drive,E53-351, Cambridge,
MA
02142,
orto<[email protected]>.
1.
Introduction
Learning
curveshave
been
identified in awide
variety ofindustries(Duttonand
Thomas,
1984),
and
an extensivetheoreticalliterature has exploredtheirstrategic implications.A
learningcurve createsa positivefeedback loop
by
which
a small initialmarket
shareadvantage leadstogreaterproduction experience,
lower
unit costs,lower
pricesand
still greatermarket
shareadvantage. In general, the literaturesuggeststhat inthepresence oflearningcurves
-
and
when
learning is privatelyappropriable
- fmns
should pursue an aggressive strategy inwhich
they seekto
preempt
their rivals,expand
outputand
reducepricebelow
the short-runprofitmaximizing
level(Spence, 1981;
Fudenberg and
Tirole, 1983, 1986; Tirole, 1990). Intuitively,such
aggressivestrategiesare superior
because
they increase bothindustrydemand
and
theaggressive firm'sshareofthat
demand,
boosting cumulativevolume,
reducing futurecostsand
building sustainedcompetitive
advantage
until the firmdominates
themarket.The
desirability of aggressivestrategiesin industrieswithlearningcurves hasdiffused
widely
inbusiness education, the popular businessliterature,
management
texts,and
publicpolicy debates (Rothschild 1990,Hax
and
Majluf
1984;Oster, 1990; Porter, 1980;
Krugman,
1990).and
learningcurve strategiesappear
tohave
ledtosustained
advantage
inindustriessuch
as synthetic fibers, bulk chemicalsand
disposable diapers(Shaw
and
Shaw
1984;Lieberman
1984,Ghemawat
1984,Poner
1984).However
inmany
industries, includingtelevisions,VCRs,
semiconductors, toysand
games,
lightingequipment,
snowmobiles,
hand
calculators,tennisequipment,
bicycles,chainsaws,
running
shoesand
vacuum
cleaners,aggressive pricingand
capacityexpansion
have
ledtosubstantialovercapacity
and
pricewars
thathave
destroyedindustry profitability (Beinhocker,1991; Salter, 1969; Porter, 1980; Saporito, 1992;
The
Economist,
1991;Business
Week,
1992).Existing
models
thatconsiderthecompetitive imphcations ofthe learning curveutilizethetraditional
assumption
thatmarkets clearatallpointsintime.Market
clearing inturn implies thatafirm's production capacity
and
other resourcescan be
adjusted instantaneouslytoequilibriumlevels, or, ifthere are capacity adjustmentlags, thatfirms
have
perfect foresightsuch
thattheycan
asit is needed. Neither
assumption
is valid: it takestime tobuildnew
factories,expand
existingones,
and
decommission
obsoleteones
(Mayer
1960,Jorgenson
and Stephenson
1967),and
forecastingovertypical planning horizons
remains
difficultand
error-prone(Armstrong
1985,Makridakis
etal. 1982,Makridakis
etal. 1993).The
presumption
in theliterature is thatcapacityadjustment
and
forecasterrorcorrection are fastrelative tothedynamics
ofthe learning curve sothatthe
assumption
ofperfectmarket
clearingis areasonable approximation.Inthis paper
we
show
thatrelaxing theassumptions
of instantaneousmarket
clearingand
perfect foresight leads, ina variety ofplausible circumstances,tocompetitive
dynamics
significantly different
from
those predictedby
much
ofthe existing literature.We
begin withareview
oftheliteratureon
strategy inthepresence oflearning curves.We
thendevelop
amodel
inwhich
the assumptions ofmarket
clearingand
rationalityarereplacedby
adisequihbrium,behavioral
framework
inwhich
fums
face lags in adjustingcapacityand
useboundedly
rationaldecisionheuristics to setprices
and
forecastdemand.
We
usethemodel
toexploretheimpact of anaggressive learning-curve strategyin a varietyof environments.
When
thedynamics
ofthemarket
are sufficiently slow,delays ininformationacquisition,decision
making,
and system
response are sufficiently short,and
thecognitivedemands
on
thefirms aresufficiently low,behavioral theory yieldspredictions observationally indistinguishable
from
those of equilibrium models.However
inmore dynamic
environments,inwhich
boundedly
rational forecastingtechniques
become
less accurate, the aggressivelearningcurve strategiesprescribedinthe
game
theory literaturebecome
inferior, asaggressiveexpansion
leadstoexcesscapacity.
We
closewithimplications forthestudyofstrategic competitioningeneral,arguingthatthe neoclassical assumptions of equilibrium
and
rationalitymay
inmany
realisticcircumstancesprove
tobe
adangerous
guidetoactionand
aweak
basisforempirical research.2.
Models
ofLearning
Curve
Strategy
Learning
curvesare a familiarphenomena.
Numerous
empiricalstudieshave
documented
theirexistence in a
wide
variety ofindustries, asHax
and Majluf
(1984, 112) note, "rangingfrom
Spence
(1979)examines
theeffectof competitiveasymmetries on
investmentdecisionsingrowth
marketswhere
there are learningeffects.He
notes thatlearningcurves allow forcreation ofasymmetric advantage and
thus createan
incentive topreempt
rivals.Spence
(1981) furtherquantifies optimal production policy
under
alearning curve, finding thatiffinnscan
perfectlyappropriate all thebenefitsoflearning,
and
ifthey canbe
sure ofafirstmover
position, then theyshould
expand
outputbeyond
the short-run profitmaximizing
level inordertocapturelearning-induced
costadvantage.Fudenberg and
Tirole (1986)and
Tirole (1990)present adynamic
analysisof a
duopoly
with alearning curve.Under
quantity competition they findthatanaggressive strategy
always
dominates.Under
pricecompetitionthe aggressive strategysucceeds indeterringrivalentry
and
in causingrival exit,butwhen
two
existingplayers preferaccommodation
thereis
no
clearlydominant
strategy apriori.Other
studieshave
examined
the sensitivity ofthese results todifferingdemand
conditionsand
appropriability assumptions.Majd
and Pindyck
(1989)show
that uncertaintyin future pricesreducesthe optimal expansion of output
beyond
the staticequilibriumlevel.Ghemawat
and
Spence
(1985)show
thatwhen
theeffects oflearningspillover
to competitorsthe incentives toexpand
output are also reduced. Similarconclusions arefound
in theliteratureon
theeffects oflearning
on
international trade(Krugman,
1987).Kalish (1983) addresses the interaction
between
learningand
productdiffusiondynamics
(word
ofmouth,
saturation).Word
ofmouth
creates ashadow
benefitofcurrent salesthatreinforces the incentive tocut price
and
expand
production as currentoutputbuilds theinstalledbase of
customers
who
in turnconvey
informationon
the benefitsoftheproducttothosewho
have
not yet purchased, accelerating product adopfion.
In
sum,
the literature suggeststhat iflearning is appropriable, ifprice is not highlyuncertain,
and
ifrivalscan be
reliedon
tobehave
rationally, then firms should pursue anaggressivestrategy of preemption, higher output
and lower
prices. Thisrecommendation
hasdiffused
widely
inbusiness education, the popular businessliterature,and
public policy debatesthe firm's capacity is
always
equaltodemand, implying
either thatthere areno
capacity adjustmentdelaysorthatfirms
have
perfect foresight so thattheycan forecastdemand
sufficiently far inadvance
toensurethattheyalways have
exactly the correct capacity.3.
A
Boundedly
Rational,
Disequilibrium
Model
To
explore therobustness ofthelearningcurve literature tothe assumptions ofperfectforesight
and
instantaneousmarket
clearing,we
developed
adisequilibrium, behavioralmodel
ofcompetitive
dynamics
inthepresence oflearning.Following
Kalish(1983),we
assume
that themarket goes
througha life-cycleof growth, peak,and
saturation. In contrast tothe literature,we
assume
capacity adjusts with alag,and
that firmshave
onlya limited ability toforecast futuresales.
These
assumptions areconsistent with a longtraditionof experimentaland
empiricalevidence
(Brehmer
1992,Collopy
and
Armstrong
1992, Diehland Sterman
1995,Kampmann
1992,
Mahajan
et al. 1990, Paichand
Sterman
1993, Parker 1994.Rao
1985,Sterman
1989a,1989b, 1994). In
models assuming
instantaneousmarket
clearingand
perfect foresight,themarket
clearing price can be derivedasanecessary property ofequilibrium, giventhe capacity decision.
However
in disequilibrium settings,bothpriceand
capacity targetsmust be
determined.Here
we
draw
on
the literature citedabove and
thewell-establishedtraditionofboundedly
rationalmodels,and
assume
that firms setprices with intendedlyrational decisionheuristics(Cyertand
March,
1963/1992;
Forrester 1961;Simon
1976, 1979, 1982;Morecroft
1985).The model
is formulatedincontinuous time as a setof nonlineardifferentialequations.Since
no
analytic solution tothemodel
isknown,
we
usesimulation toexplore itsdynamics'
While
themodel
portraysan
industry with an arbitrarynumber
of firms i=
{ 1, ..., n},we
restrictourselves to n
=
2 inthesimulationexperiments below.We
beginby
laying out the equationsdescribingthe
dynamics
ofdemand.
These
arebased
on
thestandardBass
diffusionmodel
(Bass,1969;
Mahajan
etal. 1990).We
then describe the physicaland
institutionalstructure ofthefirm,including orderfulfillment,
revenue
and
cost,thecapacity acquisition lag,and
the learning curve.Finally
we
discuss firmstrategy. Thissection is theheartofthemodel
and
contains thekey
Industry
Demand
The
total industryorderrate, Q", is thesum
of
theinitialand
replacement purchase rates,Q'
and
(^
(time subscripts are omittedforclarity):qo
=
Q'+
Q«. (1)Initialorders are given
by
theproduct oftherateatwhich
households
choose
to adopttheproductand
thus enter themarket and
theaveragenumber
ofunits ordered per household, |J.The
adoptionrate is therate
of
change
ofthenumber
ofadopters,M,
thus:Q'
=
|i(dM/dt). (2)Households
aredivided intoadopters oftheproduct,M,
and
potential adopters, N.Following
thestandard
Bass
diffusionmodel
adoption arisesthrough anautonomous
component
and
throughword
ofmouth
encounters with thosewho
alreadyown
theproduct:dM/dt =
N(a
+
pM/POP)
(3)where
a
is a constant fractional propensity for potential adopterstoadopt, (3 is thefractional rateatwhich
potential adopterschoose
toadopt given thattheyhave
an encounter with anadopter,and
theratio
N4/POP
isthe probability thatagivennonadopter
encountersan adopter(POP
isthetotalnumber
of households).The
number
ofpotential adopters remaining,N,
is thedifferencebetween
thenumber
ofpeople
who
will ever adopttheproduct,M*,
and
thenumber
thathave adopted
theproduct todate:N
=
MAX(0, M*
-M)
(4)where
theMAX
functionensures thatN
remains
nonnegativeeven
inthecasewhere
M*
dropsbelow
M
(as couldhappen
ifthe pricesuddenly
roseafterM
=
M*).The number
of peoplewho
willeventuallychoose
toadopt,M',
istheequilibrium industrydemand
and
isa function ofthe price oftheproduct.For
simplicitywe
assume
alineardemand
curve
between
the constraints<
M*
< POP:
M*
=
MAX(0,
MIN(POP, POP'
+
a(P"''" - P'))) (5)where
a
is theslopeof
thedemand
curve, P"^'" is thelowestpricecurrently available in themarket,The
replacement orderrate, Q"^, isthediscardrateofoldunits, D.summed
overall firmsinthe industry.
For
simplicitywe
assume
exponential discardsfrom
the installed baseofeach
finn:Q'
=
li Di. (6)Di
=
5li (7)where
I,isthe installedbase of firmi'sproductand 5
isthe fractionaldiscardrate.The
installedbaseis increased
by
shipments, Qj,and
decreasedby
discards:li
=
1(Q. - D,)dt+
lio. (8)Each
firm receives ordersO,
equal toa shareofthe industry orderrate.The
firm'sordershare. S^j, is
determined
by
alogitmodel
inwhich
product attractiveness.A, depends on
bothprice
and
availability. Availabilityismeasured by
thefirm'saveragedelivery delay,given (byLittle's
Law)
by
theratioof backlog, B,to shipments, Q):Oi
=
S°iQ°
(9)SOi
=
Ai/IjAj
(10)A
i=
[EXP(epPi/P*)][EXP(ea(Bi/Q,)/T)). (11)Both
priceand
deliverydelay are normalizedby
reference values(P*and
x', respectively)in thedetermination ofattractiveness.
The
parametersEpand
£a are the sensitivitiesofattractiveness toprice
and
availability, respectively.Note
thatbecause
thisis a disequilibrium model, ordersand
shipments
need
notbe equal.Market
share, definedaseach
firm'sshare ofindustry shipments.Si
=
Q/Z,Qj, will ingeneral equalthe firm's ordershare only in equilibrium.The
Firm
Firm
profitsarerevenue, R, less total cost,C
(the firmindex i is deleted forclarity). Totalcost consists offixed cost
Cf
plus variable costs Cy:7i
=
R-(Cf
+
Cv). (12)Because
ittakestimetoprocessand
fillorders, the priceoftheproductmay
change between
thetime
customers
placean orderand
receive the product.We
assume
customers
pay
theprice inaverage value
each
orderinthe backlog.The
average value ofeach
orderinthebacklog
is thetotalvalue oftheorder book,
V.
dividedby
thenumber
ofunitson
order:R
=
Q(V/B).
(13)The
valueoftheorderbacklog accumulates
the valueofnew
orders lessthe revenues received forordersshipped:
V
=
l(PO-R)dt
+
Vo. (14)Fixed
costsdepend on
unit fixedcosts, Uf,and
current capacity, K; variablecostsdepend on
unitvariablecosts, Uy,
and
production,Q.
Both
fixedand
variable costsper unit fallas cumulativeproduction experience, E, grows, accordingto a standardlearning curve.
Thus
Cf=UfK
(15)Cv =
UvQ
" (16)Uf-Ufo(E/Eo)T^
(17)Uv
=
Uvo(E/E())y (18)E
= lQdt + Eo
(19)where
Ufoand Uvo
are the initialvaluesof
unit fixedand
variablecosts, respectively,Eq
istheinitial level of production experience
and
y
is the strengthofthe learning curve.For
simplicitywe
assume
the firm maintainsno
inventoriesand
makes
all producttoorder."
Shipments
thusequal production,which
is theminimum
ofdesired production,Q',and
capacity, K. Desired production is given
by
thebacklog, B,and
thetargetdeliverydelay x*.Backlog accumulates
orders,O,
less production:Q
=
MIN(Q*,
K). (20)Q*
=
B/x*
(21)B
=
J(0
-Q)dt
+ Bo
(22)Capacity adjuststothetarget level
K* with an
average lagX. Specifically,we
assume
K
adjusts toK'
with athird-orderErlang lag, corresponding wellto the distributed lagestimated in investmentfunction research (Jorgenson
and Stephenson
1967):where
£
is theErlanglag operator.For
simplicity the lagissymmetric
forthecasesofincreasingand
decreasingcapacity.Firm
Strategy
Under
thetraditionalassumptions
ofperfect rationalityand
equilibrium,each
firm's targetcapacity
and
pricing behaviorwould
be givenby
thesolutiontothedifferentialgame
definedby
thephysical
and
institutional structureofthemarket
presentedabove.However,
in reality firmsdo
notdetermine theirbehavior
by
solvingdynamic programming
problems
ofsuch
complexity
(e.g.Camerer
1990, 1991).Business
schoolsdo
notteach futuremanagers
how
to formulateand
solvedynamic
programming
problems
when
setting strategy. Rather, firms use intendedly rationalheu-risticstoset prices
and
acquirecapacity,and
the analyticmodels
intheliteraturereachthemanagerial audience in the
form
ofrules ofthumb.
In thecaseofthelearning curve,books and
consultants prescribe rules
such
as"By
slashing pricesbelow
costs,winning
the biggest shareof
industry
volume,
and
acceleratingits cost erosion,acompany
[can] getpermanently
ahead
ofthepack...[and build] an unchallengeable long-termcost
advantage"
(Rothschild 1990, 181). hi thisspirit,
we
model
target capacityand
price withrealisticboundedly
rational heuristics,heuristicswhich
allow us to capturedifferent strategiesformanaging
the productlifecycleand
learningcurve, including the 'marketshareadvantage leadsto
lower
costs leads togreatermarket
shareadvantage' logic derived
from
the analytic literature. Inparticular,we
assume
the firm forecastsfuture
market
demand
and
then determineswhat
shareofthatdemand
itwould
liketocommand.
Target capacity therefore consistsofthe product ofthe firm's target
market
share, S*,and
itsforecast ofindustry
demand,
D'^,adjustedby
thenormal
rateofcapacity utilization u':K*
-
MAX[K"'",
S*D7u*]
(24)where K"""
is theminimum
efficientscaleofproduction.Because
ofthe capacity acquisitiondelay the firmmust
forecastdemand
A.yearsahead.We
assume
firms forecastby
extrapolating recent trends inobserved
industrydemand
(CoUopy
and
orderrate,
D^
aivdexponentially extrapolate the recentgrowth
in industry orders,g^
over
theforecasthorizon X^:
D'
=
D'EXP(?ifg')
(25)d(D')/dt
= (O
- D'Vx" (26)g'
=
ln(D',/D',.;,.)/?i^ (27)where
X^isthe historical horizonused
tocompute
theexpectedgrowth
rate indemand
G^.The
instantaneous, currentvalueofindustry ordersis not availableto firms
because
ittakes time tocollect
and
report the data,so the forecast isbased
on
the reported orderrate, given hereby
first-order exponential
smoothing
ofactual industryorders with asmoothing
time ofx^(Sterman 1987
provides empirical evidence consistentwith
such
forecastingprocedures forbothlong-termenergy
demand
forecastsand
short-terminflation forecasts).The
firm's targetmarket
share, S*,depends
on
its strategy.We
considertwo
strategies,'aggressive'
and
'conservative'. In the aggressive strategy,the firm followstherecommendation
ofthe learningcurveliterature
by
seeking amarket
share largeenough
tomove
thefirmdown
itslearningcurve fasterthan its rivals. Incontrast, the conservative firmseeks
accommodation
withits rivals
and
sets amodest market
share goal.We
alsoassume
firmsmonitor
theactions oftheircompetitors.The
aggressive strategyseekstoexploit the learningcurve notonly
by
settingan
aggressivemarket
share goal but alsoby
taking advantage offimidity, delayorunderforecasting
on
the partofits rivalsby
opportunisficallyincreasing itstarget
when
itdetects sufficient uncontesteddemand.
The
conservativestrategyseeks
accommodation
withits rivals, butfears overcapacityand
will cede addifional shareto avoidit.
Thus
targetshare is givenby
{
MAX(S""",
S") ifStrategy=
Aggressive
S*
=
<
(28)^j^^gmax
gu^jj:Strategy
=
Conservativewhere
S"^'"and
S"'''"are theminimum
and
maximum
acceptablemarket
share levels fortheexpectsto
be
uncontested.Expected
uncontesteddemand
is the differencebetween
the firm'sforecast ofindustry
demand
and
theirforecastof competitorcapacity.Expected
uncontestedmarket
shareis givenby
theexpected uncontesteddemand,
D", as afractionoftheprojectedindustry
demand:
S"
=
MAX(0,
D"/D'). (29)The
MAX
function maintains nonnegativity forS"even
when
thereis excessindustry capacity.Expected
uncontesteddemand
is thefirm's forecastofindustrydemand
lessthesum
ofthefmn's
estimatesofexpected competitorcapacity, K*^, adjusted
by
thenormal
capacity utilization rate u*:D"
=
D'
- u*Sj K'j, j^i. (30)In the basecase
we
make
thestrongassumption
that firms accuratelymonitor
theircompetitor'scapacity plans.
However,
we
assume
there is ashortdelay ofx'^ years required forthe firmtocarryoutthecompetitive intelligencerequiredtoestimate thecompetitor's targetcapacity
(exponential
smoothing
isassumed), soexpected competitor capacityK^
evolvesas:d(K'j)/dt
=
(K*j - K'j)/x'. (31)To
model
the price decision,we
assume
thatdue
toadministrativeand
decisionmaking
lags, price, P. adjusts toa targetlevel P*, with an adjustment time x'':
dP/dt
=
(P* - P)/x^ (32)The
pricesetting ruleassumes
the firmdoesnothave
theabilitytodeterminethe optimalpriceand
instead
must
searchfor anappropriate price level.We
assume
firms usethe anchoringand
adjustmentheuristic to
form
thetarget price.The
current priceforms
theanchor,which
is thenadjustedin responsetoconsiderationsofcost,
demand/supply
balance,and market
share,forming
a hill-climbingheuristic in
which
thefirm searchesforbetterpricesin theneighborhood
ofthecurrentprice, usingcosts,
demand/supply
balance,and market
share toassess the gradient.For
simplicity
we
assume
the target priceis a multiplicativelyseparable functionofthe variousadjustment factors,
and
thateach
adjustmentis linear inthe input variables. Finally,thefurnwillneverprice
below
unit variable costU^,.Thus
a'
>
0;a'
>
0; a'<
0. (33)The
threeadjustment terms capturethe firm'sresponse to unit costs, theadequacy
ofitscapacity to
meet
demand, and
itsmarket
sharerelativetoits target share.The
adjustmentparameters
a
determine thesensitivity ofpricetoeach
adjustmentpressure.The
firstterm, theadjustment forunit costs,
moves
target pricetowards
a base price P*^ givenby
unitcostsand
thenormal
profitmargin
m*:P^
=
(l+m*)(Uv
+Uf).
(34)The
firmalso respondstotheadequacy of
itscurrent capacity,measured by
thedesiredrateof production
Q*
dividedby
'normal production', definedas theproduction rate givenby
currentcapacity
and
thenormal
capacityutilization fraction u*.When
this ratioexceeds
unity, thefirm hasinsufficientcapacity
and
increases priceabove
the current level;excess capacity creates pressure tolower
price.Finally, thefirm attempts topricestrategically insupportofitscapacity goals
by
adjustingprices
when
thereisagap
between
itstargetmarket
share S*and
its current shareS.When
thefirmfinds itdesiresa greater share than itcurrently
commands,
itwilllower
price; converselyifmarket
shareexceeds
itstarget itwillincrease price,trading off theexcessmarket
share for higherprofits
and
signalingrivals its desiretoachieve a cooperativeequilibrium.The
price formulationis consistent withthe behavioralmodel
ofpriceinCyertand
March
(1963/1992), experimental evidence
(Kampmann
1992),and econometric
evidencefrom
a similarmodel
ofinterest rate settingbehavior (Hines 1987). Paichand
Sterman
(1993) createdaproductlifecycle simulation
microworld
similartothepresentmodel
asan
experimental system,and
estimatedasimilar
model
forpricingwhich
capturedthepricingbehavior ofthesubjects well.'4.
Results
We
beginby
confirmingthatunder
condifionsofperfect foresightand
instantaneousmarket
clearing the
model
reproducesthe conclusions oftheexisting literature.We
then exploretheeffectivenessofthelearningcurve strategy asthese
assumptions
aregradually relaxedby
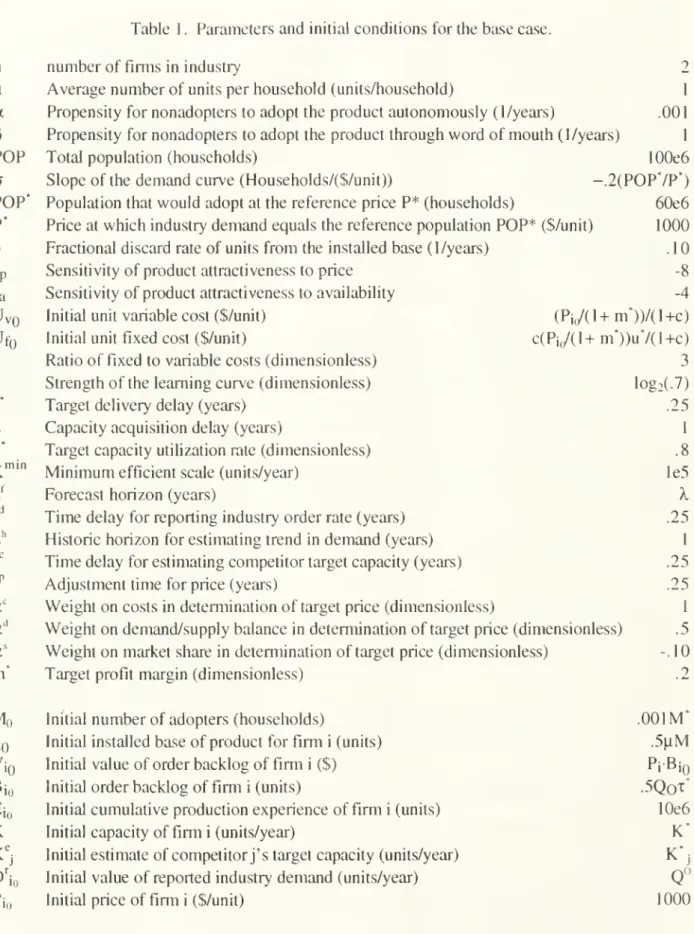
exploringFor
thebase case themodel
is calibratedtocapture thedynamics of
typicalconsumer
electronics items suchas
camcorders
(table 1).As
scalingparameterswe
setthe initial priceat$1000/unit,
and
thepotential size ofthemarket
at the initial priceto60
millionhouseholds,each
seeking[i
=
1 unit.The
product isassumed
tobe durable, with a10%/year
replacementrate.We
assume
a70%
learningcurve (costsfall30%
foreach
doubling of cumulativeproduction), atypical value fora
wide
range ofproducts.The
ratiooffixedto variable costs is 3:1.The
sensitivityof ordersharetoprice is high(Ep
-
-8),implying
products areonlymoderately
differentiated
by
non-price factors, ana
fortioriassumption
thatfavors the effectiveness ofthelearning curve strategy.
We
assume
short delaysof onlyone
quarteryearforthe reportingofindustry orders
and
theestimation ofcompetitortarget capacity. Ingeneral these parameters favorthesuccess ofa learning curve strategy
(we
presentsensitivity analysis below).We
examine
the behaviorofthemarket
forvaluesoftheword
ofmouth
parameter .5<
(3<
2.5. This range generates product lifecycle
dynamics
thatspan
much
ofthe variation inobserved
diffusion rates (Parker 1994,
Klepper
and
Graddy
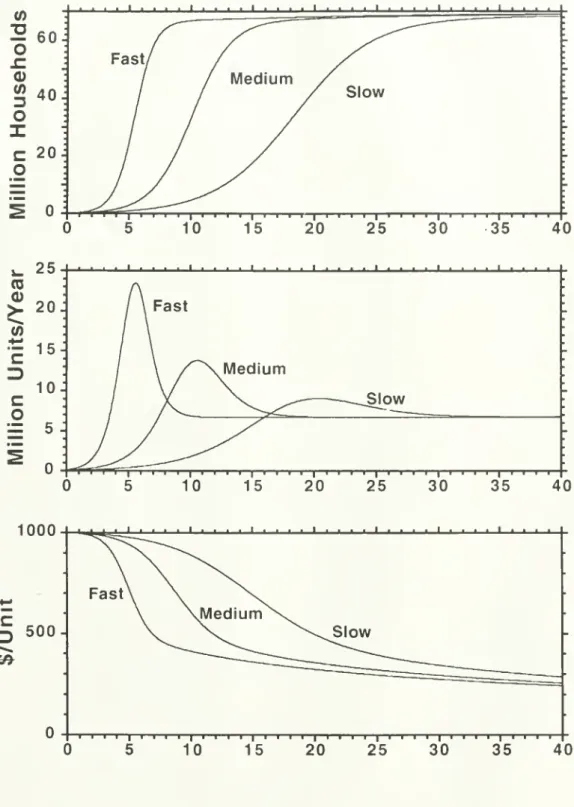
1990).For
illustration,we
define threescenarios fortheevolution ofindustry
demand:
Fa.st,Medium,
and Slow,
definedby
valuesof(3=
2, 1,
and
.5, respectively. Figure 1shows
theevolution ofthe industryorder rate generatedby
thedemand
sectorofthemodel
foreach
scenario,assuming no
capacity constraintsand assuming
thatprices follow unitcosts
down
the learningcurve (the targetmarket
shares forboth firms=
.5). Allexhibit aperiodofrapid
growth
followedby
apeak and
decline tothe equilibrium,replacement rateof
demand.
The
stronger theword
ofmouth
feedback,the greater thedynamic
complexity
ofthemarket: thefaster thegrowth, the earlier
and
higherthepeak
rate oforders,and
the larger thedecline
from peak
toequilibriumdemand.
Demand
in theslow
scenariopeaks
afterabout20
years,while in thefast scenario, the
peak
comes
atabout year6.Even
fasterdynamics have been
documented, such
as blackand
whitetelevisions, calculators,and
many
toysand games,
oftenwith only
a few
yearsfrom
boom
tobust.For each
ofthethreemarket
scenarios identifiedabove
we
testthe effectiveness oftheparameters
and
initial conditions, sotheplayingfield is level.Only
the strategyeach
uses forcapacity planning
and
pricingmay
differ.Note
in particularthatthe forecastingprocedure usedby
each
firm is identical,sothetwo
fimishave
consistent beliefs aboutindustrydemand
and
competitorcapacity. In theaggressive strategy, thefirm seeks at least
80%
ofthe market, largeenough
toprovidethefirm withasignificant advantage incumulative productionand
drive thelearning curvein its favoryet not so large as to invite antitrust action (theaggressive playerwill
increase its
market
sharegoalabove
80%
ifitperceivesthere is additional uncontesteddemand).
The
conservative playeris willingtosplit themarket
withits rival, but willcede
ifitperceivesa50%
sharewould
result inexcesscapacity.To
testwhether
themodel
reflectsthe competitivedynamics
analyzed inthe existingliterature,
we
beginby
assuming
that capacitycan instantly adjusttothe level requiredtoprovidethetarget rate ofcapacityutilizationat alltimes:
K
=
Q7u*.
(23')The
'perfect capacity' case correspondstotheequilibriumassumption
thatthemarket
always
clears,either
because
capacitycanbe
adjusted instantly, orbecause
agentshave
rafionalexf)ectations
and
perfect foresight sothattheycan perfectly anticipate the capacity acquisition lag.The
market always
clearswithno
unintendedbacklog
accumulations,and
capacity utilizationalways
equalsthe target rate. Pricesthusrespond
onlyto unit costsand
thegap between
the firm'starget
and
actualmarket
share.The
price rule yieldsbehaviorconsistent with therecommendations
intheliterature: the aggressiveplayerwill respondtotheinitial
gap between
targetand
actualmarket
shareby
reducingpricebelow
the short-termequilibrium.Table
2shows
discounted cumulativeprofits forthe threemarket
scenarios.(Throughout
thepaper
we
use a discountrateof4%/year and
simulate themodel
for40
years.The
results arerobust to rates
from
toat least20%/year.) In allcases theresult is a prisoner'sdilemma.
Even
though
the payofftothe cooperative,conservative strategy [C,C]maximizes
the net presentvalueof cumulativeprofit forboththeindividual firms
and
the industry,each
player has astrategiccontinue toplay theconservativestrategy.
However,
afirmthat finds itselfplaying conservativewhile the otherpursuesthe learningcurve strategy
would
improve
theirpositionby
defecting, so[A,
A]
is thedominant
strategy. Aggressivelyexploiting the learningcurve is thedominant
strategyiffirms
must
irrevocablyand
independentlychoose
theirstrategy atthebeginning oftheindustry, ifthefirmcancredibly
commit
totheaggressive strategyand
persuade its rival toacquiesce, orifthefirst
mover
gains sufficientadvantage
before rivalscan
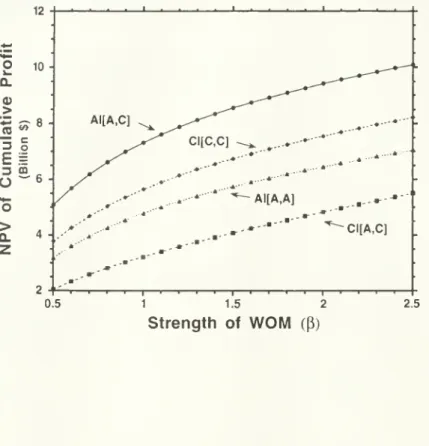
respond.The
fasterthedynamics
ofthemarket
unfold, the greaterindustry profits are forany
strategy
combination
(figure2
shows
the relativepayoffsinthemarket
clearingcaseas functionsof
theword
ofmouth
parameter
[3). Strongerword
ofmouth
bringspeople intothemarket
sooner,hence
boosting cumulative profit. Consistent with Kalish(1983), theadvantage
oftheaggressivestrategy,
and
thus thestrategic incentivetodefect, increaseswiththespeed oftheproduct lifecycle.Similarly, sensitivityanalysis
shows
thatthe stronger the learning curve, the greateris thestrategicincentivetoplay theaggressive strategy.
These
resultsshow
themodel
conforms
tothegame-theoretic resultwhen
we
assume
instantaneous
and
perfect capacityadjustment.An
appropriablelearningcurvemakes
it optimaltoexpand
capacityand
pricebelow
the short-run profitmaximizing
level.The
stronger the learningcurve, the greater the incentive topursuetheaggressivestrategy. Likewise, thefasterthe
growth
ofthe market, thegreateris the
advantage
ofthe aggressivestrategy.We
now
examine
thecasewhere
thefirm faces thecapacityadjustmentlagand must
therefore forecast industry
demand
and
competitorresponses, as specifiedby
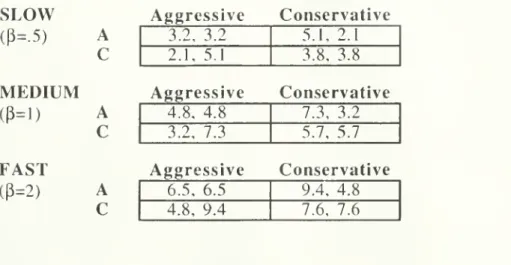
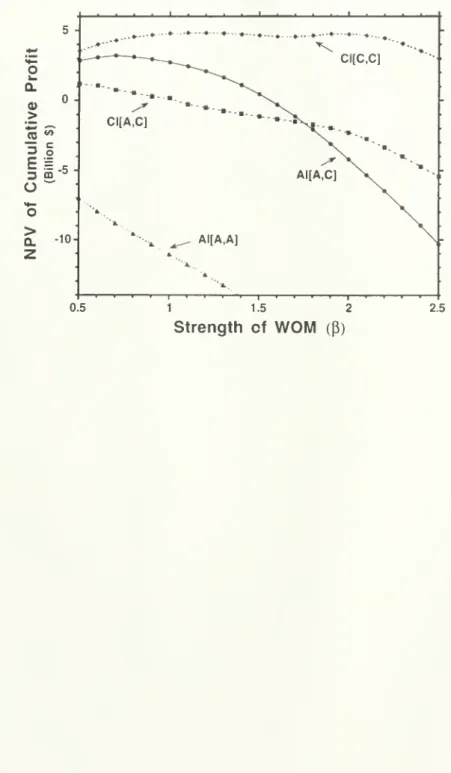
thebehavioral rulesinequations 23-34. Figure 3
shows
thepayoffsastheydepend on
theword
ofmouth
parameter;table 3
shows
the payoff matricesforthe different scenarios.The
capacity adjustmentlagand
behavioral decision rulesdramaticallyalterthepayoffstothe different strategies.
As
longas themarket
dynamics
aresufficiently slow, the firm's capacity forecasts are accurateenough
and
theaggressive strategydominates.
However,
formarket
dynamics
fasterthan those givenby
acriticalvalue ofthe
word
ofmouth
parameter, P*^'^^=1.3, theconservative strategydominates
theincentivetodefect,
and
[C,C]
becomes
the uniqueNash
equiUbrium.Note
thepenaltyimposed
when
both firmsplaythe aggressive strategy ismuch
greaterthan in themarket
clearing case.To
identifywhy
the payoffschange
so dramaticallywhen
theequilibriumand
perfectforesight
assumptions
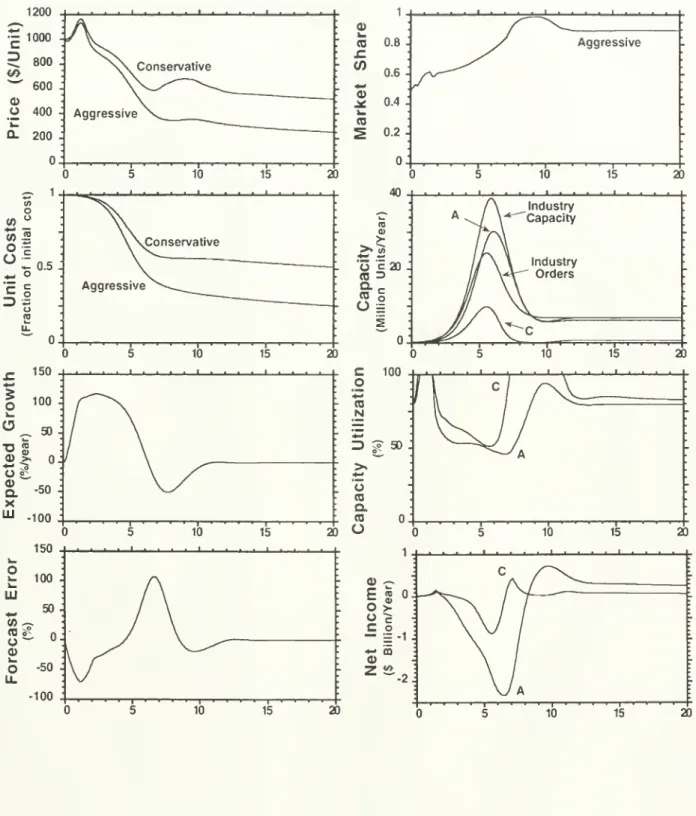
are relaxed, figure4a
shows
thedynamics
ofthe [A,C]
case forthe fastmarket
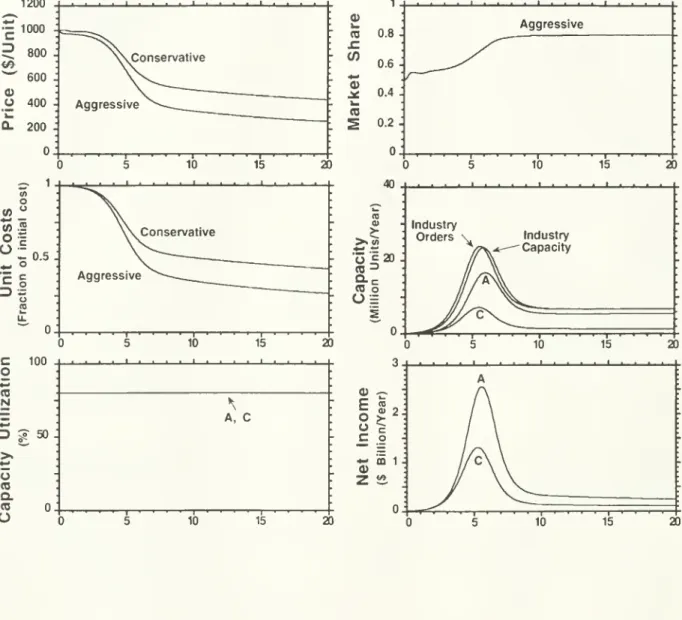
scenario, while figure4b shows
thesame
scenario forthecasewhere
capacity adjustsinstantaneously. In bothcases,the aggressive firm
immediately
perceives agap between
its initialshare of
50%
and
its goal of80%,
and
cuts price, hi thecase withthe capacity lag, theaggressivefirmalsosets target capacityto
80%
ofits forecast ofindustrydemand.
The
demand
forecastextrapolates the rapidly risingindustry orderrate. Afterabout
one
year, thefirmexpectsindustrydemand
togrow
ata rate inexcess of 100%/year, causingtarget capacity toincrease wellabove
thefirm's currentcapacity requirements
and
swellingthe supplyline ofcapacityon
order.Due
to thecapacityacquisifion lag
and
thedelay in perceiving industry orders,bothfirmsreach full capacityutilization afterabout .5years. Capacity
remains
inadequate until year about 1.5.During
thistime, excessbacklogs
accumulate
and customers
are forcedto wait longer thannormal
fordelivery.The
capacitycrunch
causes bothfirmstoboostpricesabove normal
levels,though
theaggressivefirmcontinues toprice
below
theconservative firm.Such
transient price bubbles are oftenobserved
during thegrowth
phases of highly successful products, as occurredforexample
with
radios,black
and
white television,and
colortelevisions(Dino
1985)and
more
recentlywith 1Mbit
DRAM
chipsand Harley-Davidson
motorcycles.Beginning
in about year2,and
acceleratingdramaticallyafterabout year4,the market,though
growing, experiences a decline in the fractionalgrowth
rate.As
thedataare reported, thefirm lowersits forecast
of
futuregrowth
rates, butdue
to the lagsin thereporting ofindustryorders, inassessingthe
growth
ratefrom
historicalorderrates,and
in adjustingcapacity tothetarget, actualcapacitybegins toovershoottherequiredlevel,
and
capacityutilization fallsbelow
normal.
As
industry orderspeak and
decline, shortlybefore year6, both firmsfind theirforecastshave
gone
badlywrong,
leavingthem
with excesscapacity.The
aggressive firmsuffersthe most,duringthe
same
periodbeen growing
atanadditional ratetoincrease itsmarket
share (notethattheaggressor's capacity
peaks
lateraswell as higher than thatoftheconservative firm).As
boom
becomes
bust, theaggressive fimi finds capacity utilization dropsbelow
50%. The
conservativefirmalsoexperiencesexcess capacity, butthe
magnitude and
duration oftheproblem
issignifi-cantlylesssince theconservative player has
been
steadilygivingup market
shareduringthegrowth
phase, partially offsettingits excessivelyoptimistic forecasts.The
patternofcapacityovershootis
widespread
inmaturing
industries (Porter 1980),and
was
frequentlyobserved
inPaich
and
Sterman's (1993) experimental product lifecycle task,even
when
subjectshad
experi-ence
with thedynamics.As
aresultoftheexcesscapacity generatedby
the saturationofthemarket,both firmsexperiencea periodoflosses as revenues
drop
below
fixedcosts.The
lossesoftheaggressive firm,
however,
are substantially largerthan those oftheconservative firm.The
aggressor generates a net lossof
more
than$2
billionperyearas industry salespeak around
year6.
Though
the aggressive firm earns superiorprofits afteryear8 these fail tocompensate
foritsearlier losses, leavingitwith discounted cumulative profits of-$1.7billion
by
year40.The
failureoftheaggressivestrategywhen
themarket
dynamics
are rapid isnotdue
tothefailureofthe learning curvetoconfercost advantage
on
theaggressive firm.As
inthe perfectcapacity case, the aggressive strategyachieves its intended goal:
low
pricesand
rapidexpansion
quickly givethe aggressor acost
advantage
which
steadilywidens
as the industrymoves
throughits lifecycle. Indeed,at the
end
ofthe simulation, theaggressive firm has unitcostsonly42%
asgreat asits rival, a largeradvantage thanit
enjoyed
in the perfectcapacity case.The
failureoftheaggressivestrategy is
due
entirely tothecombination
ofthe capacityadjustment lagwithabound-edlyrational forecastingheuristic.
When
capacity adjusts perfectly theaggressive strategyalways dominates
theconservativestrategy
and
fastermarket
evolutionincreases the advantage oftheaggressive strategy(figure 2).Incontrast,
when
firms facea capacity adjustmentlag, the costsof
excess capacityinduced
by
forecast error increase withthe speed oftheproductlifecycle. Eventually,the costs of excess
inferior(figure 3).
As
thedynamic
complexity
ofthemarket
environment
grows, oras thecapacity acquisition lag increases, the likelihoodofsignificant capacity overshoot grows,
and
anaggressive strategy
becomes
significantly lessprofitable than theconservative strategyeven
ifa
firmis ableto
commit
to an aggressivestrategysecure intheknowledge
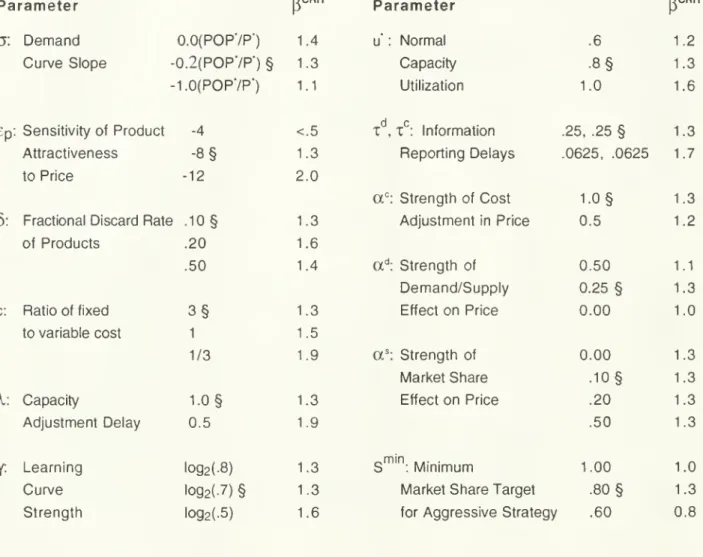
thatits rivalwillcede.Sensitivity
Analysis
Before
drawing
any
general conclusionsfrom
theresultsitis importanttoexplorethedegree to
which
they are sensitive toassumptions. Despitesubstantial variationsinkey
parameters(table 4),the critical valueofthe
word
ofmouth
parameterabove
which
thelearning curve strategybecomes
inferior, P^"^'^,remains
inthe rangefrom
2.0to lessthan .5,corresponding
to salespeaks
from
five totwenty
years afterproduct launch, well withintherangedocumented
fornumerous
real products (Parker 1994).We
have
made
anumber
ofassumptions
thatreducethe attractiveness ofa
learningcurvestrategy. First,to theextent capacitycan be
used
tomake
followon
productsthe costsofcapacityovershoot will
be
mitigated.Second,
we
assume
there areno
economies
ofscope
allowingfollow-on or related products toshare inthe benefitsoflearning.
To
the extent learningcan be
passed
on
toother products,thereby conferringadvantage
to them, the costsof capacity overshootare offset
even
ifcapacity is not fungible with successorproducts. Third,we
assume
there areno
returnsto scaleor other positive
feedback
processessuch
asnetwork
externalities. Additionalpositive feedbacksor other sources of increasingreturns favortheaggressorjustas a stronger
learningcurve increases the
advantage
ofthe aggressive strategy (seee.g.Arthur
1989). Fourth,we
assume
thereisno
growth
in the underiying poolofpotential customers. This toowould
reducethe severity ofthe saturation peak. Fifth,
we
assume
a durable product.More
frequentrepurchasesreducesthe
dynamic
complexity
ofthemarket
and
themagnitude
ofthe declinefrom
peak
toreplacement sales rates.One
ofourkey
behavioralassumptions
is that firms forecastindustrydemand
by
extrapolating past
demand
and have
no
advance
knowledge
ofthe market'ssaturation point. In thesaturation. Clearly, betterforecasting
would
favortheaggressivelearning curve strategy, asshown by
theresultsofthemarket
clearing case.The
evidence
is notencouraging. InPaichand
Sterman's (1993) experimental version ofthe present
model,
subjects consistently failed to forecastthesalespeak, leadingtoexcesscapacity
and
large losses similartothosesimulatedhere- even
afterextensiveexperience with the task. Outsidethe laboratory,a
wide
range ofnew
productdiffusion
models have been developed
which, in principle, allow forecastingofthe salespeak
(Parker
1994 and
Mahajan
etal.1990
reviewtheextensive literature). In practice,diffusionmodels
oftenmiss the turning point as well, since,asMahajan
etal. (1990) write,"by
thetimesufficientobservations
have
developed
for reliableestimation, it istoo latetousethe estimates forforecastingpurposes."
Rao
(1985)examined
theabilityoften
popularmodels
to predictsalesoftypical durable goods.
Mean
absolutepercent forecast errorsaveragedmore
than40%
across allmodels and
products.The
extrapolativemodels
generallyoutperformed
thediffusion models.On
theotherhand
anumber
ofourassumptions
tendto increase theadvantage of anaggressive strategy.
We
assume
learning is perfectly appropriable, increasing theabilityoffirmstogain sustained cost advantage.
We
assume
market
shareis quiteelastic sothatmodestly lower
pricesbring significant share advantage, strengthening thepositive feedbacks created
by
thelearn-ing curve.
We
alsoassume
that productionadjusts instantaneously atconstant marginalcost (untilcapacity utilization reaches
100%), and
that capacitycan beadjusted continuouslywith an averagelagofjust
one
year, lessthan the typical lagsestimatedin theliterature.There
areno
capacityadjustmentcostsorexit costs.
A
longer capacity lagormore
realistic adjustmentcostswould
sig-nificantly increase the
magnitude
and
cost offorecasterrors.We
omit
balancesheetconsiderationsand
thus the risk of bankruptcy: aggressive firmsthatultimatelydo
wellmight
notsurvive thelossesofthetransition
from
boom
tobust,again favoringthe aggressive strategy.The
informationon
which
the firm bases its decisions is free ofnoise,measurement
error, bias, or otherdistortion.We
assume
firmscan
base their forecastson
industry orders,reported with onlyaone
-quarteryearlag,
when
inmost
industriesorderdata are unavailableand
firmsmust
relyon
estimatesofindustrydemand
(orders) withcapacity(which
may
constrainshipments
below
therateofincoming
ordersduring periods ofrapid
demand
growth).Most
importantly,we
assume
thatthecompetitor'splanned
capacitytargetis fullyknown
with onlya short delay.Relaxing
any
oftheseassumptions
strengthensourresults
and
causestheaggressive strategytobe
dominated
by
theconservativestrategy at
lower
ratesofmarket
growth and
for lessdurable products.The
assumption
thatfirmsknow
their rivals'planned
capacity levels bears closerexamination. Extensive experimental studies
(Sterman
1989a, 1989b, Paichand
Sterman
1993,Diehl
and Sterman
1995,Kampmann
1992)show
inawide
range ofexp)erimental markets thatpeople ignore or give insufficient
weight
tothe supply line ofpending
capacity or production.The
tendency
toignorethesupply line (andmore
generally, failing toaccount fordelays,e.g. Brehm.er1992) isrobust: itoccurs
even
in settingswhere
thecontentsof
thesupply lineare availablecostlessly
and
atall times, areprominently
displayed,and
are highlydiagnostic,and
where
subjects
had
financial incentives toperform
well. Failuretoaccount fortime delaysand
supplylines appearstobe
common
in realmarkets
as well. Studiesshow
few
real estatedevelopers, forexample,
takeaccountofthe supplyline ofprojectsunder
development
(Thornton 1992,Bakken
1993), leadingtoperiodic overbuilding. Figure5
shows
the payoffs inthecasewhere
we
assume
firms
do
notaccount forthesupply lineofpending
capacity but instead usethecompetitors'current capacity to estimate uncontested
demand:
K'j
=
Kj. (31')When
thesupplyline is ignoredtheaggressive strategyis inferiorforall themarket environments
tested. Ignoringthesupply lineensuresthatduringthe
growth
phaseeach
firmerroneouslybelievesits rivalis
expanding
capacitymuch
less thanit actually is,and
overestimates uncontesteddemand.
The
aggressive playeropportunisticallyincreases its targetcapacitystillfurtherand
theconservative playerfailsto
cede
sufficiently, leadingtoamuch
largerovershootofcapacityand
much
larger losseswhen
themarket
saturates.The
aggressive strategy isdominated
by
theconservative strategy
even
intheslow
scenariowhere
demand
forthe productpeaks
20
yearsafter5.
Discussion
and
Conclusions
Priorresearch has
shown
thatunder
assumptions
of equilibriumand
perfect rationality, theoptimal strategy fora firmfacing a learning curveis toaggressively
preempt
competitors, cuttingprice
and
boosting outputbeyond
the staticoptimum
levels.We
have
shown
thatunder
amore
realistic set
of
assumptions,thenormative resultcan
be reversed.When
there arecapacityadjustment lags,
commonly
usedforecasting heuristics leadtocapacity overshootas amarket
saturates. Investingin additional capacity
and lower
prices to achievelearning benefitsisonlyoptimal
when
thedynamic
complexity ofthemarket,and hence
the riskofcapacityovershoot, islow. In thesecircumstances fully
and
boundedly
rationaldecisionmaking
converge.However,
asthe
dynamic
complexity
ofthemarket
increases,disequilibriumeffectsand
systematicdecisionmaking
errorsbecome
more
important,and
cause the predictions oftherationalmodel
to fail.These
conclusions are consistentwith experimentaland
empirical evidence.The
resultspredictthatlearningcurvestrategies will
perform
bestinindustrieswhere
there isslow
demand
growth
(orwhere
customer awareness
ofthe product category is alreadyhigh),theproduct has ahighrepeatpurchaserate
and
is fairly undifferentiated,orwhere
capacitycan beadjusted rapidly atlow
cost. Observationsthat learningcurve strategiesgenerally led tosustainedadvantage inindustries
such
as synthetic fibers, bulk chemicals,and
disposable diapers(Shaw
and
Shaw
1984,Porter 1984,
Lieberman
1984,and
Ghemawat
1984
respectively) arebroadly consistentwiththisprediction. Similarly, ourresultspredict
poor
performance
foraggressive strategies in industrieswith high
word
ofmouth,
durable, differentiated products, orlong capacity adjustmentdelays.The
overcapacity,excess inventory,and
pricewars observed
in industriessuch
as televisionsand
VCRs,
toysand games,
lightingequipment,
snowmobiles,
hand
calculators,tennisequipment,
bicycles, chain saws, semiconductors,
and running
shoes citedearliersupport thisproposition.The
resultshave
implicationsboth forpracticingmanagers and
forthe larger issueofthemodeling
toolsmost
appropriate for the study ofstrategicbehavior.The
recommendation
topursue alearningcurve strategy
must always be
treated withcaution. Currenttextsand
theoryrecommend
aggressivepreemption
inthepresence ofstrong, appropriable learning curvesor otherpositivefeedbacks thatconferincreasingreturns.
Our
resultsshow
thatfirmsmust
also determinewhether
they are vulnerabletocapacityovershoot orunderestimationof competitorcapacityplans.A
firmelectingtopursue a learningcurve driven strategymust
devotesignificant effort tounderstandingthe
dynamics
ofmarket
demand
sothatitisnotcaughtunprepared
by
market
satu-ration. It
must
clearlyand
credibly signalits capacity intentionsina rapidlygrowing market
sothatlessaggressiveplayers will not unintentionally overbuild.
To
prevent competitoroverbuilding, itmay
find itoptimal toshareits forecastsand market
intelligencewithrivals.Experience
and
experimentalstudies suggestthat thisisboth hard
medicine
totakeand
difficulttocarry outsuccessfully. Rather,it appearsthat
when
highdynamic
complexity
increases the riskofcapacityovershoot, firms should consider conservative strategies
even
inthe presence oflearningcurvesand
othersources ofincreasingreturns,allowinglesssensible rivals to play theaggressivestrat-egy, then
buying
these rivalsatdistress priceswhen
theyfail duringthe transitionfrom
boom
tobust.
Jack
Tramiel
followedjustsuch
astrategy, purchasingAtarifrom
Warner Communications
afterthe
peak
inthevideogame
market
for$160
million inunsecured
debtand
no
cash,whileWarner
took a$592
millionwriteoffofAtari assetson
topof$532
million in Atari losses.On
the methodologicalfront, ourresultssuggest thattheequilibriumand
rationalityassumptions
ofgame
theoryand
microeconomics
arenot robust.More
realisticphysical,institutional
and
behavioralassumptions
can reverse the neoclassical resultand
reveals amuch
more complex
relationbetween
thelearning curve, thedynamics
ofdemand
and
firmstrategy.When
thesystem
dynamics
are sufficiently slow, the delaysin informationacquisirion,decision
making
and system
response sufficiently short,and
the cognitivedemands on
theagentssufficiently low, behavioraltheorieswill yield predictions observationally indistinguishable
from
thoseof equilibrium models.
However,
incases of highdynamic
complexity,boundedly
rationalpeoplecan
and
do
behave
significantly differently.The
case ofthe learningcurve inadynamic
market
shows
these differencescan
matter greatly,and
theirimpact
canbe
examined
rigorously.D-4354 22
differencesinavariety
of
other contexts.Such
cases arelikelyto includesettings inwhich
therearelong time delays
between
actionand
effectorin the reportingofinformation,where
there arepositive feedback processes (increasingreturns),
and
where
there are significant nonlinearities(Stemian
1994,Arthur
1994). Likelyexamples
include markets such as shipbuilding, real estate,paper,
and
many
othersplagued
by
chroniccyclicality,and
industries withnetwork
externalitiesand
standard formation issuessuch
astelecommunications
and
software.We
suggestthecombination
ofgame
theoreticreasoningwith behavioralsimulationmodels
can help createameaningful
'behavioralgame
theory'(Camerer
1990, 1991),thatis, a behaviorallygrounded,empirically testable,
and
normatively usefultheory of disequilibriumdynamics
in strategic settings.NOTES
1
The model
is solvedby
Eulerintegration withatimestepof .0625 years.The
results are notsensitivetothe use of smaller time stepsorhigher-orderintegration
methods.
2. Includinginventories
would
substantially destabilize thesystem (Sterman
1989b); omittinginventoriesisthus
an
a
fortioriassumption.3. Paich
and
Sterman
(1993) estimatedaslightly differentform
ofthemodel,
inwhich
therewas
no market
share effect.They
found
the cost effectwas
very strong, whilethe response totheReferences
Armstrong,
J.S. (1985)Long
Range
Forecasting.2nd
ed.John
Wiley
&
Sons,New
York.
Arthur,
W.
Brian, (1989)"Competing
Technologies, Increasing Returns,and Lock-In by
Historical Events,"
Economic
Journal, 99, 116-131.Arthur,
W.
Brian, (1994) IncreasingReturns
and
Path
Dependence
in theEconomy.
Ann
Arbor:University of
Michigan
Press.Bakken,
Bent, (1993)"Learning
and
TransferinDynamic
DecisionEnvironments," Unpublished
Ph.D.
thesis,MIT
Sloan
School
ofManagement.
Bass, F.
M.
(1969)A
New
Product
Growth Model
forConsumer
Durables.Management
Science. 15,
215-227.
Beinhocker, E. (1991)
"Worlds
ofWonder
(A)and
(B)."MIT
SloanSchool
ofManagement
Case
Study. Availablefrom
Prof.John Sterman, Cambridge,
MA
02142.
Brehmer,
B. (1992)Dynamic
DecisionMaking:
Human
ControlofComplex
Systems.Acta
PsychologicaSl,
21 1-241.Business
Week
(1992) "L.A.Gear
StillLooks
Like
anAlso-Ran."
December
21, p. 37.Camerer,
C.F. (1990) "BehavioralGame
Theory." Insights in DecisionMaking:
A
Tribute toHillelJ. Einhorn., Hogarth,
R.M.,
Ed.,The
University ofChicago
Press,Chicago.
Camerer,
C. F. (1991)"Does
StrategyResearch
Need
Gaine Theory?"
StrategicManagement
Journal, 12 (Winter, special issue) 137-152.
Collopy, F.,
and Armstrong,
J. S. (1992) Expert opinionsabout extrapolationand
themystery of
the
overlooked
discontinuities. InternationalJournal of
Forecasting. 8,575-582.Cyert,
R.M.
and March,
J.G. (1963)A
Behavioral
Theory of
theFirm. Prentice Hall, NJ.Diehl, E.,
&
Sterman,J. D. (1995) Effects ofFeedback
Complexity on
Dynamic
DecisionMaking.
OrganizationalBehavior
and
Human
Decision Processes,62(2), 198-215.Dino, Richard (1985) Forecasting the Price Evolution of
New
Electronic Products.Journal of
Forecasting. 4, 39-60.
Dutton, J.M.
and
Thomas,
A. (1984) "Progress Functions asa Managerial
Opportunity."Academy
of
Management
Review,
9,235-247.
The
Economist.
(1991) "Japan'sChip
Makers:
FallingOff
theLearning Curve."
Feb. 23, 64-66.Forrester,J.
W.
(1961) IndustrialDynamics.
Cambridge
MA:
The
MIT
Press.Fudenberg,
D.and
Tirole, J.J. (1983)"Learning
by Doing
and
Market
Performance." BellJournal of Economics,
14,522-530.
Ghemawat,
P. (1984) "CapacityExpansion
in theTitanium Dioxide
Industry."Journal of
Industrial
Economics.
33, 145-163.Ghemawat,
P.and
Spence,M.
(1985) "LearningCurve
Spilloversand
Market
Performance."Quarterly
Journal
ofEconomics,
100, 839-852.Hax,
A.C,
and
Majluf, N.S. (1984) StrategicManagement:
An
IntegrativePerspective.Prentice-Hall,
Englewood
Cliffs, NJ.Hines, J. (1987)
Three
essays in behavioraleconomic
modeling.Unpublished
Ph.D.dissertation,
MIT
SloanSchool
ofManagement.
Jorgenson, D.,
and
Stephenson, J. (1967)The
Time
Structure of InvestmentBehavior
inUnited
States
Manufacturing, 1947-1960.
Review
of
Economics and
Statistics. 49, 16-27.Kalish, S. (1983)
"Monopolist
PricingwithDynamic
Demand
and
Production Cost."Marketing
Science, 2, 135-159.
Kampmann,
Christian(1992)"Feedback
Complexity and Market Adjustment
in ExperimentalEconomics," Unpublished
Ph.D. Thesis,MIT
Sloan School
ofManagement.
Klepper, S.
and Graddy,
E. (1990)"The
Evolution ofNew
Industriesand
theDeterminants
ofMarket
Structure." RAJ^IDJournal of Economics,
21, 27-44.Krugman,
P. (1987)"The
Narrow
Moving
Band,
theDutch
Disease,and
theCompetitive
Consequences
ofMargaret
Thatcher:Notes
on Trade
in the Presence ofDynamic
ScaleEconomies." Journal of
Development
Economics.
27, 41-55.Krugman,
P. (1990) Rethinking International Trade.MIT
Press,Cambridge,
MA.
Lieberman,
M.B.
(1984)"The Learning
Curve
and
Pricingin theChemical
ProcessingIndustries."
RAND
Journal of Economics. 15,218-228.
Mahajan,
v., Muller, E.,and
Bass, F. (1990)"New
Product DiffusionModels
in Marketing:A
Review
and
DirectionsforResearch."Journal of
Marketing, 54, 1-26.Majd,
S.,and
Pindyck, R.S. (1989)"The Learning
Curve
and Optimal
PricingUnder
Uncertainty."
RAND
Journal of Economics,
20,331-343.
Makridakis, S. et al. (1982)
The
accuracy ofextrapolation(time series)methods:
resultsofaforecastingcompetition.
Journal of
Forecasting, 1, 111-153.Makridakis, S.,et. al. (1993)
The
M2
competition: areal time judgmentallybased
forecastingstudy. International
Journal of
Forecasting, 9, 5-22.Mayer,
T. (1960) Plantand
equipment
lead times. Journal of Business. 33, 127-132.Morecroft,J. (1985) Rationalityin theanalysis of behavioral simulation models.
Management
Science 3l{7),
900-916.
Oster,
S.M.
(1990)Modern
CompetitiveAnalysis.Oxford
University Press,New
York.
Paich. M.,