Publisher’s version / Version de l'éditeur:
Journal of the Acoustical Society of America, 117, April 4, pp. 1709-1712, 2005-04-01
READ THESE TERMS AND CONDITIONS CAREFULLY BEFORE USING THIS WEBSITE.
https://nrc-publications.canada.ca/eng/copyright
Vous avez des questions? Nous pouvons vous aider. Pour communiquer directement avec un auteur, consultez la
première page de la revue dans laquelle son article a été publié afin de trouver ses coordonnées. Si vous n’arrivez pas à les repérer, communiquez avec nous à [email protected].
Questions? Contact the NRC Publications Archive team at
[email protected]. If you wish to email the authors directly, please see the first page of the publication for their contact information.
Archives des publications du CNRC
This publication could be one of several versions: author’s original, accepted manuscript or the publisher’s version. / La version de cette publication peut être l’une des suivantes : la version prépublication de l’auteur, la version acceptée du manuscrit ou la version de l’éditeur.
Access and use of this website and the material on it are subject to the Terms and Conditions set forth at
An Artificial neural network approach for predicting architectural speech security (L)
Xu, J.; Bradley, J. S.; Gover, B. N.
https://publications-cnrc.canada.ca/fra/droits
L’accès à ce site Web et l’utilisation de son contenu sont assujettis aux conditions présentées dans le site LISEZ CES CONDITIONS ATTENTIVEMENT AVANT D’UTILISER CE SITE WEB.
NRC Publications Record / Notice d'Archives des publications de CNRC:
https://nrc-publications.canada.ca/eng/view/object/?id=e66ba208-8e75-4fd2-bf4e-eaa6676081d2 https://publications-cnrc.canada.ca/fra/voir/objet/?id=e66ba208-8e75-4fd2-bf4e-eaa6676081d2
An Artificial neural network approach for predicting architectural speech security (L)
Xu, J.; Bradley, J.S.; Gover, B.N.
NRCC-48322
A version of this document is published in / Une version de ce document se trouve dans : Journal of the Acoustical Society of America, v. 117, no. 4, April 2005, pp. 1709-1712
An artificial neural network approach for predicting architectural speech
security (L)
Jingfeng Xu
School of Architecture, Design Science and Planning, University of Sydney, NSW 2006, Australia
John S. Bradley and Bradford N. Gover
Institute for Research in Construction, National Research Council, 1200 Montreal Road, Ottawa, Ontario KIA 0R6, Canada
Date uploaded to the JASA manuscript submission system: August 26, 2004
ABSTRACT
Signal-to-noise (S/N) type measures have been developed for predicting architectural speech privacy and speech security, which is required to accurately rate the probability of a listener outside a room being able to overhear conversations from within the room. However, these measures may not be ideal for speech security situations. In the present work, an approach that uses the artificial neural networks to directly represent the functional relationship between the octave band (250 Hz – 8 kHz) S/N ratios and the speech intelligibility score and security thresholds has been investigated. The artificial neural network (ANN) approach provides a direct and accurate method for predicting the speech intelligibility score and security thresholds.
I. INTRODUCTION
Speech security can be described on three different levels. The first level would be when only a very small percentage or none of the overheard words are intelligible. The second level is when no words are intelligible and it is often still possible to recognise the cadence or rhythm of the speech. Finally, the highest level of speech security would be when all speech sounds from the adjacent space are completely inaudible1. Speech privacy and speech security have been related to S/N type measures, where the signal is the speech from the adjacent space. The simplest measure is the difference of A-weighted speech and noise levels. More sophisticated measures such as the Articulation Index (AI)2 and its more recent replacement the Speech Intelligibility Index (SII)3 are known to be better related to speech intelligibility within rooms. However, Gover and Bradley1 have shown that SII and AI cannot be used to describe conditions for high levels of speech security which would correspond to acoustical conditions below SII=0, where SII is not defined. The difference in A-weighted levels is not limited in this way but it is much less accurately related to intelligibility scores. A more successful measure is the SII-weighted S/N ratio, which is a weighted sum of one-third-octave-band S/N ratios using the same frequency weightings as the SII measure. Although the SII-weighted S/N ratio predicts the intelligibility score and threshold reasonably well, the S/N loudness ratio provides a more accurate estimation of the thresholds of cadence and audibility1.
In the present work, an approach that uses the artificial neural networks (ANNs) to directly represent the functional relationship between the octave band (250 Hz – 8 kHz) S/N ratios and the speech intelligibility score and security thresholds has been investigated. The objectives of the ANNs are to predict a) the speech intelligibility score, namely the percentage of words
correctly identified by each individual, b) the intelligibility threshold, namely the percentage of listeners able to correctly identify at least one word, c) the cadence threshold, namely the percentage of listeners able to detect the cadence of the speech and d) the audibility threshold, namely the percentage of listeners able to hear the presence of the speech.
The ANN approach provides a direct and accurate method for predicting the speech intelligibility score and security thresholds. ANNs are inherently capable of representing non-linear systems. They learn from historical data and model input–output functional relationships. The history and theory of ANNs, their advantages and shortcomings in applications and their future utility have been presented elsewhere4, 5, 6 and will not be presented here. A brief overview of how ANNs operate is presented by Nannariello et al.7 and Li et al.8.
II. DATABASE FOR ANN MODELS
Two speech intelligibility and security experiments were carried out by Gover and Bradley1 at the Institute for Research in Construction (IRC), National Research Council Canada (CNRC). In the first intelligibility experiment (intelligibility scores and the intelligibility threshold), 36 subjects each listened to 340 test sentences. Subjects were then divided into two groups, 19 “better” subjects and 17 “worse” subjects, in accordance with their mean intelligibility scores across all 340 sentences. A follow-up experiment intended to determine not only the intelligibility score and the intelligibility threshold but also the thresholds of cadence of the speech and audibility of any speech sounds. In this second experiment the 19 “better” subjects from the first experiment each listened to 160 sentences. Details of these two experiments are presented by Gover and Bradley1.
The results of 19 “better” subjects in the above two experiments constitute the database for the ANN models in the present work. The 9500 (19 x (340 + 160)) individual intelligibility score test cases were used as the database for predicting the intelligibility score. Of the 9500 cases, 7600 were used for training, 950 for verification and 950 for testing. All the sentences in the first and second experiments, viz. 500 (340+160) sentences (cases), were used as the database for predicting the intelligibility threshold. Of the 500 cases, 310 were used for training, 95 for verification and 95 for testing. For predicting the cadence threshold and the audibility threshold the 160 sentences (cases) in the second experiment were used as the database. Of the 160 cases, 128 were used for training, 16 for verification and 16 for testing.
III. INPUTS AND OUTPUTS OF ANN MODELS
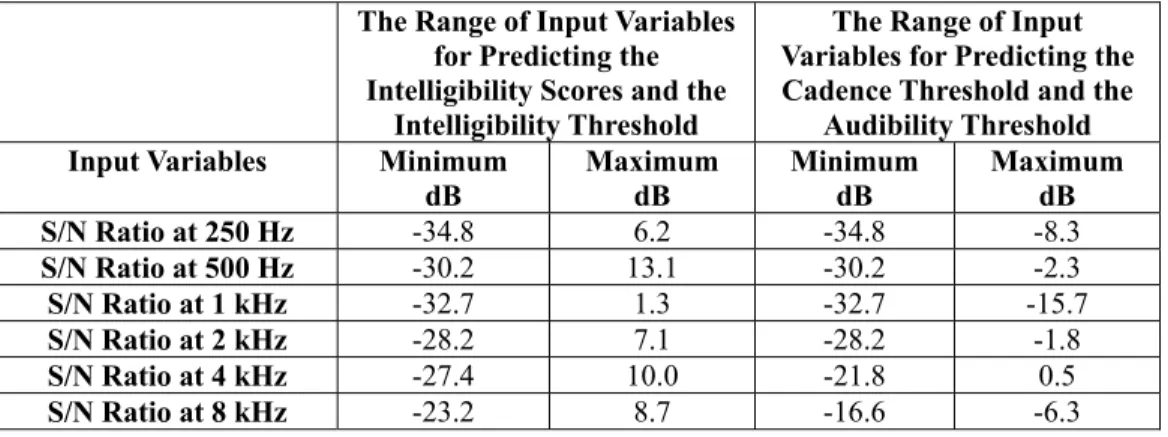
The inputs of the ANN models for all the four prediction situations are the octave band (250 Hz – 8 kHz) S/N ratios, that is to say, the difference in the transmitted speech level and the background noise level at each octave frequency band from 250 Hz to 8 kHz. The range of the input variables for predicting the intelligibility score and the intelligibility threshold when considering both experiments is different from that for predicting the audibility and the cadence thresholds when accounting for only the second experiment. Table I provides the range of each input variable of the four ANN models. The outputs of the ANN models are the intelligibility score, the intelligibility threshold, the cadence threshold and the audibility threshold and are within the range of 0 – 100%.
Figure 1 illustrated the 3-layer feed-forward ANN architecture applied in the present work. One hidden neuron layer, with 3 hidden neurons, was used. The ANN analysis was undertaken using STATISTICA Neural Networks9. The weights, which were initialised to uniformly-distributed random values using the “uniform method”, were adjusted by using “back propagation” and “conjugate gradient” algorithms to minimize the prediction error during the training. Conditions were set within the STATISTICA Neural Networks program by altering the model’s parameters. “Early stopping” and “weigend weight regularization” techniques were used to control over-fitting. Training of ANNs was stopped when the RMS error of the verification set could no longer be improved. The test set was used to independently check the performance of the network when an entire network design procedure was completed.
V. MODUS OPERANDI OF ANN MODELS
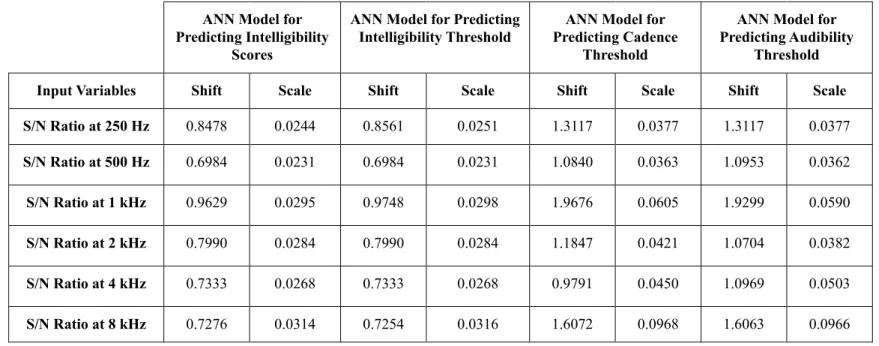
For the present work, the pre-processing of the inputs involves scaling input values to an appropriate range suitable for use in the ANN. Input values are multiplied by a scale factor, followed by the addition of a shift factor. Table II provides the shift and scale factors to input variables of each ANN model. These factors are automatically generated by the scaling algorithm of the STATISTICA Neural Networks9.
Each pre-processed neuron is multiplied by a scalar weight connecting the first layer neurons to the hidden layer neurons. At each neuron within the hidden layer, the weighted inputs are summed and bias value is subtracted from the summed weighted inputs. The resulting value is passed through a non-linear activation function, in this work, sigmoidal logistic function (1 / (1 +
e-x), where x is the resulting value). Table III provides the weights and biases linked to hidden neurons of each ANN model attained by training.
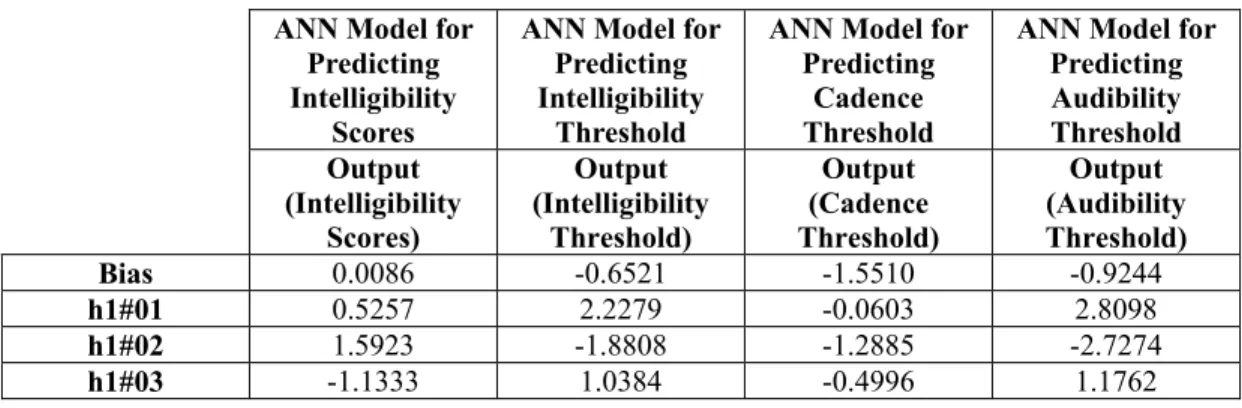
The output value of each hidden neuron is multiplied by the scalar weights for each connection between the hidden layer and the output neuron. The weighted outputs are summed and a bias value is subtracted from the sum to produce a single output value. Table IV provides the weights and biases linked to the output neuron of each ANN model attained by training.
The output is post-processed by subtracting the shift factor, followed by division by the scale factor. In the present work, the shift factor and scale factor are 0 and 1 respectively in all the four situations as the range of outputs has already been normalised between 0 and 1 in the original database.
Work carried out by Nannariello et al.10 and Xu et al.11 presented a method of how to embed a ANN model into a standard spreadsheet. The same procedure can be adopted with those details provided in Table II – Table IV.
VI. RESULTS OF ANN ANALYSIS
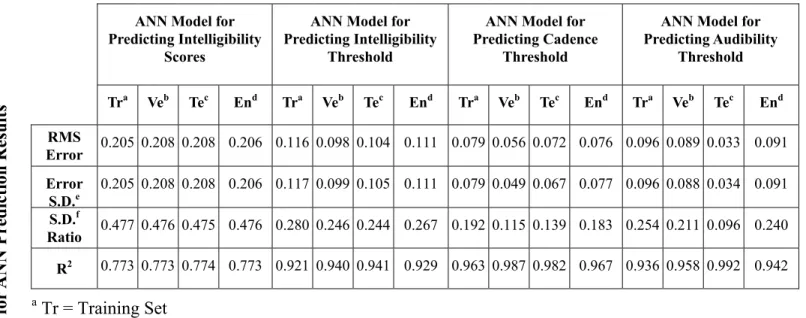
Table V presents the statistical analysis results based on the ANN models specified in the above section. In a regression problem, the standard deviations (S.D.) of both the prediction error and original output data are important and they can be related by the S.D. ratio. The S.D. ratio in a regression problem is the ratio of the S.D. of the prediction error to that of the original output data (an S.D. ratio of 0.1 is considered an excellent fit of the data and an S.D. ratio of 1.0 is a
poor fit) 9. The correlation coefficients R2 (the “coefficient of determination”) of the ANN predictions over the entire data sets for the intelligibility scores, intelligibility threshold, cadence threshold and audibility threshold were 0.773, 0.929, 0.967 and 0.942 respectively. For comparison, in the work of Gover and Bradley1, the SII-weighted S/N measure has an R2 of 0.762 for predicting the intelligibility scores and an R2 of 0.919 for predicting the intelligibility threshold and the S/N loudness ratio has an R2 of 0.956 for predicting the cadence threshold and an R2 of 0.899 for predicting the audibility threshold.
VII. DISCUSSIONS AND CONCLUSIONS
The present work indicates that the ANN approach provides a direct and accurate method for predicting speech intelligibility scores and security thresholds. The current method for predicting the speech intelligibility and privacy is first to develop a certain index and then relate the index to the subjective scores using a transfer function.1, 2, 3 The ANN approach can use the S/N ratio information to directly predict the subjective speech intelligibility score and security thresholds. Compared with the previous work1 that used one-third octave band S/N ratios, the ANN approach produced comparable, or better in terms of the audibility threshold, prediction results using only the “octave band” S/N ratios.
Specifics of the ANN models for predicting the speech security and intelligibility scores are also provided in the present work. With this information, ANN models can be embedded into standard spreadsheet applications, thus allowing predictions to be made in a transparent and direct fashion.
Similar investigations that use one third octave band (160 Hz – 8000 Hz) S/N ratios have also been conducted in the present work. However, the results of the one third octave band analysis were only slightly better than those of the octave band analysis. This may be due to the information in adjacent one third octave bands being highly correlated and therefore not contributing any significant new information to the ANN.
The present work only takes into account the S/N ratios in predicting the architectural speech intelligibility score and security thresholds. Other factors, such as talker gender and voice characteristics, speech material, room characteristics and so on could be included into the ANN models to investigate the possibility of further improving the prediction accuracy.
ACKNOWLEDGEMENTS
The authors here are grateful to Professor Fergus R. Fricke at the School of Architecture, Design Science and Planning, University of Sydney, Australia and Dr. Joseph Nannariello at Renzo Tonin & Associates Pty Ltd, Australia for their valuable comments on the present work. The present research was conducted under an Australian Postgraduate Award and a School of Architecture Design Science and Planning Supplementary Scholarship.
REFERENCES
1
B. N. Gover and J. S. Bradley, “Measures for assessing architectural speech security (privacy) of closed offices and meeting rooms,” J. Acoust. Soc. Am., 116, 3480-3490 (2004).
2
ANSI S3.5-1969, “American National Standard Methods for the Calculation of the Articulation Index,” American National Standards Institute, New York, NY, U.S.A.
3
ANSI S3.5-1997, “American National Standard Methods for Calculation of the Speech Intelligibility Index,” American National Standards Institute, New York, NY, U.S.A.
4
J. Hertz, A. Krogh and R. G. Palmer, Introduction to the Theory of Neural Computation (Addison-Wesley, Redwood City, 1991.)
5
A. Browne, Neural Network Analysis, Architectures and Applications (Institute of Physics Publishing, Philadelphia, 1997.)
6
J. Nannariello, M. R. Osman, and F. R. Fricke, “Recent developments in the application of neural network analysis to architectural and building acoustics,” Acoust. Aust., 29, 103-110 (2001).
7
J.Nannariello and F. R. Fricke, “Introduction to neural network analysis and its application to building services engineering,” Build. Serv. Eng. Res. Technol., 22, 58-68 (2001).
8
F. F. Li and T. J. Cox, “Speech transmission index from running speech: A neural network approach,” J. Acoust. Soc. Am., 113, 1999-2008 (2003).
9
StatSoft. STATISTICA Neural Networks version 4.0A manual (StatSoft Inc, Tulsa OK, 1999.)
10
J. Nannariello and F. R. Fricke, “A neural-computation method of predicting the early interaural cross-correlation coefficient (IACCE3) for auditoria,” Appl. Acoust., 64, 627-641
(2002).
11
J. Xu, J. Nannariello and F. R. Fricke, “Predicting and optimising the airborne sound transmission of floor-ceiling constructions using computational intelligence,” Appl. Acoust., 65, 693-704 (2004).
Table I Ranges of Input Variables
The Range of Input Variables for Predicting the Intelligibility Scores and the
Intelligibility Threshold
The Range of Input Variables for Predicting the Cadence Threshold and the
Audibility Threshold Input Variables Minimum
dB Maximum dB Minimum dB Maximum dB S/N Ratio at 250 Hz -34.8 6.2 -34.8 -8.3 S/N Ratio at 500 Hz -30.2 13.1 -30.2 -2.3 S/N Ratio at 1 kHz -32.7 1.3 -32.7 -15.7 S/N Ratio at 2 kHz -28.2 7.1 -28.2 -1.8 S/N Ratio at 4 kHz -27.4 10.0 -21.8 0.5 S/N Ratio at 8 kHz -23.2 8.7 -16.6 -6.3
T
a
ble II Shift and Scale Factors
to Inputs of Each ANN M o del S/N Ratio at 8 kHz S/N Ratio at 4 kHz S/N Ratio at 2 kHz S/N Ratio at 1 kHz S/N Ratio at 500 Hz S/N Ratio at 250 Hz Input Variables 0.7276 0.7333 0.7990 0.9629 0.6984 0.8478 Shift 0.0314 0.0268 0.0284 0.0295 0.0231 0.0244 Scale ANN Model for Predicting Intelligibility Scores 0.7254 0.7333 0.7990 0.9748 0.6984 0.8561 Shift 0.0316 0.0268 0.0284 0.0298 0.0231 0.0251 Scale ANN Model for Predicting
Intelligibility Threshold 1.6072 0.9791 1.1847 1.9676 1.0840 1.3117 Shift 0.0968 0.0450 0.0421 0.0605 0.0363 0.0377 Scale ANN Model for Predicting Cadence Threshold 1.6063 1.0969 1.0704 1.9299 1.0953 1.3117 Shift 0.0966 0.0503 0.0382 0.0590 0.0362 0.0377 Scale ANN Model for Predicting Audibility
Threshold
T
a
ble III
W
eights and Biases to Hidden Neur
o n s of Each ANN Mode S/N Ratio at 8 kHz S/N Ratio at 4 kHz S/N Ratio at 2 kHz S/N Ratio at 1 kHz S/N Ratio at 500 Hz S/N Ratio at 250 Hz Bias 1.1966 2.0982 8.0602 -0.2854 10.5723 1.1366 11.5184 h1#01 -1.0482 2.0439 1.3246 4.9302 2.7610 1.4757 3.4952 h1#02 -2.9519 -0.0099 1.8921 7.2539 4.5765 0.7391 2.4780 h1#03 ANN Model for
Predicting Intelligibility Scores 1.5709 2.4986 2.1874 3.1024 2.9866 2.3090 4.7585 h1#01 2.3245 0.7054 1.4327 -2.6401 -0.8594 4.7684 -1.0361 h1#02 -0.1919 -0.0970 -1.4269 -9.3399 -4.8108 -0.5849 -3.6038 h1#03 ANN Model for
Predicting Intelligibility Threshold -1.8705 2.5294 1.0129 -1.8440 -0.7203 -0.6167 -1.3096 h1#01 3.6446 -6.9358 -4.0315 -0.1070 -1.2851 -2.5940 -3.4213 h1#02 -0.4777 2.9931 2.1161 0.4341 0.3082 0.9785 0.0453 h1#03 ANN Model for Predicting Cadence Threshold -3.5032 6.7447 4.1976 -1.3097 1.9515 3.0270 1.6085 h1#01 -0.2028 1.3925 1.1180 0.1111 2.4088 4.2765 -0.0568 h1#02 2.2250 -3.6152 -1.7192 1.1948 -1.6567 -1.6642 0.8694 h1#03 ANN Model for Predicting Audibility
Threshold
Table IV Weights and Biases to the Output Neuron of Each ANN Model
ANN Model for Predicting Intelligibility
Scores
ANN Model for Predicting Intelligibility
Threshold
ANN Model for Predicting
Cadence Threshold
ANN Model for Predicting Audibility Threshold Output (Intelligibility Scores) Output (Intelligibility Threshold) Output (Cadence Threshold) Output (Audibility Threshold) Bias 0.0086 -0.6521 -1.5510 -0.9244 h1#01 0.5257 2.2279 -0.0603 2.8098 h1#02 1.5923 -1.8808 -1.2885 -2.7274 h1#03 -1.1333 1.0384 -0.4996 1.1762
T
able
V
S
ta
tistic Data for
ANN Pr ediction Results R2 S.D.f Ratio Error S.D.e RMS Error 0.773 0.477 0.205 0.205 Tra 0.773 0.476 0.208 0.208 Veb 0.774 0.475 0.208 0.208 Tec 0.773 0.476 0.206 0.206 End Predicting Intelligibility Scores 0.921 0.280 0.117 0.116 Tra 0.940 0.246 0.099 0.098 Veb 0.941 0.244 0.105 0.104 Tec 0.929 0.267 0.111 0.111 End Predicting Intelligibility Threshold 0.963 0.192 0.079 0.079 Tra 0.987 0.115 0.049 0.056 Veb 0.982 0.139 0.067 0.072 Tec 0.967 0.183 0.077 0.076 End Predicting Cadence Threshold 0.936 0.254 0.096 0.096 Tra 0.958 0.211 0.088 0.089 Veb 0.992 0.096 0.034 0.033 Tec a Tr = Training Set b Ve = Verification Set c Te = Test Set d En = Entire Set e
Error S.D. = Standard Deviation of the Prediction Error
f
S.D. Ratio = Standard Deviation Ratio
0.942 0.240 0.091 0.091 End Predicting Audibility Threshold 15
FIGURE CAPTIONS