Assessing financial well-being of Merchants by Analyzing
Behavioral Patterns in Historical transactions
by
Kumar Abhinav Srivastava
B.Tech, Computer Science & Engineering, MNNIT, Allahabad, India MBA, Finance & Marketing, NMIMS, Mumbai, India
Submitted to the Faculty in partial fulfillment of the requirements for the degree of
Master of Science in Engineering and Management
at
Massachusetts Institute of Technology
June, 2014
@
2014 Massachusetts Institute of Technology. All Rights Reserved.
Signature redacted
S ig nature of A uthor:...
...
System Design and Management Program May 5, 2014
C e rtified by:
...
Signature redacted
Alex 'Sandy' Pentland
Thesis Supervisor Director, Human Dynamics Lab at MIT Media Lab
C e rtified by:
...
Accepted by:
...
MASSACHUSETTS INSTITUTE OF TECHNOLOGYOCT 2 62016
LIBRARIES
ARCHNES
Signature redacted
Irving Wladawsky-Berger
'in~~cturer The is Supsr
V n _of g s
Signature redacted
~P~ickHale
Chairman & Senior Lecturer, Engineering Systems Division Director, System Design and Management Program
Assessing financial well-being of Merchants by Analyzing Behavioral Patterns in Historical transactions
(This page is intentionally left blank.)
Kumar Abhinav Srivastava MIT SDM Thesis
Assessing financial well-being of Merchants by Analyzing Behavioral Patterns in Historical transactions
Assessing financial well-being of Merchants by Analyzing
Behavioral Patterns in Historical transactions
by
Kumar Abhinav Srivastava
Submitted to the System Design and Management Program on May 5, 2014 in Partial
fulfillment of the Requirements for the Degree of Master of Science in Engineering and
Management.
Abstract
This study focuses on new approach to estimate financial wellbeing indicators for merchants, by
looking at behavioral patterns of their customers in historical transactions. The transaction data
for about 10,000 merchants in a specific country, was analyzed in terms of their diversity and
propensity of customers for factors like age, distance they travel to shop, time of the day, day of
the week, educational status, gender etc. While diversity refers to the variety in the different
groups, propensity refers to concentration of customers in specific groups. These factors were
used as independent variables to predict the financial well-being of merchants, particularly in
two dimensions -total revenue and consistency in revenue, both relative to other merchants in
the same industry. The merchants were also divided into the categories of Essential,
Non-essential and Luxury goods depending on the industry they belong to and it was interesting to
observe the contrast across categories.
While the individual correlations were weak but significant, feature selection and classification
(using logistic regression) indicate that diversity and propensity for factors of 'Age', 'Time of the
day' and 'Day of the week' show reasonable prediction capabilities for total revenue and
consistency in revenue for a merchant, as compared to the industry average.
These kind of inputs can be very useful from a bank's perspective if an existing business customer
of a bank wants to apply for a loan and the bank needs to assess the application. The analysis can
be a good augmentation to the current methods or models of determining the financial
well-being of a merchant. Also, this kind of analysis can bring a fresh perspective to the merchants to
look at the customer base and then to target the right customers for achieving the business
objectives of above average and consistent revenue streams.
Thesis Supervisor(s):
1. Alex 'Sandy' Pentland
Title: Director, Human Dynamics Lab at MIT Media Lab
2. Irving Wladawsky-Berger
Title: Visiting Lecturer in Engineering Systems Division and Sloan School of Management at MIT
Kumar Abhinav Srivastava MIT SDM Thesis
Assessing financial well-being of Merchants by Analyzing Behavioral Patterns in Historical transactions
Acknowledgements
I would like to thank Prof. Alex 'Sandy' Pentland for his guidance and support throughout this study. Not only he helped me to settle on a topic that was interesting and unique but also ensured that I had access to the right people and the right resources at the MIT Media Lab. Data Science
was a completely new field for me and I was able to pace the progress of this research with his
support. I am also indebted to him for his timely and insightful inputs, given the fact that he is such an extremely busy person.
I would like to thank Prof. Irving Wladawsky-Berger, who actually directed me to Prof. Pentland and helped me to narrow down to the research topic. Even though he is not an on campus faculty member, he was always available for invaluable inputs and guidance from time to time.
I would like to thank Patrick Hale, not only for this thesis, but his guidance and support throughout the SDM Program. He is always approachable, offers invaluable advice and willing to
go the extra mile for his students on all kind of matters, not just academic ones.
My work could not have been really complete without the strategic as well as tactical inputs from Mr. Vivek Kumar Singh at MIT Media Lab. He was always available for discussions on ideas, for providing tips on data science tools and guidance in putting everything together in a meaningful form.
I am grateful to Mr. Burcin Bozkaya from Sloan School of Management and Sabanci University, for helping me to put the data analysis in the right context and thus providing meaning to the derived conclusions.
Last but not the least, I am thankful to my Parents, Siblings and Parents-in-law for being the source of inspiration and offering much needed support all along. And most importantly, I am
indebted to my wife Garima for her unconditional support, patience and selflessness without which I could not have even joined this program.
This research was partially sponsored by the Army Research Laboratory under Cooperative
Agreement Number W911NF-09-2-0053.
Kumar Abhinav Srivastava MIT SDM Thesis
Assessing financial well-being of Merchants by Analyzing Behavioral Patterns in Historical transactions
Contents
Chapter 1: Introduction... 6
1.1 Industry Background ... 6
1.2 Related Research...6
1.3 Focus of this study...7
Chapter 2: Data...9
Chapter 3: M ethodology ... 10
3.1 Concepts and approach...10
3.2 Factors and Variables ... 11
3.2.1 Independent Variables... 12
3.2.2 Dependent Variables... 12
Chapter 4: Analysis...14
4.1 Part I: Correlation Analysis ... 14
4.2 Part II: Feature Selection... 20
4.3 Part IlIl: Classification... 21
4.3.1 Phase I - Econom y w ide classification ... 21
4.3.2 Phase 11- Category w ide Classification ... 23
Chapter 5: Conclusion and Future w ork ... 27
APPENDIX A - Details of the buckets ... 28
APPENDIX B - Merchant Industries and their broad level categorization ... 30
References ... 31
Kumar Abhinav Srivastava MIT SDM Thesis
Assessing financial well-being of Merchants by Analyzing Behavioral Patterns in Historical transactions
Chapter 1: Introduction
1.1 Industry Background
Estimating Credit risk is one of the core activities for banks, whether they are lending to individuals or corporations. Different type of credit scoring models are used for the purpose so that the risk estimation process becomes standardized and fair, pricing decisions could
be made and provisions can be made for anticipated losses. Different customers present different kind of risk and return profiles to the bank and the key is to strike the right balance.
Credit scoring for individuals use factors like type of credits used, payment history,
outstanding balance, highest balance drawn on the account etc. It may also use publicly
available information such as liens, bankruptcy, criminal record etc. The credit score for a company in Small and Medium Enterprise category would use a different set of inputs like Total Sales, Debt Equity Ratio, Average Bank account balance, Type of collateral, industry specific risk and dependencies on Suppliers etc. (Division of Supervision and Consumer Protection, 2007)
The credit scoring models have been in the process of constant evolution. Starting with a checklist of health indictors, they now incorporate prediction of consumer behavior, probability of default and likelihood of account attrition. Institutions now even combine
the results of different type of credit scoring models before they arrive at a decision. (Risk
Rating and Credit Scoring for SMEs, 2012)
1.2 Related Research
There has been a lot of research in estimation of Credit risk using machine learning and artificial intelligence. Credit rating analysis was initially done using statistical methods.
Later, modelling using Artificial Intelligence showed better results over time. One of the research paper, 'Credit rating analysis with support vector machines and neural networks' (Huang Z., Chen, Hsu, Chen, & Wu, 2003) was focused on comparing explanatory power of
Kumar Abhinav Srivastava MIT SDM Thesis
Assessing financial well-being of Merchants by Analyzing Behavioral Patterns in Historical transactions
Back-propagation Neural Network (BNN) and Support Vector Machines (SVM) using the data from US and Taiwan markets. It suggested that SVM gives comparable if not better results than BNN.
Another study 'Credit scoring with a data mining approach based on support vector machines' (Huang, Chen, & Wang, 2007) showed that SVM model for Credit Card scoring can achieve similar results as neural networks, genetic programming, and decision tree
classifiers while using lesser number of inputs. Comparison of performance with multiple
algorithms like Back Propagation, Extreme Learning Machine, Incremental Extreme Learning Machine and Support Vector Machine, was the focus of the research work 'Comparing the learning effectiveness of BP, ELM, I-ELM, and SVM for corporate credit ratings.' (Zhong, Miao, Shen, & Feng, 2013).
Most of these works have used financial analysis as an approach for Credit Risk Estimation. Recent works have tried to establish social behavior of people with their financial status. A research work on 'Network Diversity and Economic Development' (Eagle, Macy, & Claxton,
2010) attempts to link between diversity in social networks of people and access to
socioeconomic opportunity. It finds that the diversity of individuals' relationships is
strongly correlated with the economic development of communities. Another similar
study, 'Predicting Spending Behavior using Socio-Mobile Features' (Singh, Freeman, Lepri, & Pentland, 2013) at the MIT Media Lab, attempts to predict the spending behavior of
people using inputs from their social behavior. The input factors were face-to-face interaction, call and SMS logs. The predicted behavior included propensity to explore diverse businesses, loyalty and overspending.
1.3 Focus of this study
While these studies have linked the social behavior of people to their economic well-being or financial behavior, we have attempted to look at a similar problem but in a different context. In this study, we try to establish the link between the economic wellbeing of merchants and the behavioral patterns of their customers. If a bank has to extend credit to
Kumar Abhinav Srivastava MIT SDM Thesis
Assessing financial well-being of Merchants by Analyzing Behavioral Patterns in Historical transactions
a merchant, can it make some conclusions from the historical transactions for that merchants? What kind of customer behavior patterns or factors in historical data could be important? And would these patterns be consistent for all kind of merchants or does it
differ from category to category? We tried to answer some of these questions. The
outcome of this study does not intend to replace any existing credit scoring methods but to augment them with a new perspective.
We had over 5 million records of credit card transaction data for about 10,000 merchants in a specific country. We tried to profile the customers of the different merchants in terms of their diversity and propensity in specific factors like age, distance they travel to shop, time of the day, day of the week, educational status, gender etc. While diversity refers to the variety in the different groups, propensity refers to concentration of customers in specific groups. We have used these factors as independent variables to predict the financial well-being of merchants. Specifically, we have measured financial well-being of a merchant by two factors - total revenue and consistency in revenue, both relative to other merchants in the same industry. While the individual correlations were weak but significant, feature selection and classification indicate that diversity and propensity for factors of Age, Time of the day and day of the week show reasonable prediction capabilities.
Kumar Abhinav Srivastava
MIT SDM Thesis
Assessing financial well-being of Merchants by Analyzing Behavioral Patterns in Historical transactions
Chapter 2: Data
The credit card transaction data for 3 months was received from a country outside US. With the initial consideration set of over 5 million transactions for about 10000 merchants, required preprocessing steps were undertaken to eliminate extreme, missing or confusing values. The merchants with very high number of transactions as well as the ones with very low number of transactions, were removed from the consideration set. This reduced the consideration set to about 3 million transactions and nearly 8500 merchants. The merchants were also divided into the categories of Essential, Non-essential and Luxury goods depending on the industry they belong to. Social and economic background of the specific country was kept in mind while doing so.
The entire transaction data set belonged to a period of three months. Rather than choosing a specific month(s) for training and others for validation during classification, the cross validation features of the software 'Weka' were employed to ensure that there is no bias.
To be specific, 10 fold cross validation was used.
The specific factors considered were time of the day, day of the week, week of the month, distance travelled by the customer, educational status, gender, transaction amount, loyal
customers. Loyal customers were defined as the ones with 3 or more transactions with the
same merchant in the given period of time.
Kumar Abhinav Srivastava MIT SDM Thesis
Assessing financial well-being of Merchants by Analyzing Behavioral Patterns in Historical transactions
Chapter 3: Methodology
3.1 Concepts and approach
The analysis in this study comprised of three stages:
1. Correlation analysis conducted between the independent and dependent variables
using Pearson's correlation co-efficient. Only the results with p-value less than 0.05
were considered. The direction of causality is unknown in general but some generic arguments can be made.
2. Feature Selection to determine which factors are the most important ones and to validate the results obtained by Correlation analysis.
3. Classification using classifiers/algorithms like ZeroR, Logistic Regression and Bagging to predict the independent variables using the dependent variables. The exercise was done first using all the factors and subsequently using reduced set of factors, as
suggested by Feature Selection.
A brief description of these concepts is as follows:
1. Pearson coefficient of correlation
Pearson Coefficient measures of linear relation between two variables in interval or
ratio scales with the sign of the coefficient reflecting the direction of the relationship.
The value of this coefficient varies from -1 to +1 and values closer to zero in each
direction indicate weaker relationships. This was used as the first level of test to determine whether the variables are related and if yes, then how strongly.
2. Feature Selection
Feature Selection refers to the process of selecting a subset of most relevant features before a data model is built. Two type of features need to be discarded. First is the set
of features which are not relevant at all. Second is the set which may be relevant but
do not provide additional information once a subset of features has been selected. We
Kumar Abhinav Srivastava MIT SDM Thesis
Assessing financial well-being of Merchants by Analyzing Behavioral Patterns in Historical transactions
can build a highly complicated data model for classification purpose, but when we actually use this model in real world, all the numerous data inputs need to be collected for making every prediction. Therefore, the strength of the model lies in being maximum accurate with minimum number of inputs.
3. Classification using ZeroR, Logistic Regression and Bagging.
Classification refers to assigning a new category to new observation, based on the knowledge of category membership of previous observations. There are different algorithms known as Classifiers to implement the classification process. Different type of classifiers used in this study were: ZeroR, Logistic Regression and Bagging.
" ZeroR is one of the lazy learning algorithms that predict class labels without building
an explicit model or rules. Lazy learning refers to learning method where
generalization is not made before an observation is put forth for classification.
" Logistic Regression is probabilistic statistical classifier which predicts binary
response to define the category of a new observation, based on features of previous observations. Its use was apt in this case, since we were trying to determine whether the total revenue and consistency in revenue for merchants is above or below the industry average.
" Bagging is one of the ensemble learning algorithms that combine decisions from different models to reduce errors. It takes the vote from different models, which could be for instance decision trees, and gives them equal weightage in deciding the final outcome.
3.2 Factors and Variables
The specific factors considered were time of the day, day of the week, week of the month, distance travelled by the customer, educational status, gender, transaction amount, loyal
customers. For these different factors, different buckets were formed in such a way so that
Kumar Abhinav Srivastava MIT SDM Thesis
Assessing financial well-being of Merchants by Analyzing Behavioral Patterns in Historical transactions
data is well distributed amongst the buckets. Exact details of these buckets has been
provided in Appendix A.
3.2.1 Independent Variables
The following variables explain how well distributed or concentrated are the customers
over the different categories for a single factor.
A. Diversity - Diversity was defined by the Shannon's entropy formula normalized by the number of non-empty buckets, to calculate the diversity for each merchant. The formula gives values between 0 and 1. The more even is distribution amongst different buckets, the closer will be the value to 1. This definition of diversity has been commonly accepted and used in similar studies.
B. Propensity - For different factors mentioned above, Propensity was defined as the ratio of number of transactions in the top buckets to the total number of transactions for each merchant. The same buckets as defined for diversity calculations were used for
this purpose.
Using different combinations of the mentioned factors with these two criteria, 15 different independent variables were considered.
3.2.2 Dependent Variables
From a credit risk perspective, the financial well-being of a business would be largely defined by its ability to repay the loan. Clearly, a business has to make profits to do the same. But over a larger period of time, if there are two businesses making the same amount of profit in a year - one doing it over the entire year and the other in let us say three months. Both these businesses would have different risk profiles. Along with the profit, a consistent or steady stream of revenue is also important. The following two variables attempt to capture this idea.
Kumar Abhinav Srivastava
MIT SDM Thesis
Assessing financial well-being of Merchants by Analyzing Behavioral Patterns in Historical transactions
A. Normalized Total Revenue
For each merchant, the total revenue was compared with the mean total revenue of merchants belonging to that specific industry sector, for the given period of time. If the merchant's revenue was greater than or equal to the industry mean, it was categorized as "Above" otherwise it was categorized as "Below".
B. Stability in Revenue
The weekly revenue for each merchant for the given time period was taken and its Mean and SD (Standard Deviation) was calculated over the period. Then the CV (co-efficient of variation) was calculated for each merchant. The range of CV values for merchants in each specific industry were considered and the median value was taken as the benchmark for each industry. Merchants with CV values less than or equal to the industry mean were categorized as 'Stable' and those with CV greater than the mean were categorized as 'Unstable'. The caveat here could be that three months is a short period of time to ascertain
the stability in revenue and in an ideal scenario, at least the data for a period of one year should be considered to figure out seasonality of a business.
Kumar Abhinav Srivastava MIT SDM Thesis
Assessing financial well-being of Merchants by Analyzing Behavioral Patterns in Historical transactions
Chapter 4: Analysis
4.1 Part
1:
Correlation Analysis
A. Normalized Total Revenue
All the correlations observed, whether positive or negative, were significant but not strong
individually.
i. Time of the day
Diversity in time has a significant positive correlation with total revenue. This Diversity
refers to how customers come to a merchant during different hours of the day.
Propensity in Time has significant negative correlation with total revenue. The Propensity
here refers to fraction of transactions by customers during peak hours to the total number
of transactions for the merchant.
These two factors taken together would mean that higher total revenue of a merchant and
customer base active during varied hours of the day seem to be associated.
The correlation in both cases the strongest for the Non-essential category and industries of
particular interest in Non-essential category are Fuel (Oil) and Accommodation where
customers are likely to be more active round the clock. The correlations were the weakest
for the Essential category.
ii. Age Groups
Diversity in age has a significant positive correlation with total revenue. This Diversity refers
to how customers belonging to different age groups come to a merchant.
Propensity in Age group has significant negative correlation with total revenue. The
Propensity here refers to the fraction of transactions by customers belonging to most
common age group to the total number of transactions for the merchant.
Kumar Abhinav Srivastava MIT SDM Thesis
Assessing financial well-being of Merchants by Analyzing Behavioral Patterns in Historical transactions
These two factors taken together would mean that higher total revenue of a merchant and a customer base consisting of diverse age groups seem to be associated.
The correlation is the strongest in the Non-essential category and the weakest in Essential category in both cases.
iii. Distance
Diversity in Distance has a significant positive correlation with total revenue. The Diversity here refers to different distances, customers travel to reach the merchant.
Propensity in Distance has significant negative correlation with total revenue. The Propensity here refers to the fraction of transactions by customers who come from the most common distance ranges to the total number of transactions for the merchant. These two factors taken together would mean that higher total revenue of a merchant and a customer base consisting of people coming from varying distances seem to be associated.
The trend does not show any significant difference across categories.
iv. Day of the week
Diversity in day of the week has a significant positive correlation with total revenue. The
Diversity here refers to different days of the week when customers come to the merchant.
Propensity in day of the week, shows significant negative correlation with total revenue.
The Propensity here refers to the fraction of transactions during the busiest days of the week for the merchant to the total number of transactions for the merchant.
These two factors taken together would mean that higher total revenue of a merchant and a customer base active on all days of the week seem to be associated.
The trend is strongest for the Non-essential category and weakest for the essential category.
v. Educational Status
Kumar Abhinav Srivastava MIT SDM Thesis
Assessing financial well-being of Merchants by Analyzing Behavioral Patterns in Historical transactions
Diversity in Educational status has significant positive correlation with total revenue. The Diversity here refers to the different educational status of the customers for a merchant. The Propensity in Education status had significant negative correlation with the total revenue. The Propensity here refers to the fraction of the number of transactions by customers belonging to most common educational status, to the total number of
transactions for the merchant.
These two factors taken together would mean that higher total revenue of a merchant and a customer base with varied educational backgrounds seem to be associated.
The trend was strongest for the Non-essential category while there was no significant trend for essential category in this case.
vi. Gender
The Gender Diversity had significant correlation to total revenue only in the case of non-essential category. The data set in particular did not have a very good distribution of gender
and possibly these results could vary across geographies.
vii. Transaction amounts
The diversity in the range of transaction amounts had no significant correlation with total
revenue in general or in any specific category.
viii. Transactions by Loyal Customers
The fraction of transactions by loyal customers to the total number of transactions for a
merchant had significant positive correlation with the total revenue, particularly in the non-essential category. This would mean that higher total revenue of a merchant and majority of transactions done by loyal customers seem to be associated, particularly in the non-essential category of merchants.
B. Stability in Revenue
Kumar Abhinav Srivastava MIT SDM Thesis
Assessing financial well-being of Merchants by Analyzing Behavioral Patterns in Historical transactions
Here, the lower the value of CV was, the more stable was the revenue of the merchant. Therefore, positive correlation has negative connotation and vice versa.
i. Time of the day
Diversity in time of the day has a significant positive correlation with consistency in weekly revenue. Propensity in Time of the day has significant negative correlation with stability in revenue. These two factors taken together would mean that stability in revenue of a merchant and a customer base active during specific hours of the day seem to be associated.
The correlation in both cases is the strongest for the Luxury category and it doesn't exist for the Non-Essential category. Industries of particular interest in the Luxury category are Electrical and Electronic equipment, Jewelry and Entertainment parks which are unlikely to be operating round the clock.
ii. Age Groups
Diversity in age has a significant positive correlation with consistency in weekly revenue.
Propensity in Age group has significant negative correlation with stability in weekly
revenue, only in the case of merchants in Luxury Category.
These two factors taken together would mean that stability in revenue of a merchant and
a customer base belonging to specific age groups seem to be associated, particularly in
Luxury Category. iii. Distance
Diversity in Distance has a significant positive correlation with stability in weekly revenue, only for merchants in Luxury category. Propensity in Distance has significant positive correlation with stability in weekly revenue, only for merchants in essential category. These two factors taken together are not conclusive and this indicates that the distance travelled
Kumar Abhinav Srivastava MIT SDM Thesis
Assessing financial well-being of Merchants by Analyzing Behavioral Patterns in Historical transactions
by customers to reach a merchant does not seem to be associated with the stability in
revenue of the merchant.
iv. Day of the week
Diversity in day of the week has a significant positive correlation with stability in weekly
revenue, particularly strong in the case of merchants in Luxury category. Propensity in day of the week, shows significant negative correlation with stability in weekly revenue, only in the case of merchants in Luxury category.
These two factors taken together would mean that stability in revenue of a merchant and a customer base active during specific days of the week seem to be associated, particularly in Luxury Category. This would make sense in general because a lot of spending in
Entertainment parks, Jewelry shops etc. happens in the weekends rather than weekdays.
v. Educational Status
Diversity in Educational status has significant positive correlation with stability in weekly
revenue only in the case of merchants in Luxury category. The Propensity in Education
status had significant negative correlation with stability in weekly revenue, particularly strong in the case of merchants in Luxury Category.
These two factors taken together would mean that stability in revenue of a merchant in
Luxury Category and a customer base belonging to specific educational backgrounds seem
to be associated. vi. Gender
The Gender diversity did not exhibit significant correlation to stability in weekly revenue for merchants in general or in any specific category. To reiterate, the distribution was not good in the data set and this could differ for a different dataset or a different geography.
vii. Transaction amounts
Kumar Abhinav Srivastava MIT SDM Thesis
Assessing financial well-being of Merchants by Analyzing Behavioral Patterns in Historical transactions
The diversity in the range of transaction amounts had significant correlation with stability in weekly revenue, only in the Luxury category. This would mean that stability in revenue of a merchant and transaction amounts of the same range seem to be associated,
particularly in Luxury Category.
viii. Transactions by Loyal Customers
The fraction of transactions by loyal customers to the total number of transactions for a merchant had significant negative correlation with the stability in weekly revenue, particularly in the non-essential category.
This would mean that stability in revenue of a merchant and a loyal customer base doing most of the transactions seem to be associated, particularly in non-essential Category. Different factors and the significant correlations between
the following table.
them have been summarized in
Total Total
RStability
Revenue Diversity-Time + + Propensity-Time - -Diversity-Age + + Propensity-Age - -Diversity-Distance + Propensity-Distance -Diversity-Day + + Propensity-Day -Diversity-Education + Propensity-Education - -Diversity-Gender Propensity-Gender Diversity-Amount Propensity-AmountFig 1: Summary of attributes and their correlations with Normalized Total Revenue and Stability
Kumar Abhinav Srivastava MIT SDM Thesis
Assessing financial well-being of Merchants by Analyzing Behavioral Patterns in Historical transactions
4.2 Part II: Feature Selection
Once the correlation was found for all the attributes, it became clear that not all of them were required for building a prediction model. There was a clear trend for certain factors and that was further verified using Feature selection. This was done for both dependent variables separately.
Rank Weight Attribute
1 0.1084 Loyalty-Time 2 0.0919 Loyalty-Age 3 0.087 Div-Time 4 0.0845 Loyalty-WkDay 5 0.0795 Div-Age 6 0.0738 Loyalty-Dist 7 0.0706 Div-Wkday 8 0.0665 Div-Week 9 0.0628 Loyalty-Cust 10 0.0626 Loyalty-Txns 11 0.0574 Div-TxnAmt 12 0.0565 Loyalty-Edu 13 0.0558 Div-Dist 14 0.0456 Div-Edu 15 0.0285 Div-Gender
Fig 2: Attribute Ranking for Normalized Revenue
Rank Weight Attribute
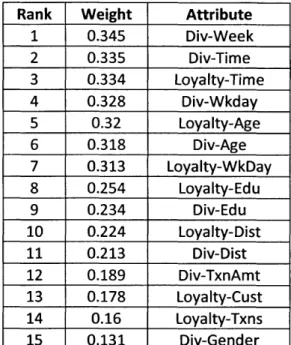
1 0.345 Div-Week 2 0.335 Div-Time 3 0.334 Loyalty-Time 4 0.328 Div-Wkday 5 0.32 Loyalty-Age 6 0.318 Div-Age 7 0.313 Loyalty-WkDay 8 0.254 Loyalty-Edu 9 0.234 Div-Edu 10 0.224 Loyalty-Dist 11 0.213 Div-Dist 12 0.189 Div-TxnAmt 13 0.178 Loyalty-Cust 14 0.16 Loyalty-Txns 15 0.131 Div-Gender
Fig 3: Attribute Ranking for Stability in Revenue
Looking at these rankings, it became evident that Age, Time of the day and Day of the Week
were important for both variables. During further analysis, the results with the complete
set of variables and with reduced set of variables have been compared.
Kumar Abhinav Srivastava
MIT SDM Thesis
Assessing financial well-being of Merchants by Analyzing Behavioral Patterns in Historical transactions
4.3 Part Ill: Classification
1. All the 15 parameters were used initially for classification.
2. Later the dependent variable set was reduced to 6 parameters that represented Diversity and Propensity in Age, Time of the day and Day of the week as key factors. 3. The classifiers/algorithms used were ZeroR, Logistic Regression and Bagging (with
REPTree classifier in Weka)
4. 10-fold cross validation was used in each case to alleviate the overfitting problem.
4.3.1 Phase I - Economy wide classification
At this point of analysis, all the merchants belonging to different industries were treated alike and the entire data set except the outliers, was used for the classification exercise. A. Normalized Total Revenue
Using all parameters: The baseline calculation using ZeroR classifier provided correctly classified instances percentage of 87.63 with the F-measure being 0.818. Logistic regression
provided correctly classified instances percentage of 90.38 with F-measure improving to 0.893. The best result was provided by Bagging with correctly classified percentage of 91.22 and F-measure 0.912.
Using reduced set of parameters: The best performance in this case was correctly classified
instances percentage of 89.61 with F-measure of 0.878 obtained by Bagging.
B. Stability in Revenue
Using all parameters: The baseline calculation using ZeroR classifier provided correctly
classified instances percentage of 50.59 with the F-measure being 0.34. Bagging show drastic improvement provided correctly classified instances percentage of 81.19 with
F-Kumar Abhinav Srivastava MIT SDM Thesis
Assessing financial well-being of Merchants by Analyzing Behavioral Patterns in Historical transactions
measure improving to 0.812. The best result was provided by Logistic regression with correctly classified percentage of 81.89 and F-measure equal to 0.818.
Using reduced set of parameters: The best performance in this case was correctly classified
instances percentage of 79.87 with F-measure of 0.798, obtained by Logistic Regression.
The overall results with reduced set of parameters with coefficients for logistic regression, accuracy (correctly classified instances) and F-measure are listed as follows:
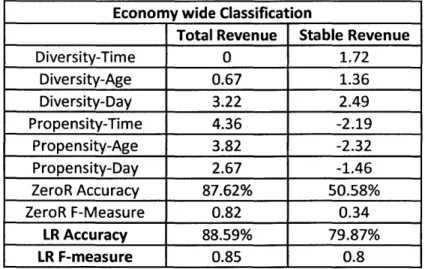
Economy wide Classification
Total Revenue Stable Revenue
Diversity-Time 0 1.72 Diversity-Age 0.67 1.36 Diversity-Day 3.22 2.49 Propensity-Time 4.36 -2.19 Propensity-Age 3.82 -2.32 Propensity-Day 2.67 -1.46 ZeroR Accuracy 87.62% 50.58% ZeroR F-Measure 0.82 0.34 LR Accuracy 88.59% 79.87% LR F-measure 0.85 0.8
Fig 4: Attributes with Logistic Regression Coefficients for Economy wide Classification
Majority of the values for Normalized Total Revenue (>95%) and for Stability in Revenue (>80%) are in the range of -1 to 1.
From these results, it appears that Propensity in time and Age i.e. customers coming at a specific time of the day and belonging to a specific age group are associated with high revenue for a merchant.
However, stability in revenue is associated with more diversity and less propensity for each
factor of age, time and day.
Kumar Abhinav Srivastava MIT SDM Thesis
Assessing financial well-being of Merchants by Analyzing Behavioral Patterns in Historical transactions
4.3.2 Phase 11- Category wide Classification
To further investigate the contrasts across the different merchant categories, we conducted classification test for each different categories separately. Different industry sectors and their category has been detailed in Appendix B. This time, we used the reduced set of variables only as they had shown significant prediction capabilities in the experiments for all categories taken together. The variables used were:
1. Diversity in Time of the day
2. Diversity in Age group of customers 3. Diversity in day of the week
4. Propensity in Time of the day
5. Propensity in Age group of customers 6. Propensity in Day of the week
We used Logistic Regression in this case and figured out the coefficients for each of the independent variables used.
A. Normalized Total Revenue
The classification exercise was conducted for Normalized Total Revenue in each category
separately, using the reduced set of variables. The results have been collated in the table below in terms of coefficients for each parameter, overall accuracy (correctly classified instances) and F-measure in logistic regression. Majority of the values for Normalized Total Revenue are in the range of -1 to 1, varying from 95% to 97% of the total, across different categories.
Kumar Abhinav Srivastava
MIT SDM Thesis
Assessing financial well-being of Merchants by Analyzing Behavioral Patterns in Historical transactions
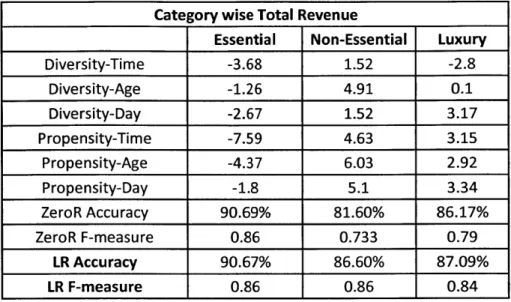
Category wise Total Revenue
Essential Non-Essential Luxury
Diversity-Time -3.68 1.52 -2.8 Diversity-Age -1.26 4.91 0.1 Diversity-Day -2.67 1.52 3.17 Propensity-Time -7.59 4.63 3.15 Propensity-Age -4.37 6.03 2.92 Propensity-Day -1.8 5.1 3.34 ZeroR Accuracy 90.69% 81.60% 86.17% ZeroR F-measure 0.86 0.733 0.79 LR Accuracy 90.67% 86.60% 87.09% LR F-measure 0.86 0.86 0.84
Fig 5: Variables with Logistic Regression Coefficients Category wise Total Revenue
In Essential Category, Propensity in time seems to be the most important factor (negative) whereas Propensity in Age seems to be the most important factor for Non-essential category. This would indicate that customers coming at a specific time of the day is not a
good sign for overall revenue of merchants in the essential category. For merchants in nonessential category, customers belonging to a specific age group is good indicator of high
overall revenue.
Luxury category does not show one factor to be significantly stronger than all other but overall, looking at the diversity and propensity in time, it seems the higher revenue in luxury segment is associated with most customers coming at a specific time of the day.
B. Stability in Revenue
The classification exercise for Stability in Revenue was conducted in each category separately, using the reduced set of variables. The results have been collated in the table below in terms of coefficients for each parameter, overall accuracy (correctly classified instances) and F-measure in logistic regression. Majority of the values for Stability in
Kumar Abhinav Srivastava MIT SDM Thesis
Assessing financial well-being of Merchants by Analyzing Behavioral Patterns in Historical transactions
Revenue are in the range of -1 to 1, varying from 75% to 85% of the total, across different categories.
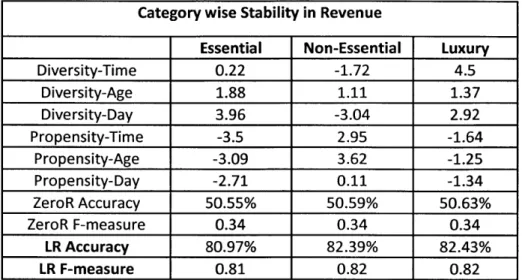
Category wise Stability in Revenue
Essential Non-Essential Luxury
Diversity-Time 0.22 -1.72 4.5 Diversity-Age 1.88 1.11 1.37 Diversity-Day 3.96 -3.04 2.92 Propensity-Time -3.5 2.95 -1.64 Propensity-Age -3.09 3.62 -1.25 Propensity-Day -2.71 0.11 -1.34 ZeroR Accuracy 50.55% 50.59% 50.63% ZeroR F-measure 0.34 0.34 0.34 LR Accuracy 80.97% 82.39% 82.43% LR F-measure 0.81 0.82 0.82
Fig 6: Variables with Logistic Regression Coefficients for Category wise Stability in Revenue
None of the factors along emerges strongly against others for the essential category here.
However, looking at the coefficients for Diversity and Propensity in Day of the week, it
appears the revenue stability in this category is associated with customers coming at different days of the week for a merchant.
In case of Non-essential category, while no factor is significantly most important, looking
at the coefficients for diversity and propensity in Time of the day, it appears that revenue stability in this category is associated with customers coming at a specific time of the day for the merchant.
In case of Luxury category, Diversity in time seems to be the most important factor and it is further reinforced by negative coefficient for Propensity in time. This would mean that
Kumar Abhinav Srivastava
MIT SDM Thesis
Assessing financial well-being of Merchants by Analyzing Behavioral Patterns in Historical transactions
customers coming at different times of the day are associated with revenue stability for merchants in the Luxury Category.
Kumar Abhinav Srivastava MIT SDM Thesis
Assessing financial well-being of Merchants by Analyzing Behavioral Patterns in Historical transactions
Chapter 5: Conclusion and Future work
The factors of Age, Time of the day and Week of the day showed significant prediction capabilities for normalized total revenue and stability in revenue for merchants as compared to their respective industry averages. In general, propensity in age and time was associated with higher revenue whereas diversity in each factor was good for stability in revenue.
In specific categories, the luxury category has high revenue if the customers come during specific time of the day and more stable revenue if the customers come during varied hours of the day. For nonessential category, customers coming during specific hours of the day are associated with stable revenue and this is in contrast with luxury category. For essential category, stability in revenue for merchants is associated with customers coming to them
on different days of the week.
From a Bank's perspective for estimation of credit risk, the approach can be a good augmentation to the current methods of determining the financial well-being of a merchant. It adds a unique perspective and would make the model more comprehensive. From a merchant's point of view, these inputs are useful to focus the business towards his
or her specific objective and target the right audience accordingly, whether it is deciding
business hours, deciding business days or deciding on audience based on age for running a
marketing campaign.
The focus in this study was to determine the financial well-being of a merchant using some of the most important behavioral profile features of its customers at an economy wide level and then to a category wide level. The classification exercise can be narrowed down to an industry level and it can be observed where the accuracy of the prediction improves or deteriorates. Another direction to explore could be to figure out if there is a variation across merchants of different scale within the same broad level category.
Kumar Abhinav Srivastava
MIT SDM Thesis
Assessing financial well-being of Merchants by Analyzing Behavioral Patterns in Historical transactions
APPENDIX A - Details of the buckets
1) WeekWeek 1 to Week 14 in the three month data
2) Day of the week
Monday to Sunday 3) Age Group i. 0-25 ii. 25-30 iii. 30-35 iv. 35-40 v. 40-45 vi. 45-50 vii. 50-55 viii. 55-60 ix. 60+ 4) Distance i. < 2 Miles ii. 2-5 Miles iii. 5-10 Miles iv. 10-25 Miles V. 25-50 Miles vi. 50-100 Miles vii. 100-250 Miles viii. 250-500 Miles ix. 500+ Miles 5) Transaction Amount i. < 10 ii. 10-25 iii. 25-50 iv. 50-100
Kumar Abhinav Srivastava MIT SDM Thesis
Assessing financial well-being of Merchants by Analyzing Behavioral Patterns in Historical transactions
v. 100-200
vi. 200-500 vii. 500+
6) Time of the day i. 0-3 AM ii. 3-6 AM iii. 6-9 AM iv. 9AM -12PM v. 12-3 PM vi. 3-6 PM vii. 6-9 PM viii. 9PM-12AM 7) Education i. Uneducated
ii. Secondary School iii. High School iv. Graduate
v. University
vi. Unknown
vii. Ph.D.
viii. Elementary School ix. College
Kumar Abhinav Srivastava MIT SDM Thesis
Assessing financial well-being of Merchants by Analyzing Behavioral Patterns in Historical transactions
APPENDIX B - Merchant Industries and their broad level
categorization
Kumar Abhinav Srivastava MIT SDM Thesis
30
Grocery/store Clothing
Food and cooking Essentials
Health
Accommodation Books Stationery Auto and fuel oil
Education Non-essentials
Insurance
Entertainment districts, and social
Building decoration
Travel transportation
Electronics & Phone Luxury
Jeweler
Places serving Alcohol
Assessing financial well-being of Merchants by Analyzing Behavioral Patterns in Historical transactions
References
Altman, E. I., & Sabato, G. (December 26, 2005). Modeling Credit Riskfor SMEs: Evidencefrom the
US Market.
Division of Supervision and Consumer Protection. (2007, March). Scoring and Modeling. Retrieved April 22, 2014, from Federal Deposit Insurance Corporation:
http://www.fdic.gov/regulations/examinations/credit-card/pdf-version/ch8.pdf Eagle, N., Macy, M., & Claxton, R. (2010). Network Diversity and Economic Development.
www.sciencemag.org.
Huang, C.-L., Chen, M.-C., & Wang, C.-J. (2007). Credit scoring with a data mining approach based
on support vector machines. Elsevier.
Huang, Z., Chen, H., Hsu, C.-J., Chen, W.-H., & Wu, S. (2003). Credit rating analysis with support
vector machines and neural networks: a market comparative study. Elsevier.
Risk Rating and Credit Scoring for SMEs. (2012, March 27). Retrieved from European Bank for
Reconstruction and Development: http://www.ebrd.com/downloads/news/2_rr.pdf Singh, V. K., Freeman, L., Lepri, B., & Pentland, A. (. (2013). Predicting Spending Behavior using
Socio-Mobile Features.
Zhong, H., Miao, C., Shen, Z., & Feng, Y. (2013). Comparing the learning effectiveness of BP, ELM,
I-ELM and SVMfor corporate credit ratings. Elsevier.
Kumar Abhinav Srivastava MIT SDM Thesis