Publisher’s version / Version de l'éditeur:
Journal of Architectural Engineering, 14, September 3, pp. 65-75, 2008-09-01
READ THESE TERMS AND CONDITIONS CAREFULLY BEFORE USING THIS WEBSITE. https://nrc-publications.canada.ca/eng/copyright
Vous avez des questions? Nous pouvons vous aider. Pour communiquer directement avec un auteur, consultez la
première page de la revue dans laquelle son article a été publié afin de trouver ses coordonnées. Si vous n’arrivez pas à les repérer, communiquez avec nous à [email protected].
Questions? Contact the NRC Publications Archive team at
[email protected]. If you wish to email the authors directly, please see the first page of the publication for their contact information.
NRC Publications Archive
Archives des publications du CNRC
This publication could be one of several versions: author’s original, accepted manuscript or the publisher’s version. / La version de cette publication peut être l’une des suivantes : la version prépublication de l’auteur, la version acceptée du manuscrit ou la version de l’éditeur.
For the publisher’s version, please access the DOI link below./ Pour consulter la version de l’éditeur, utilisez le lien DOI ci-dessous.
https://doi.org/10.1061/(ASCE)1076-0431(2008)14:3(65)
Access and use of this website and the material on it are subject to the Terms and Conditions set forth at
Optimizing the wind uplift resistance of mechanically attached roof systems
Baskaran, B. A.; Ko, S. K. P.
https://publications-cnrc.canada.ca/fra/droits
L’accès à ce site Web et l’utilisation de son contenu sont assujettis aux conditions présentées dans le site LISEZ CES CONDITIONS ATTENTIVEMENT AVANT D’UTILISER CE SITE WEB.
NRC Publications Record / Notice d'Archives des publications de CNRC: https://nrc-publications.canada.ca/eng/view/object/?id=cfa55254-d8c9-4abf-8693-398bdc32cefb https://publications-cnrc.canada.ca/fra/voir/objet/?id=cfa55254-d8c9-4abf-8693-398bdc32cefb
http://irc.nrc-cnrc.gc.ca
O p t i m i z i n g t h e w i n d u p l i f t r e s i s t a n c e o f
m e c h a n i c a l l y a t t a c h e d r o o f s y s t e m s
N R C C - 4 8 6 7 5
B a s k a r a n , B . A . ; K o , S . K . P .2 0 0 8 - 1 0 - 1 7
A version of this document is published in / Une version de ce document se trouve dans: Journal of Architectural Engineering, v. 14, no. 3, .pp 65-75
The material in this document is covered by the provisions of the Copyright Act, by Canadian laws, policies, regulations and international agreements. Such provisions serve to identify the information source and, in specific instances, to prohibit reproduction of materials without written permission. For more information visit http://laws.justice.gc.ca/en/showtdm/cs/C-42
Les renseignements dans ce document sont protégés par la Loi sur le droit d'auteur, par les lois, les politiques et les règlements du Canada et des accords internationaux. Ces dispositions permettent d'identifier la source de l'information et, dans certains cas, d'interdire la copie de documents sans permission écrite. Pour obtenir de plus amples renseignements : http://lois.justice.gc.ca/fr/showtdm/cs/C-42
OPTIMIZING THE WIND UPLIFT RESISTANCE OF
MECHANICALLY ATTACHED ROOF SYSTEMS
1Bas A. Baskaran Ph.D, P.Eng1*, Steven Kee Ping Ko, M.Eng2 1
Senior Research Officer, 2 Technical Officer,
National Research Council, 1200 Montreal Road, Ottawa, ON, Canada, K1A OR6
ABSTRACT
Wind dynamics on a mechanically attached single-ply roofing assembly can lift the membrane and cause fluttering, introducing stresses at the attachment locations. To identify a component in a system that has the weakest resistance against wind uplift forces, a dynamic evaluation method is beneficial. Over the past ten years, a number of mechanically attached systems were constructed and exposed to simulated dynamic wind uplift forces using the Dynamic Roofing Facility at the National Research Council of Canada. This paper presents data from this on going investigation that will help system designers to maximize wind uplift ratings by choosing the appropriate roof components at the early design stage or by replacing/adding components during reroofing to improve uplift resistance. By diagnosing roof system failures, one can identify the weakest link and select design alternatives that can improve the wind resistance. Through a case study, this paper concludes with a procedure for system optimization.
Key words
Wind uplift, dynamic testing, resistance, roofs, optimization, barrier, seaming, fasteners.
1 An abstract version of this paper was presented at the 21st Annual Convention of the Roof Consultants Institute, Phoenix, AZ, March 2006.
INTRODUCTION
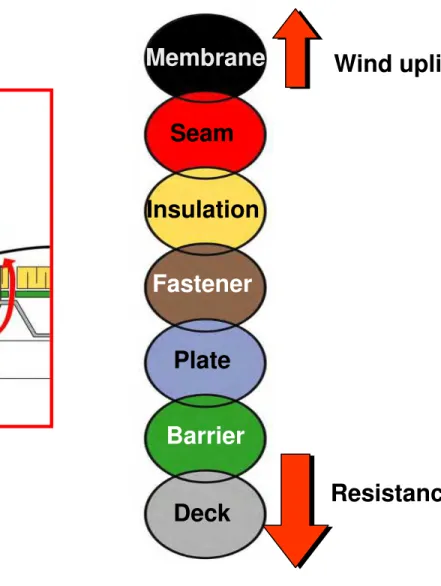
More than 50% of North American low-slope roofs employ single-ply assemblies (Good, 2004). A mechanically attached system (MAS) is one in which the waterproofing single-ply sheets are integrated with the other components using fasteners. This is becoming a popular installation method because it is more economical than other methods. Wind effects on MAS are shown in Figure 1. Wind dynamics cause membrane elongation and billowing. The magnitude of the wind-induced suction and the membrane’s elastic property determine the billowing shape and fluttering magnitude. Typical components of MAS are: deck, fastener, plate, barrier (retarder), insulation, and membrane. Each component offers a certain resistance to the wind uplift force. This can be illustrated through a force resistance link diagram, also shown in Figure 1. All resistance links should remain connected for the system to be durable and to keep the roof properly in place. Failure occurs when the wind uplift force is greater than the resistance of any one of these links. For example, the roof assembly is considered to have failed when a fastener pulls out from the deck even if the membrane and its seams are in good condition. Similarly, a system is considered failed when a seam tears under gusting wind while other components remain intact (Baskaran, 2002).
Figure 1. Wind effects on a mechanically attached system
Over the past ten years, a series of MAS were constructed and exposed to simulated dynamic wind uplift forces using the Dynamic Roofing Facility at the National Research Council of Canada (NRC-IRC). From this ongoing investigation, the wind uplift performance of assemblies with PVC membranes (Baskaran and Lei, 1997), assemblies with modified bituminous membranes (Chen and Baskaran, 1998) and assemblies with
thermoplastic olefin (TPO) membranes (Baskaran, Lei and Richardson, 1999) were reported. Based on this database, this paper presents, for the benefit of designers, a procedure to optimize a systems wind uplift resistance. For a roofing component manufacturer, the paper emphasizes the need to scrutinize experimental data through failure mode diagnosis so that wind uplift resistance can be improved. The paper concludes with a case study presenting a cost/benefit analysis for system optimization.
EXPERIMENTAL APPROACH
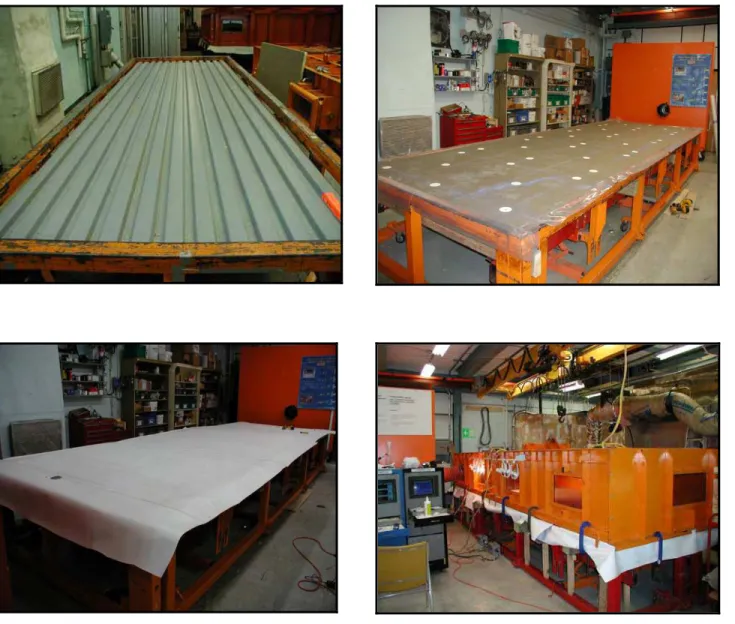
Experimental work was carried using the Dynamic Roofing Facility (DRF) established at the National Research Council of Canada Institute for Research in Construction (NRC/IRC). The DRF consists of a bottom frame of adjustable height upon which the roof specimen and a removable top chamber are installed (Figure 2). The design allows for the installation and study of roof assemblies with thicknesses of up to 450 mm (18”) as well as the evaluation of sloped roofs. The bottom frame and top chamber are 6000 mm (240”) long, 2150 mm (86”) wide and 800 mm (32”) high. The top chamber is equipped with six windows for viewing, and with a gust simulator, which consists of a flap valve connected to a stepping motor through a timing belt arrangement. Pressure suction as high as 10 kPa (209 psf) over the roof assembly is produced by a 37-KW (50HP) fan with a flow rate of 2500 L/sec (5300 cfm). A computer, using feedback signals, controls the operation of the DRF. The computer regulates the fan speed in order to maintain the required pressure in the chamber. Operation of the flap valve simulates the wind gusts in the form of uniform cyclic pressure loading over the surface of the roofing system. Closing the flap valve allows pressure to build in the chamber, while opening the valve bleeds the pressure. Also, the test facility has instrumentation
for measuring the dynamic response of the specimen. More information on the features of the DRF is given in Baskaran and Lei (1997).
Figure 2. Mechanically attached system on the Dynamic Roofing Facility
All assemblies were subjected to simulated wind dynamics in accordance with the load cycle of CSA standard A123.21-04. The CSA (2004) load cycle was developed based on wind-tunnel studies of full-scale roof assemblies. Studies were made of 3000 × 3000 mm (120” × 120”) roof assemblies using the NRC’s 9000 × 9000 mm (360” × 360”) wind tunnel. Two series of investigations were carried out with two types of roofing membranes. The first series dealt with a reinforced polyvinyl chloride (PVC) membrane and the other with a non-reinforced EPDM (EPDM is a terpolymer made from Ethylene,
Propylene and a Diene-monomer) membrane. Different configurations were tested for
variations in building height, wind speed and wind direction. The obtained unsteady histories of wind pressures were used for the load cycle development. The details of the developed load cycle can be found in a report by Baskaran et. al (1999).
Figure 3 shows the CSA load cycle, which has five rating levels (A to E). The test pressure on the Y-axis corresponds to the design pressure, in accordance with local building codes or wind standards. A summary of the load cycle follows:
As shown in Figure 3, the CSA dynamic protocol has five rating levels (A to E). To evaluate a roof assembly for a specific wind resistance, all the gusts corresponding to Level A should be applied.
Each level consists of eight load sequences with different pressure ranges, depicted in Figure 3. The eight load sequences can be divided into two groups.
Group 1 represents wind-induced suction over a roof assembly. It consists of four sequences, where the pressure level alternates between zero and a fixed pressure. Group 2 represents the effects of exterior wind fluctuations combined with a constant interior pressure on a building. Internal pressure variations are explicitly codified in the recent North American wind standards (ASCE 7-2005, NBCC 2005). The CSA test protocol accounts for such variations.
The test pressure ratios (Y-axis) for a test can be calculated from the design pressure, in accordance with local building codes or wind standards. The pressures for each load sequence are calculated as percentages of the test pressure.
To evaluate the ultimate strength of the roofing assembly, testing should be started at Level A and should be continued when moving from one level to another. To obtain a rating, all specified numbers of gusts in each level must be completed without any resistance link failure. As discussed in Figure 1, the assembly is considered as failed, even if only one resistance link fails.
Figure 3. CSA dynamic load cycle
EXPERIMENTAL SETUP
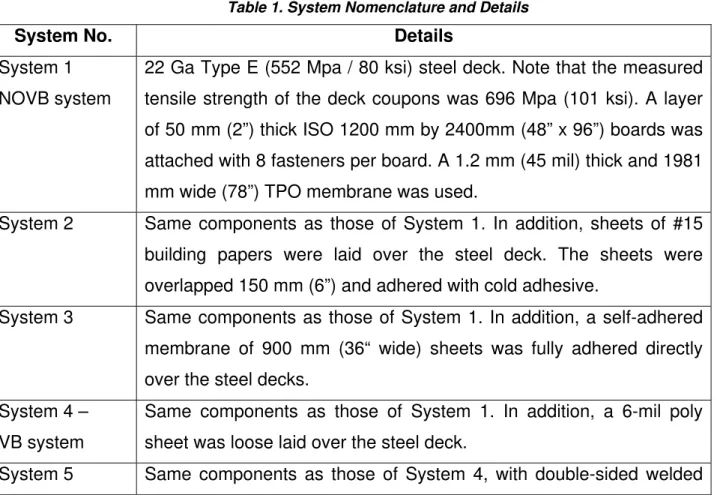
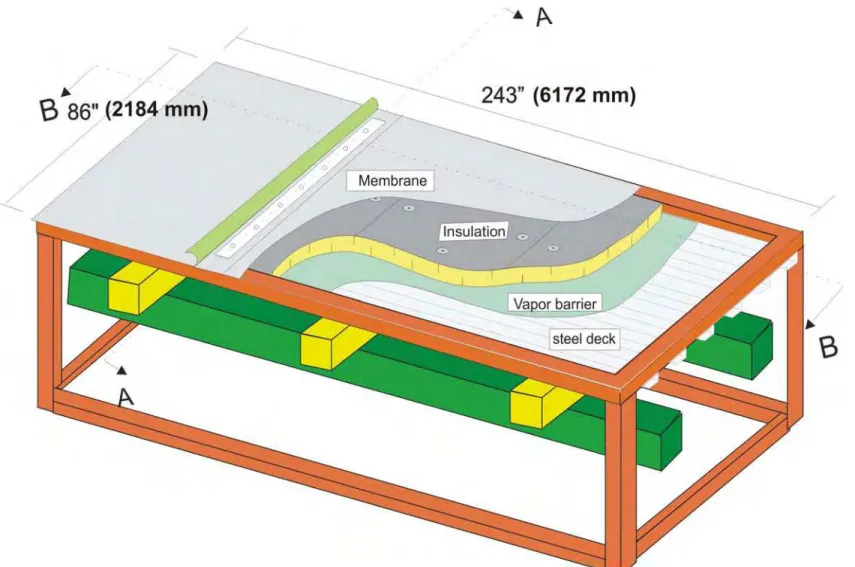
Six full-scale system mock-ups (Systems 1 to 6) were constructed and tested (Table1). For all the six systems, thermoplastic olefin (TPO) was used as the waterproofing membrane. Nominal physical and mechanical properties of the used components are grouped in Table 2. The geometric details of a typical tested system are depicted in Figure 4. Membrane sheets were fastened at 300 mm (12”) spacing (Fs) along the seam, resulting in seven fasteners per seam. Based on this arrangement, the distance
between fastener rows (Fr) was 1763 mm (70.5”). Fasteners were 125 mm (5”) long with metal plates of 60 mm (238”) diameter. A typical one-side weld (OSW) seam was used for membrane overlaps. Each seam had an overlap of 138 mm (5.5”), with fasteners placed 38 mm (1.5”) from the edge of the under sheet, and 72 mm (278”)from the edge of the overlapping sheet. The portion of the seam beyond the fastener row was welded with hot air so that a waterproof top surface was obtained. The width of the welded portion varied between 38 mm and 44 mm (1.5” and 1.75”).
Figure 4. Typical system layout Table 1. System nomenclature and details
Table 2. Nominal physical and mechanical properties of the components used
RESULTS AND DISCUSSION
System responses were measured as time histories by equipping the system with pressure sensors and load cells. All the measured time history records were analyzed and presented as pressure differences across the membrane or insulation and tensile forces on the membrane or insulation fasteners. Throughout the paper, data from system-sustained conditions are reported in three sections as follows:
• Effect of Vapor Barrier (retarder) on Wind Uplift • Effect of Seaming Technique on Wind Uplift • Effect of Deck Enhancement on Wind Uplift
In each section, failure mode photographs are included to identify the weakest link of the tested assembly.
Effect of Vapor Barrier (Retarder) on Wind Uplift
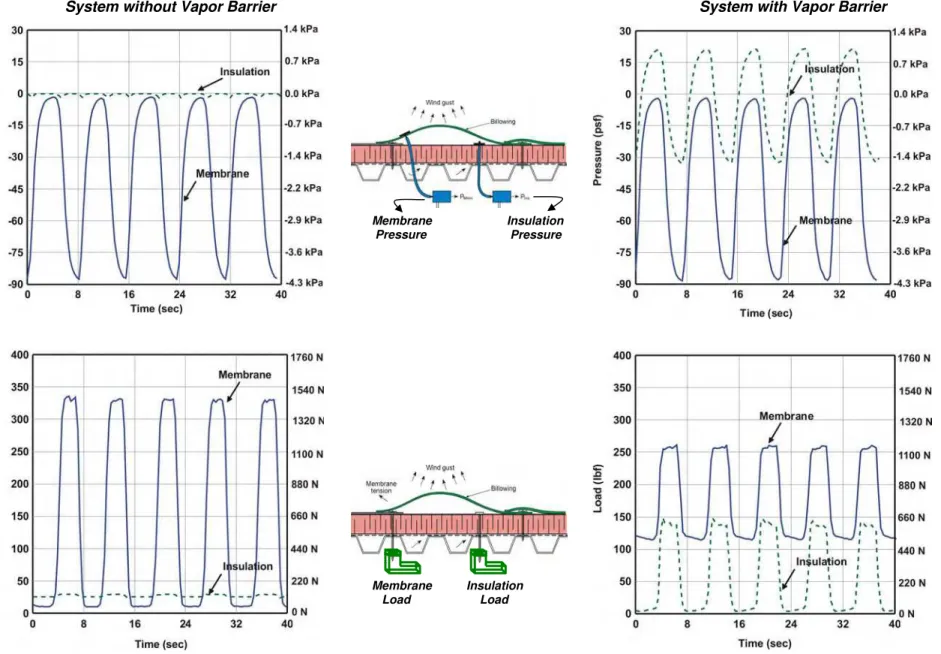
When subjected to dynamic wind loading cycles, the no vapor barrier (NOVB) system, as shown in Figure 5, System 1, sustained 4.3 kPa (90 psf) of wind uplift rating, whereas the vapor barrier (VB) system sustained a higher wind uplift rating of 6.5 kPa (135 psf). In other words, VB systems performed about 50% better than NOVB systems. This was found to be true regardless of the type of vapor barrier type used. Similar observations were reported by Smith (1995) under static testing. In the case of the NOVB systems, it is interesting to note that there is no pressures build-up across the insulation, and the insulation acts as a simple spacer between the membrane and the deck. The membrane is the only component resisting the wind uplift. However, in the case of the VB system, the insulation boards share the applied suction. This is due to the fact that these types of vapor barrier offer a certain resistance to airflow in addition to their primary function of limiting vapor diffusion. A research paper by Cook (1992) made the following conclusion about the presence of a vapor barrier in a roof system: “The vapor barrier shows a
single-sided response, resisting suctions by pressing up against the underside of the insulation boards, but falling slack into the deck troughs under pressure. The deck takes the remainder of the loads, since the sum of all three components exactly balances the applied suction”.
Figure 5. Wind uplift ratings of thermoplastic systems with and without vapor barrier (retarder)
After the wind test, failed systems were examined for the weakest resistance link. Figure 6 shows a typical example of a failure mode. Both systems failed due to membrane tear around the fastener plates. Closer examination of the failure showed that the membrane had been stretched around the plates, and then was torn completely away from the
plate, while the fasteners remained engaged with the deck. There was also an instance of delamination failure, as the membrane peeled slightly at one fastener location. Examination of the system’s seams after the test revealed that the membrane had experienced some stretching, and bore teeth marks from the metal fastener plates. The clamping force of the membrane fastener plate was higher than the tear resistance of the membrane, and this resulted in the ‘cookie cut’ on the membrane at the center fastener location. This might have resulted in tearing along the machine direction of the membrane at the adjacent fastener plate locations. In all of the scenarios, the fasteners were engaged well with the deck, and there was no bending of the plates. These conditions lead to the conclusion that the TPO membrane resistance was the weakest link in the assembly.
Figure 6. Failure mode investigation identifies membrane as the weakest link
If there is no change in the installation process and arrangement of the components, then how can the wind resistance of a VB system be better than that of a NOVB system? To understand this, the data presented in Figure 5 have been further analysed. As shown in Figure 6, the partial time history data analysis represents a segment from the measured pressure and load time history, respectively, representing loading sequence 4 of Level A (4.3 kPa / 90 psf) of the CSA load cycle. When suctions are applied at the top of the membrane, in the case of a NOVB system, there is no component other than the membrane that is air impermeable. This is clearly demonstrated in the pressure plots of the NOVB systems, where the full-applied suction (4.3 kPa / 90 psf) is acting across the membranes and there is no pressure build-up across the insulation. Introducing a barrier at the deck level can resist the air entry into
the assembly and the insulation that is trapped between the semi-air-impermeable VB and air-impermeable membrane is subjected to certain pressure due to membrane deformations. It is worth mentioning that the suction is applied at the top of the membrane; the membrane deforms and creates a volume of vacuum at the top of the insulation. This volume change creates a pressure change on the top of the insulation.
Figure 7. System load-sharing performance with and without vapor barrier (retarder)
This has also been evident from measured fastener loads. In the case of the NOVB system, the membrane fastener force varies from 0 to 1557 N (0 to 350 Ibf) with 4.3 kPa (90 psf) wind gusts. For the same 4.3 kPa (90 psf) wind gusts, on the VB system, the membrane fastener force only ranges between 445 and 1112 N (100 and 250 lbf) and the insulation fasteners share a load of about 667 N (150 lbf). In other words, the insulation shares about 40% of the tensile forces that were induced by the wind uplift pressures. Note that the unit lbf represents pound-force.
Effect of Seaming Technique on Wind Uplift
Both the VB systems and NOVB systems failed due to membrane tear. This means the weakest link in these systems is the TPO membrane. Failure mode investigation identified developments of asymmetrical forces on the seams at the membrane attachment locations, which caused the failure of the system. This asymmetrical force led to pulling of the membrane below the fastener plate and the metal plates profile configuration cutting the membrane. Note that in both systems, membrane seams (overlaps of two membrane sheets – ref Figure 4) were formed by one-side heat air welding. In order to enhance this resistance link and thereby improve the system’s
resistance, a double-side weld (DSW) technique was used to replace the one-side weld (OSW) method. Figure 6 shows the application technology of the OSW and DSW and compares force diagrams of these systems. In OSW systems (Figure 6a), during the wind uplift, tensile forces and tear forces are developed. With a weld on each side of the fastener, tear forces are developed along the two opposite directions of the welds. During wind gusting, by averaging over time, these forces can be expressed as follows: System with one-side weld: Fx =Ftensilecosσ (1) Fz =Ftensilesinσ (2) System with double-side weld: Fx =Ftensilecosσ1−Ftensilecosσ2 (3) Fz =Ftensilesinσ1+Ftensilesinσ2 (4) Where Fx and Fz are the respective horizontal and vertical forces andσ , σ1 and σ2are the membrane orientation angles due to wind uplift.
It is evident from Equation 3 that part of the forces developed on the fasteners in the horizontal direction for DSW systems (Figure 6b) can cancel each other because of their opposing equal symmetrical stress distribution pattern. On the other hand, the stress distribution is asymmetrical in the OSW system. This means that the induced force along the horizontal direction would be higher for the OSW system than for the DSW system. Consequently, the degree to which the fasteners are rocked sideways and cause membrane tear, would be reduced by the DSW technology.
Figure 8. Force diagram of OSW vs. DSW systems
A new system mock-up, System 5, was constructed and the DSW technique was used for seaming. Polymer batten strips 25 mm (1”) wide and 1.5 mm (57 mil) thick was used
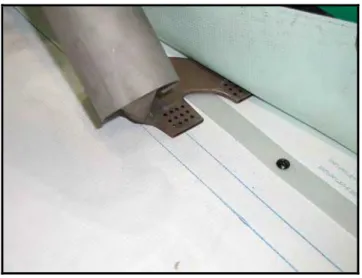
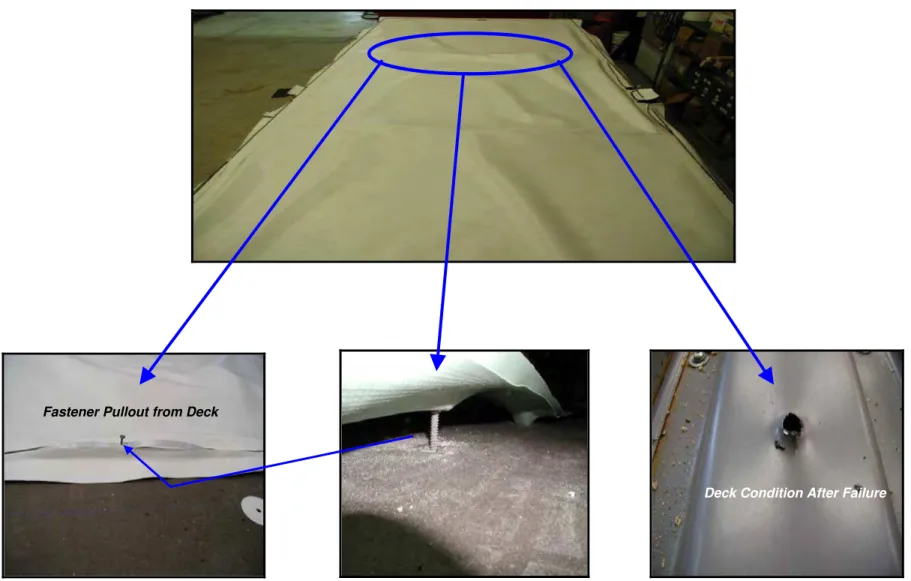
instead of round metal plates. The DSW seam width was 109 mm (4 3/8”) and the heat air process was used to form the seams with 38 mm (1.5”) wide welds on each side of the batten strip. System 5 also had a 6-mil poly vapor barrier similar to that of System 4. System 5 with DSW sustained a maximum pressure of 7.56 kPa (158 psf). Comparing it to a similar system with one-side weld, the double-side weld system had higher wind uplift resistance even though both systems had the same components. After the wind test failure, the system was examined to identify the weakest link. Figure 9 shows the failure mode of the DSW system. Instead of the membrane tearing around the fastener plate, as in the one-side weld system; the membrane’s center fastener was pulled out of the deck in the double-side weld system. This indicates that the weakest link of this system was fastener engagement with the deck. Not only was this mode of failure very abrupt, examinations of the deck showed extensive cracking at the engagement location. There was no noticeable damage either at the polymer battens or at the membrane seams.
Figure 9. Failure mode identifies deck as the weakest link
To understand the symmetrical force transfer behavior of the DSW system, time history data were further analyzed for induced membrane fastener force in the horizontal direction (Fx). Figure 10 presents the partial time history data analysis for System 4 and System 5. This has been taken from loading sequence 2 of Level A (2.15 kPa / 45 psf) and sequence 4 of Level A (4.3 kPa / 90 psf) of the CSA load cycle. To quantify the relative performance of the DSW with respect to OSW, the Y-axis presents the normalized data. This was obtained by dividing the measured DSW’s Fx data with that of the OSW. At both pressure levels, the horizontal forces of the DSW were significantly
reduced to less than 10% of the relative value. The partial time history data analysis supports the DSW theory in reducing the asymmetrical forces.
Figure 10. Reduction in asymmetrical forces in DSW systems
Effect of Deck Enhancement on Wind Uplift
For the present paper, deck enhancement means improving the strength of the structural deck in
terms of its gauge and fastener pullout resistance. In a mechanically attached roof system,
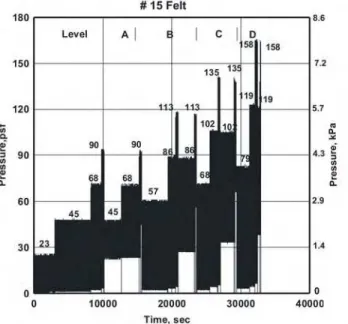
the wind-induced load is transmitted through the membrane fasteners to the structural deck. A roof system installed on a thicker deck (higher gauge thickness) can sustain higher wind uplift resistance than a system installed on a thinner deck (lower gauge thickness). This is due to the fact the pullout resistance of a given fastener can be high in a thicker deck. This is valid as long as other components of the roof system are not the weakest link. System 5, with double-side weld, failed due to fastener pullout. An attempt was made to find out how much the deck thickness would affect wind uplift forces on the roof system by using a thicker (20 Ga) deck on System 5. A new mock-up, System 6, was constructed with the same components used in System 5 with the exception of the deck. The measured fastener pullout resistances with a #15 fastener were 3114 N (700 lbf) and 4003 N (900 lbf) with 22 Ga and 20 Ga decks respectively. The fastener pullout loads were obtained as per ANSI (2006) test protocol. Table 3 groups the deck/fastener properties. The new mock-up was subjected to the CSA load cycle with a test pressure of 4.3 kPa (90 psf), similar to the other systems.
Table 3. Properties of deck/fastener components
System 6 passed the maximum pressure 8.62 kPa (180 psf) of the load cycle. It should be noted that when testing under the CSA load cycle, one can incrementally run the test up to a maximum pressure level equal to two times the selected test pressure (Baskaran, 1999). In other words, for System 6, there was no failure observed when the system passed Level E (8.62 kPa / 180 psf). This proved that a thicker steel deck could resist higher wind uplift resistance.
Figure 11 compares the measured fastener force at various pressure levels for System 5 and System 6. Data corresponding to Group 1 of the CSA load sequences were used. The graph indicates that for the system with the thicker deck, the sustained membrane loads are higher than for a system with a thinner steel deck. Other observations evident from Fig. 11 are as follows:
• For both deck types, the maximum measured fastener load from the system is less than the fastener pullout resistance. Note that the fastener pullout resistance was obtained using ANSI/SPRI FX-1 standard and it represents component evaluation. For the 22 Ga deck, the pullout resistance was 3114 N (700 lbf), whereas the measured fastener force was about 2669 N (600 lbf). In the case of System 6, respective values were 4004 N (900 lbf) and 3336 N (750 lbf). On other hand, currently, the equation used as a common practice is as follows:
System resistance = Fastener pullout value/ Fastener spacing x Fastener row spacing. (5)
• From the measured fastener forces it is cleat that the above relationship does not account for system resistance under dynamic testing as well as for the increased pressures at the perimeter and corner of the roofs.
• An increase in the tensile strength, from 696 Mpa (101 ksi) to 738 Mpa (107 ksi) is an indication of increase in the strength of the deck. As such, the responses to wind uplift are different between the two types of deck. This is more evident at pressure levels above 4.3 kPa (90 psf) when the measured fastener loads are higher for a thicker deck compared to a thinner one. Comparison of the measured deck deflections also confirmed that under the same wind uplift pressure, the thinner deck deflects more than the thicker one.
Figure 11. Measured fastener resistance force with variation in deck thickness
Presentation of these observations to roofing consultants (Baskaran and Ko, 2006) developed the following dialogue. System 5 failed at the fastener deck engagement due to fastener pullout. To strengthen this weakest link (refer to Figure 1), the present investigation selected a thicker deck as the design alternative in System 6. Alternatively, one can use fasteners that have a higher pullout resistance on the same deck. In other words, #15 fasteners were used in System 5 (with pullout resistance of 3114 N / 700 lbf), by changing it to #21 (with pullout resistance of 4893 N / 1100 lbf), it is logical that one can increase the wind uplift beyond 7.5 kPa (158 psf), similar to the present study. This design alternative is more beneficial in the case of reroofing where it is economical to select an alternative fastener rather than enhancing the existing deck as it can result
in additional labor cost. This is further discussed in the following section through a cost/benefit analysis.
System Optimization
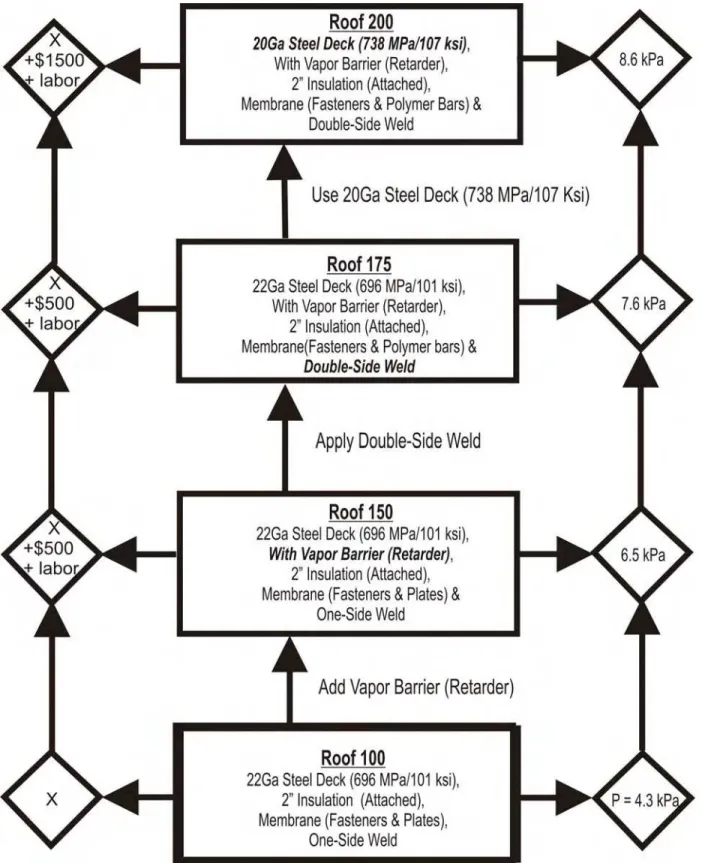
There is a myth that an increase in the wind uplift rating can significantly increase the overall roof system cost. Based on the presented data, a procedure can be developed for system optimization. Figure 12 shows a flow chart of such an optimization process. The basic system with deck, insulation and membrane can sustain a design pressure of 4.3 kPa (90 psf) and is labelled as Roof 100. Let us assume that Roof 100 is installed over a building with a roof area of 929 square meters (10,000 square feet). The full cost of Roof 100, including material and installation, is taken as $X for discussion purposes. By applying a VB to Roof 100, the wind rating increases by 50% and it sustains a pressure of 6.4 kPa (135 psf) (labelled as Roof 150 i.e. 4.3 x 1.5 = 6.4). The additional material cost for 929 square meters (10,000 square feet) due to the VB can be $500. By applying the double side weld technique, the Roof 100 rating increases from 4.3 kPa to 7.5 kPa (90 psf to 158 psf) as Roof 175 (4.3 x 1.75). Replacing the fastener plates with polymer batten bars, the only additional cost is labor to apply the DSW technique instead of the OSW technique. By enhancing Roof 175 with a thicker steel deck, it sustains a pressure of more than 8.6 kPa (180 psf). For Roof 200 (i.e. Roof 200 = 4.3 x 2), the additional material cost of replacing 929 square meters (10,000 square feet) of 22 Ga steel decks with 20 Ga is estimated as $1000. Through failure mode investigation, the weakest links of Roof 100 are systematically improved to achieve Roof 200, doubling the wind uplift resistance. However, the additional cost is only $1500 for material. In other words, for an increase of only $1.61 per square meter ($1500/929), the
wind uplift rating can be doubled. Although a thermoplastic system was used in this study, the concept of weakest link identification and the cost/benefit comparison can be equally valid for other systems (Baskaran et al, 2006). Equally, the authors submit that the presented cost estimates can vary based on the location and local roofing contractors market. The objective is to present a procedure to highlight the trends rather than the actual field construction costs.
Figure 12. System optimization by weakest link identification
CONCLUSION
This paper presented ways and means to improve the wind uplift performance of mechanically attached systems. It also demonstrated that experimental data together with failure mode investigations could be systematically used to identify the weakest links. This diagnostic practice can offer design alternatives for system enhancement. Through a case study, this paper also presented arguments for ways to double the wind uplift rating with minimum increase in the cost, as along as the weakest links are identified appropriately. It is understood that field roof may not perform as noted in the present study, as would be the case in any laboratory-based investigation. This is due to the fact for the field roof workmanship is critical for its actual performance.
REFERENCES
American Society of Civil Engineering (2005). Minimum Design Loads for Building and Other Structures, SEI/ASCE 7-05, New York, USA 10017-2398.
American Society for Testing and Materials, D1621 – 04, “Standard Test Method for Compressive Properties Of Rigid Cellular Plastics”
American Society for Testing and Materials, D751-06, ”Standard Test Methods for Coated Fabrics”.
Baskaran, A and Ko,S.K.P. (2006). "Which is the weakest link? Wind performance of mechanically attached systems," Proceedings of the RCI 21st International Convention, Phoenix, Arizona, March, pp. 29-39.
Baskaran, A. (2002). “Dynamic Wind Uplift Performance of Thermoplastic Roofing System with New Seam Technology,” ASCE, Journal of Architectural Engineering, Vol. 8, No. 4, December 1, 2002.
Baskaran, A., Chen, Y. and Vilaipornsawai, U. (1999). “A New Dynamic Wind Load Cycle to Evaluate Flexible Membrane Roofs,” ASTM, Journal of Testing and Evaluation 27(4), pp. 249 -265.
Baskaran, A. and Lei, W. (1997). “A New Facility for Dynamic Wind Performance Evaluation of Roofing Systems,” Proceedings of the Fourth International Symposium on
Roofing Technology, NRCA/NIST, Washington, D.C., U.S.A., pp. 168 –179.
Baskaran, A., Lei, W. and Richardson C. (1999). “Dynamic Evaluation of Thermoplastic Roofing Systems for Wind Performance,” ASCE, Journal of Architectural Engineering, Vol. 5, No. 5, pp. 16-24.
Canadian General Standards Board, CGSB 51.34-M86, ” Vapor Barrier, Polyethylene Sheet for Use in Building Construction”
Chen, Y., Baskaran, A. and Lei, W. (1998). “Wind load resistance of modified bituminous roofing systems,” Construction and Building Materials, Vol. 12 (8), December, pp. 471-480.
Cook, N.J. (1992). “Dynamic Response of Single-Ply Membrane Roofing Systems,” Geotechnics and Structures, Building Research Establishment, Garston, Watford, UK, Journal of Wind Engineering and Industrial Aerodynamics, 41-44, pp. 1525-1536.
CSA (2004). “Standard Test Method for the Dynamic Wind Uplift Resistance of Mechanically Attached Membrane Roofing Systems,” CSA A123.21-04. Canadian Standards Association, Toronto.
Good, C. (2005). “Surveying the Roofing Market,” Profession Roofing, NRCA, April. National Building Code of Canada (2005), National Research Council of Canada, Ottawa.
ANSI (2006), “Standard Field Test Procedure for Determining the Withdrawal Resistance of Roofing Fasteners,” ANSI/SPRI FX-1 2006.
Smith, T.L. (1995). “Air Retarders Improve Wind Performance,” Professional Roofing, March, p. 66.
7. Acknowledgements
The presented research is being carried out for a consortium - Special Interest Group for Dynamic Evaluation of Roofing Systems (SIGDERS). SIGDERS was formed from a group of partners who were interested in roofing design. These partners included:
Manufacturers Atlas Roofing Corporation, Canadian General Tower
Ltd., Carlisle Syn Tec., GAF Materials Corporation, GenFlex Roofing Systems, Firestone Building Products Co., IKO Industries Ltd., ITW Buildex, Johns
Manville, Sarnafil Roofing, Soprema Canada, Stevens Roofing, Tremco, Trufast
Building Owners Canada Post Corporation, Department of National
Defence, Public Works and Government Services Canada.
Industry Associations Canadian Roofing Contractors' Association, Canadian
Sheet Steel Building Institute, National Roofing Contractors’ Association, Roof Consultants Institute.
Table 1. System Nomenclature and Details
System No. Details
System 1 NOVB system
22 Ga Type E (552 Mpa / 80 ksi) steel deck. Note that the measured tensile strength of the deck coupons was 696 Mpa (101 ksi). A layer of 50 mm (2”) thick ISO 1200 mm by 2400mm (48” x 96”) boards was attached with 8 fasteners per board. A 1.2 mm (45 mil) thick and 1981 mm wide (78”) TPO membrane was used.
System 2 Same components as those of System 1. In addition, sheets of #15 building papers were laid over the steel deck. The sheets were overlapped 150 mm (6”) and adhered with cold adhesive.
System 3 Same components as those of System 1. In addition, a self-adhered membrane of 900 mm (36“ wide) sheets was fully adhered directly over the steel decks.
System 4 – VB system
Same components as those of System 1. In addition, a 6-mil poly sheet was loose laid over the steel deck.
seams.
System 6 Same components as those of System 5, except that a 20 Ga deck was used instead of a 22 Ga deck.
Table 2. Nominal physical and mechanical properties of the components
Deck
Type Refer Table 3
Thickness Refer Table 3
Overall Depth 38 mm (1.5")
Flute Spacing 150 mm (5.9")
Insulation
Type Polyiso
Dimensions 1219 mm x 2438 mm (4' x 8') x 51 mm (2")
Attachment Mechanically fastened, 8 fasteners per board
Compressive Strength as per ASTM D1621-2004
170 kPa (25 psi)
Barriers/Retarders/Support Board
Type Vapor barrier, CGSB 51.34-M86, 6 mil poly
Type Support Board, 1219 mm x 2438 mm x 12.7
mm gypsum board
Membrane
Type TPO
Width 1930 mm (76")
Thickness 1.1 mm (45 mil)
Tensile Property as per ASTM D 751-06 MD XD Breaking strength,
KN (lbf) 0.89 (200) 0.67 (151) Elongation at Max. Load,
% 35 30.5
Attachment
Type Mechanical fasteners
Fastener* 102 mm (4") # 15
Fastener Row Spacing 1791 mm (70.5")
Fastener Spacing 305 mm (12")
Slippage Control Yes
Seam
Type Hot air welding
Seaming Width Overlap = 140 mm (5.5")
Width of weld = 38 mm (1.5") ~ 41.3 mm (1 5/8")
Table 3. Properties of Deck/Fastener Components Nominal Measured* Deck Type Tensile Stress Mpa/Ksi** Thickness mm/inch Tensile Stress Mpa/ksi* Thickness Mm/inch Fastener pullout N/Lbf 22-80 550/80 0.760/0.030 700/101 0.740/0.0290 3114/700/ 20-80 550/80 0.910/0.036 750/107/ 0.900/0.035 4003/900
Wind uplift
Resistance
Insulation
Membrane
Deck
Fastener
Plate
Barrier
Seam
25 50 100 25 50 100 31 63 125 38 150 44 88 175 50 100 200
“Cookie Cut”
Tear along machine direction
System without Vapor Barrier System with Vapor Barrier Membrane Pressure Insulation Pressure Membrane Load Insulation Load
One-Side Weld (OSW) Double-Side Weld (DSW)
Figure 8. Force diagram of OSW vs. DSW systems (a)
Seam
Tensile force Fastener & plate
Peeling force Membrane Tearing force Fz Ftensile Fx Ftear s (b) Inner seam Tensile force Fastener & batten strip Tensile force Membrane Outer seam
Tearing force Tearing force
Fz Fx Ftensile Ftensile Ftear Ftear s 1 s 2
Fastener Pullout from Deck
Deck Condition After Failure
0 8 16 24 32 40 Time (sec) 0 20 40 60 80 100 No rma liz e d Fx ( % ) Pt = 45 psf Fx = OSW Fx = DSW 0 8 16 24 32 40 Time (sec) 0 20 40 60 80 100 No rm a liz e d Fx ( % ) Pt = 90 psf Fx = OSW Fx = DSW
0
200
300
400
500
600
700
800
Figure 11. Measured fastener resistance force with variation in deck thickness
0
25
50
75
100
125
150
175
200
100
Pressure (psf)
M
e
asu
re
d
F
a
st
en
er
Lo
ad
(
Ib
f)
20 Ga (80 / 107 ksi)Fastener pull out = 900 Ibf
22 Ga (80 / 101 ksi)
Fastener pull out = 700 Ibf
1 psf = 47.8 pa 1 lbf = 4.4 N
Figure Captions
Figure 1. Wind effects on a mechanically attached system
Figure 2. Mechanically attached system on the Dynamic Roofing Facility Figure 3. CSA dynamic load cycle
Figure 4. Typical roofing system Layout
Figure 5. Wind uplift ratings of thermoplastic systems with and without vapour barrier (retarders)
Figure 6. Failure mode investigation identifies membrane as the weakest link
Figure 7. System load sharing performance with and without vapour barrier (retarder) Figure 8. Force diagram of OSW vs. DSW systems
Figure 9. Failure mode identifies deck as the weakest link Figure 10. Reduction in asymmetrical forces in DSW systems
Figure 11. Measured fastener resistance force with variation in deck thickness Figure 12. System optimization by weakest link identification