Publisher’s version / Version de l'éditeur:
Vous avez des questions? Nous pouvons vous aider. Pour communiquer directement avec un auteur, consultez la première page de la revue dans laquelle son article a été publié afin de trouver ses coordonnées. Si vous n’arrivez pas à les repérer, communiquez avec nous à PublicationsArchive-ArchivesPublications@nrc-cnrc.gc.ca.
Questions? Contact the NRC Publications Archive team at
PublicationsArchive-ArchivesPublications@nrc-cnrc.gc.ca. If you wish to email the authors directly, please see the first page of the publication for their contact information.
https://publications-cnrc.canada.ca/fra/droits
L’accès à ce site Web et l’utilisation de son contenu sont assujettis aux conditions présentées dans le site LISEZ CES CONDITIONS ATTENTIVEMENT AVANT D’UTILISER CE SITE WEB.
Inter-Noise 2011: 4 September 2011, Osaka, Japan [Proceedings], pp. 1-7,
2011-09-04
READ THESE TERMS AND CONDITIONS CAREFULLY BEFORE USING THIS WEBSITE. https://nrc-publications.canada.ca/eng/copyright
NRC Publications Archive Record / Notice des Archives des publications du CNRC :
https://nrc-publications.canada.ca/eng/view/object/?id=9ed0c2f2-798f-489b-a5e7-5106a7063430 https://publications-cnrc.canada.ca/fra/voir/objet/?id=9ed0c2f2-798f-489b-a5e7-5106a7063430
NRC Publications Archive
Archives des publications du CNRC
This publication could be one of several versions: author’s original, accepted manuscript or the publisher’s version. / La version de cette publication peut être l’une des suivantes : la version prépublication de l’auteur, la version acceptée du manuscrit ou la version de l’éditeur.
Access and use of this website and the material on it are subject to the Terms and Conditions set forth at
Objective and subjective assessment of lightweight wood-framed floor
assemblies in response to footstep and low-frequency impact sounds
Bradley, J. S.; Zeitler, B.; Schoenwald, S.
Objective and subjective assessment of
lightweight wood-framed floor assemblies in
response to footstep and low-frequency impact
sounds
Gover, B.N; Bradley, J.S.; Zeitler, B.; Schoenwald, S.
NRCC-54534
A version of this document is published in / Une version de ce document se trouve dans:
Inter-Noise 2011, Osaka, Japan, September 4-7, 2011, pp. 7
The material in this document is covered by the provisions of the Copyright Act, by Canadian laws, policies, regulations and international agreements. Such provisions serve to identify the information source and, in specific instances, to prohibit reproduction of materials without written permission. For more information visit http://laws.justice.gc.ca/en/showtdm/cs/C-42
Les renseignements dans ce document sont protégés par la Loi sur le droit d’auteur, par les lois, les politiques et les règlements du Canada et des accords internationaux. Ces dispositions permettent d’identifier la source de l’information et, dans certains cas, d’interdire la copie de documents sans permission écrite. Pour obtenir de plus amples renseignements : http://lois.justice.gc.ca/fr/showtdm/cs/C-42
1
Objective and Subjective Assessment of Lightweight Wood-Framed
Floor Assemblies in Response to Footstep and Low-Frequency
Impact Sounds
Bradford N. Gover1, John S. Bradley, Berndt Zeitler, and Stefan Schoenwald
National Research Council Institute for Research in Construction 1200 Montreal Road, Ottawa, Ontario, K1A 0R6 CANADA
ABSTRACT
The acoustical performance of lightweight wood-framed floor assemblies has been assessed, in response to various impact sounds. For each of a series of full-scale floor-ceiling assemblies, standard impact measurements were made with the sources defined in JIS A 1418 including the tapping machine (light impact source), the rubber ball (heavy impact source), and the so-called “bang machine” tire (heavy impact source). The impact measurements were used to calculate standardized metrics and non-standardized variants. Also, for each assembly, sound recordings were made of the sounds generated by the ball drops and by adult walkers without shoes. These recordings were played back in a controlled laboratory room to listening test participants, who rated the reproduced sounds in terms of “annoyance”. Preliminary results from floors without coverings indicate that listeners ranked the floor assemblies slightly differently for the walkers than for the ball drops. In addition, some of the standardized sources and metrics were less appropriate than others for rating subjective response. The rankings based on use of the heavy tire (“bang machine”), in particular, were not best correlated with subjective rankings.
Keywords: Floor, Impact, Subjective Rating
1. INTRODUCTION
In this paper, preliminary results are presented for the objective and subjective ratings of the impact sound insulation provided by light-weight wood-framed floor ceiling assemblies. Some related results from this preliminary investigation have been presented in Ref. [1], but in this paper, additional results specific to the heavy impact sources are discussed.
The objective ratings are determined from measurements using impact sources described in JIS A 1418 [2]: the tapping machine (light impact source), the rubber ball (heavy impact source), and the so-called “bang machine” tire (heavy impact source).
The subjective ratings are based on judgments of relative “annoyance” by 12 listening test participants, in response to two types of impact sound: the footfalls of adult walkers (without shoes), and the sound resulting from dropping the rubber impact ball. The latter has been suggested to be similar to children running or jumping [3].
2. RECORDINGS AND PHYSICAL MEASUREMENTS
The floor-ceiling assemblies were constructed at the National Research Council in Ottawa, Canada, in the facility used for investigation of direct sound transmission, in which flanking sound transmission is greatly suppressed. This facility consists of two reverberation rooms, one above the other, each with a volume of about 175 m3. There is a 3.8 by 4.7 m opening between the two rooms, for the specimen. The impact sources are in the upper room, and the measurement microphones are in the lower room.
2.1 Floor-Ceiling Assemblies
In total, 19 floor-ceiling assemblies were tested. All were wood-framed, and represented a wide range of construction details in terms of: toppings, subfloor layers, framing (joists and blocking), ceiling attachment method, and ceiling layers. None of the floors had coverings (such as carpet, laminate flooring, vinyl, etc.). Table 1 lists the specimens and gives a brief coded description of each. The labels “NRC-xx” are simply to identify the specimens. The descriptive short codes in the right-hand column are explained in the bottom rows of the table. This set of floors includes a wide
1
2
range of performance, in terms of sound insulation, from excellent to very poor.
Table 1 – Specimen descriptions
NRC-08CT REF004100_RESL9_PLY28_SCWJ235(455)_GFB100_RC13(455)_G21_G16 NRC-06 2PLY16_WJ254(455)_CWJ140(455)_GFB100_RC13(455)_G21_G16 NRC-07A PLY16_SCWJ235(455)_GFB100_RC13(455)_G21_G16 NRC-02T REF01268_PLY16_SCWJ235(455)_BLKING235(455)_GFB100_WFUR19(455)_RC13(455)_G21_G16 NRC-01 2PLY16_WJ235(455)_BLKING235(455)_GFB100_WFUR19(455)_RC13(455)_G21_G16 NRC-05T REF01268_PLY16_SCWJ235(455)_GFB100_RC13(455)_G21_G16 NRC-08A PLY28_SCWJ235(455)_GFB100_RC13(455)_G21_G16 NRC-04 2PLY16_SCWJ235(455)_GFB100_WFUR19(455)_RC13(455)_G21_G16 NRC-02 2PLY16(455)_SCWJ235(455)_BLKING235(455)_GFB100_WFUR19(455)_RC13(455)_G21_G16 NRC-03 2PLY16_WJ235(227)_GFB100_WFUR19(455)_RC13(455)_G21_G16 NRC-05 2PLY16_SCWJ235(455)_GFB100_RC13(455)_G21_G16 NRC-16 PLY16_WJ235(455)_GFB100_RC13(455)_G13 NRC-20 OSB19_WI302(406)_GFB150_RC13(406)_2G16 NRC-22 PLY16_WJ235(455)_CWJ140(455)_GFB100_RC13(455)_G13 NRC-18 PLY16_WJ254(455)_CWJ140(455)_GFB100_2G13 NRC-15AT REF01268_PLY16_WJ235(455)_GFB100_2G13 NRC-21 PLY16_WJ235(455)_CWJ140(455)_GFB100_G13 NRC-15 PLY16_WJ235(455)_GFB100_2G13 NRC-14 PLY16_WJ235(455)_GFB100_G13
Codes above read left-to-right describe the specimen from top to bottom. Element codes are:
PLY Plywood REF004100 100 mm Concrete Topping
OSB Oriented Strand Board REF01268 68 mm Mortar Topping
GFB Glass Fibre Batts RESL Resilient Underlay
WJ Wooden Floor Joists CWJ Wooden Ceiling Joists
SCWJ Scabbed Wooden Floor Joists BLKING Wooden Blocking
RC Resilient Channels WFUR Wooden Furring Strips
G Gypsum Board
Numbers preceding the element codes indicate multiple layers: e.g., “2PLY” means 2 layers of plywood Numbers following the element code indicate thickness in mm: e.g., “G21” means 21 mm thick gypsum board Numbers in parentheses indicate spacing in mm: e.g., “WJ235(455)” means 235 mm wood joists, spaced 455 mm on centre
2.2 Objective Measurements and Metrics
Measurements of impact sound were made in accordance with JIS A 1418 and ISO 10140-3 [4], using all three sources (impact ball, tire machine, standard tapping machine), for all 19 assemblies.
The physical metrics calculated from the impact ball and the tire machine included Li,Fmax,r (in
accordance with JIS A 1419 [5]), Li,Fmax,Aw (in accordance with KS F 2863 [6]), and LiFavg,Fmax(63-1k Hz),
recently proposed in Ref. [7]. For the standard tapping machine, the physical metrics included Li,r,L
(in accordance with JIS A 1419), and Ln,w, Ln,w+CI,50-2500, and Ln,w+CI,100-2500 (in accordance with
ISO 717 [8]).
The relationships between the metrics are summarized in Table 2, which shows the “R-squared” (square of correlation coefficient) between pairs of metrics. Note that there are very high correlations between Li,Fmax,r and Li,Fmax,Aw measured with both the ball (A and B) and the tire (D and E). The
correlation of LiFavg,Fmax(63-1k Hz) (C and F) with these standardized metrics is somewhat lower,
particularly for the tire (F). Note also that the correlations of LiFavg,Fmax(63-1k Hz) measured with the
impact ball (C) with Ln,w+CI,100-2500 (H) and Ln,w+CI,50-2500 (I) measured with the standard tapping
machine are very high (R2 = 0.97).
A B C D E F G H I Table 2 – R2 (square of correlation coefficient) between pairs of metrics.
3 A Li,Fmax,r (ball) 1 0.97 0.90 0.90 0.94 0.79 0.79 0.82 0.91 B Li,Fmax,Aw(ball) 1 0.96 0.86 0.91 0.90 0.85 0.90 0.96 C LiFavg,Fmax(63-1kHz)(ball) 1 0.75 0.81 0.91 0.92 0.97 0.97 D Li,Fmax,r (tire) 1 0.98 0.71 0.56 0.63 0.77 E Li,Fmax,Aw(tire) 1 0.77 0.63 0.70 0.84 F LiFavg,Fmax(63-1kHz)(tire) 1 0.80 0.89 0.92 G Li,r,L 1 0.96 0.91 H Ln,w+CI,100-2500 1 0.95 I Ln,w+CI,50-2500 1
2.3 Recordings for Listening Tests
For the listening tests, two sets of recordings were generated: adult walkers not wearing shoes, who walked in an approximately circular pattern around the centre of the specimen, and a single drop of the rubber impact ball, dropped from a height of 10 cm, in the centre of the assembly. (Recordings and listening tests for the impact ball dropped from heights of 50 cm and 100 cm were also conducted, and some results are presented in Ref. [1].) A low-noise microphone was located directly under the centre of the assembly, 115 cm from the ceiling. Absorptive foam was brought into the lower room to control reverberation, so that the recordings sounded more typical of dwelling spaces.
3. LISTENING TEST
3.1 Facility
The laboratory room used for playback and subjective evaluation measures 9.2 by 4.7 m, with a height of 3.6 m, and is constructed of concrete block. The interior walls of the room were lined with 10 cm-thick foam, and a “T-bar” ceiling with 25 mm-thick glass fibre ceiling tiles was installed. The floor was covered with carpet.
A single 46-cm subwoofer (JBL Professional 4641) and a pair of full range loudspeakers (Paradigm Compact Monitor) hung from the concrete ceiling of the room, above the suspended ceiling. The ceiling tiles in front of the loudspeakers were removed and replaced with a thin fabric sheet. A crossover with a cutoff frequency of 100 Hz was used to send the low frequency components to the subwoofer, and the higher frequency components to the full range loudspeakers.
The electroacoustic playback system was tuned by first equalizing (+/– 1 dB) over the frequency range from 30 to 5000 Hz, when measured at the listener position using steady state noise. The transient response of the loudspeakers was then further compensated via equalization derived by analysis of playback and comparison with the original recorded ball drops.
3.2 Presentation and Subject Response
For the listening tests of ball drops, one ball drop per test specimen was used (dropped at the centre of the floor). There were 18 test samples to rate – one for each assembly except NRC-16 (no usable recordings were gathered).
For the listening tests of walkers, recordings for each of three walkers per test assembly were included. These recordings were obtained for all 19 test assemblies. There were therefore 3 x 19 = 57 test samples to rate, each 4 s in duration.
The test samples from ball drops and walking were not presented during the same test. The test participant first heard and rated all the samples from the 10 cm ball drop before moving on to a separate test containing the walking sounds. For the ball drops, each sample was presented 5 times (i.e., throughout the duration of the test, the participant was asked to rate the same sound 5 different times). Each test therefore included 5 x 18 = 90 test items to score. For the walkers, the 57 walking samples were presented 3 times each (for a total test length of 171 test items). In all cases, the order of presentation within a test was randomized.
4
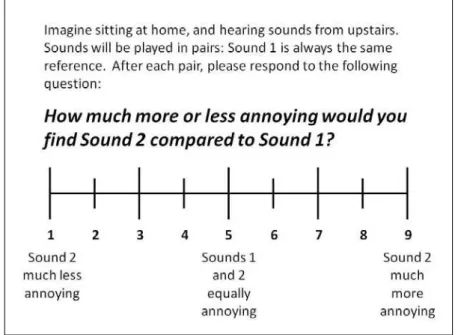
sound relative to the first, which within a given test, was always the same reference. The instructions and scale are shown in Fig. 1. The reference sound for the tests was the test recording made from assembly NRC-05 (the corresponding ball drop, or for the case of the walkers, one of the three included samples). This was selected since it was estimated based on objective measures that the performance of assembly NRC-05 would be near the middle of the group when ranked. The subject was instructed that if the second sound was equally annoying to the first (reference) sound, to respond numerically by scoring the second sound a “5”. This testing method allows the subject to rate a floor as “better” or “worse” than the reference by scoring lower or higher than 5, and to quantify how much “better” or “worse” by using the scale from 1-5 and from 5-9.
Fig. 1: Instructions and scale for listening test.
4. LISTENING TEST RESULTS
A summary of the listening test results is shown in Fig. 2. Each of the two bar plots shows the average annoyance rating given for the test samples corresponding to the assembly listed to the left of the bars. Each of the two bar graphs is for one impact source – ball drop from 10 cm or walker, indicated at the top. The assemblies are listed from top to bottom on each plot in order of increasing annoyance score (i.e., the “best” floor assembly is listed at the top, the “worst” at the bottom). The red brackets indicate that the difference in scores for the indicated pair of bars is not significant at the
p < 0.05 level. The absence of a red bracket indicates that the difference is significant at the p < 0.05
5
Fig. 2: Listening test results from 12 subjects. Bar length indicates mean annoyance rating for each assembly, which are listed at left of each plot. Assemblies are sorted by score from least annoying at top to most annoying at bottom. A red bracket between a pair of bars indicates that the difference is not statistically significant at the p < 0.05 level. Absence of a red bracket means the difference is significant at the p < 0.05
level. Plot at right shows relationship between the two judgements.
The ranking order of assemblies based on walkers is somewhat different than that based on the ball drops. Note specifically assembly NRC-07A, which was judged 3rd-best for walking, but 9th-best for the ball drops. This is perhaps not surprising since the floors are intentionally being excited differently. Furthermore, it is expected to observe more variance in the walker data since there is a variance due to different walkers in the test. Shown at the right of Fig. 2 is a plot of subjective ranking by ball drops versus subjective ranking by walking. The R-squared was 0.83.
5. CORRELATION WITH OBJECTIVE METRICS
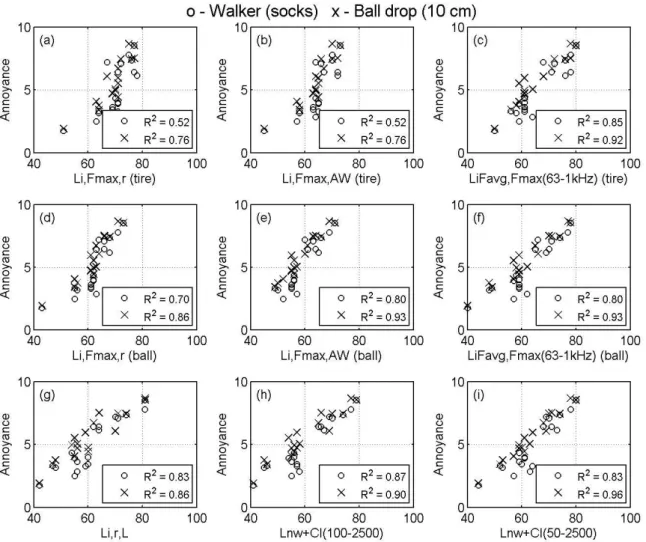
Figure 3 shows the relationships between the subjective ratings of annoyance, determined from the listening tests, and the objective measures of sound insulation, determined from the physical measurements. The results include both the subjective rankings of the walkers (‘o’) and of the ball drops from a height of 10 cm (‘x’). The R2 of each relationship is listed on each plot.
Notice from panels (a)–(c) that the correlations with the metrics derived from use of the tire machine are the lowest, particularly for Li,Fmax,r and Li,Fmax,Aw. The LiFavg,Fmax(63-1k Hz) measure
correlates well with annoyance judgments of the ball drop sound for both the tire and the ball. The plots in panels (d)–(f) suggest that the metrics derived from use of the impact ball are well correlated
6
with subjective response to the ball drops, and to a lesser extent, the walking sounds. The plots in panels (g)–(i) indicate that measures determined from use of the standard tapping machine are in fact quite highly correlated with subjective ranking for both types of sounds, particularly for the variants including the spectrum adaptation terms.
Fig. 3 Subjective annoyance score versus objective measures of sound insulation: the ‘o’ symbols for walkers without shoes, and the ‘x’ symbols for the ball drop from 10 cm.
6. CONCLUSIONS
Based solely on the results of Fig. 3, it appears that the ratings Li,Fmax,r and Li,Fmax,Aw, determined by
use of the tire machine, are not the best options. The results obtained with the impact ball are more highly correlated with subjective judgments. LiFavg,Fmax(63-1k Hz) correlates well with annoyance
judgments of the ball drop sounds for both the tire and the ball. It is particularly noteworthy that using the standard tapping machine and metrics that include the spectrum adaptation term CI, give the
highest correlations for both types of impact sounds. This supports similar conclusions offered in Ref. [9], which included only objective analyses, but of a wider range of assemblies, and included walkers wearing shoes.
Further investigations that include more listening tests, and floor assemblies having coverings, are ongoing.
ACKNOWLEDGEMENTS
The support of the Council of Forest Industries through the Canada Wood and Forestry Innovation Initiative Programs is gratefully acknowledged.
7
REFERENCES
[1] B. Gover, J. Bradley, S. Schoenwald, and B. Zeitler, “Subjective Ranking of Footstep and Low-Frequency Impact Sounds on Lightweight Wood-Framed Floor Assemblies” Proc. Forum
Acusticum 2011, Aalborg, Denmark (2011).
[2] JIS A 1418 Acoustics -- Measurement of floor impact sound insulation of buildings (2000).
[3] J. Y. Jeon, J. K. Ryu, J. H. Jeong, and H. Tachibana, “Review of the impact ball in evaluating floor impact sound,” Acta Acust. Acust., 92, pp. 777–786 (2006).
[4] ISO 10140-3 Acoustics– Laboratory measurement of sound insulation of building elements – Part 3: Measurement of impact sound insulation (2010).
[5] JIS A 1419-2 Acoustics − Rating of sound insulation in buildings and of building elements − Part 2: Floor impact sound insulation (2000).
[6] KS F 2863-2 Rating of floor impact sound insulation for impact source in buildings and of building elements –Part 2 –Floor impact sound insulation against standard heavy impact source (2002).
[7] J. Ryu, H. Sato, K. Kurakata, A. Hiramitsu, M. Tanaka, and T. Hirota, “Subjective ratings of heavy-weight floor impact sounds in wood frame construction” Acoust. Sci. & Tech., 31(5), pp. 371–375 (2010).
[8] ISO 717-2 Acoustics – Rating of sound insulation in buildings and of buildings elements – Part 2: Impact sound insulation (1996).
[9] A.C.C. Warnock, “Low-frequency impact sound transmission through floor systems,” Proc. Inter-Noise