An Artificial Tissue Homeostasis Circuit
Designed via Analog Circuit Techniques
The MIT Faculty has made this article openly available.
Please share
how this access benefits you. Your story matters.
Citation
Teo, Jonathan J.Y. et al. " An artificial tissue homeostasis circuit
designed via analog circuit techniques" IEEE Transactions on
Biomedical Circuits and Systems 13, 3 (June 2019): 540-553. ©
2007-2012 IEEE.
As Published
10.1109/TBCAS.2019.2907074
Publisher
Institute of Electrical and Electronics Engineers (IEEE)
Version
Author's final manuscript
Citable link
https://hdl.handle.net/1721.1/129772
Terms of Use
Creative Commons Attribution-Noncommercial-Share Alike
An Artificial Tissue Homeostasis Circuit Designed via Analog
Circuit Techniques
Jonathan J.Y. Teo,
Computational and Systems Biology Program, Massachusetts Institute of Technology, Cambridge, MA 02139 USA.
Ron Weiss, Rahul Sarpeshkar [Fellow, IEEE]
Departments of Engineering, Microbiology & Immunology, Physics, and Molecular and Systems Biology, Dartmouth College, Hanover, NH 03755 USA
Abstract
Tissue homeostasis (feedback control) is an important mechanism that regulates the population of different cell types within a tissue. In type-1 diabetes, auto-immune attack and consequent death of pancreatic β cells result in the failure of homeostasis and loss of organ function. Synthetically engineered adult stem cells with homeostatic control based on digital logic have been proposed as a solution for regenerating β cells. Such previously proposed homeostatic control circuits have thus far been unable to reliably control both stem-cell proliferation and stem-cell differentiation. Using analog circuits and feedback systems analysis, we have designed an in silico circuit that performs homeostatic control by utilizing a novel scheme with both symmetric and asymmetric division of stem cells. The use of a variety of feedback systems analysis techniques, which is common in analog circuit design, including root-locus techniques, Bode plots of feedback-loop frequency response, compensation techniques for improving stability, and robustness analysis help us choose design parameters to meet desirable specifications. For example, we show that lead compensation in analog circuits instantiated as an incoherent feed-forward loop in the biological circuit improves stability while simultaneously reducing steady-state tracking error. Our
symmetric and asymmetric division scheme also improves phase margin in the feedback loop, and thus improves robustness. This work could be useful in porting an analog-circuit design
framework to synthetic biological applications of the future.
Keywords
Biochemical reaction; biological circuit simulation; homeostasis circuits; cellular models; cytomorphic; feedback; reaction networks; systems biology; synthetic biology
I. I
NTRODUCTIONTissue homeostasis is a negative-feedback process that regulates the number of cells in a tissue. It helps maintain a healthy tissue size while allowing cells to respond quickly to
HHS Public Access
Author manuscript
IEEE Trans Biomed Circuits Syst
. Author manuscript; available in PMC 2020 June 01.Published in final edited form as:
IEEE Trans Biomed Circuits Syst. 2019 June ; 13(3): 540–553. doi:10.1109/TBCAS.2019.2907074.
A
uthor Man
uscr
ipt
A
uthor Man
uscr
ipt
A
uthor Man
uscr
ipt
A
uthor Man
uscr
ipt
aberrant cell growth or to excessive cell death while ensuring the efficient use of resources. Tissues that lack robust homeostatic control are prone to disease because they are either unable to function adequately if the cell population is too small [1], [2], or utilize resources poorly if the cell population is too large [1], [3]. A well-designed negative feedback control system is therefore crucial for maintaining healthy functioning organs.
In biological cells, negative-feedback control is subjected to constraints of loading, noise, robustness, non-linearity and resource limitation. Many of the problems found in biology are also found in analog circuits and reviewed in [4]–[6]. To address these challenges, analog circuit designers have developed various tools and methods that aid with the crafting and analysis of highly complex circuits. Circuit design is an art that cleverly combines visual tools, like symbols and pictorial circuit motifs, with computational tools, like electronic circuit simulators and control-system toolboxes, to guide the design of complex circuits. It uses hierarchical design, which can be as exact or as approximate as the level of abstraction desired while preserving the intuition that comes from a graphical interpretation of
complicated systems. It creates physically accurate models with few parameters, so there is little risk of overfitting, but the circuit retains its descriptive and predictive power without losing generality [4]–[6]. Traditionally, methods used to study negative feedback in biological systems such as eigenvalue stability analysis are limited to low dimensional models of their biological counterparts [7], [8]. Analog circuit techniques provide biologists with a more rigorous framework to not only analyze negative feedback in complex systems but also to design control systems that account for the constraints mentioned above. Here, we leverage these tools and methods to identify different ways of achieving homeostatic control of β cells in the pancreatic tissue of patients with type 1 diabetes (T1D).
Pancreatic β cells, which are found in its islet, produce insulin, a hormone responsible for regulating blood glucose level. In patients with T1D, β cells are lost through auto-immune attack in the pancreatic islet, resulting in a loss of insulin production. A possible therapy is to derive functional glucose-sensitive insulin-producing β-like cells in vitro [9]–[11], and transplant them into the patients as a cell-replacement treatment. However, the transplanted β cells are still susceptible to the underlying autoimmune disorder. Thus, a simple β cell transplantation, unless coupled with other strategies such as using immunosuppressant drugs to reduce autoimmune response or encapsulating the transplanted cells to guard against autoimmune attack, does not lead to long-term insulin-independence [12], [13]. Human pluripotent stem cells (hPSC) can provide a renewable source of cells through differentiation. Therefore, in diseases that are caused by loss of functional cells in adult tissues such as in type 1 diabetes, they hold the potential as a cell-replacement treatment. For example, one can transplant pancreatic progenitor cells or hPSC directly and allow them to mature in vivo [14], [15]. The transplanted cells retain their proliferative capabilities and undergo both differentiation to generate mature β cells and self-renewal to maintain a viable pool of proliferative cells. One caveat in such strategies is the potential for tumorigenicity, an adverse side effect that occurs when stem cells proliferate uncontrollably [16], [17]. Another caveat is that the transplanted cells may deplete and not self-renew sufficiently, instead losing pluripotency, and differentiating into downstream cells in the endoderm lineage. It is therefore crucial that transplanted stem cells or progenitor cells are subjected to
A
uthor Man
uscr
ipt
A
uthor Man
uscr
ipt
A
uthor Man
uscr
ipt
A
uthor Man
uscr
ipt
some form of homeostatic regulation to ensure that they are always able to differentiate into the desired cells on demand.
Somatic stem cells in healthy adult tissue naturally already regulate their populations via homeostatic control [18]. In a healthy tissue, such somatic stem cells are generally in a quiescent state, growing slowly and differentiating mainly via asymmetric division [18]. When the tissue is under stress, stem cells increase in numbers and also differentiate rapidly until the damage is repaired [18]. It is unclear if the same homeostatic control mechanism is employed when hPSCs are transplanted into diseased tissues. Indeed, preliminary studies in animal models have shown that transplanting hPSCs into mice can lead to tumors, which suggests that homeostatic control is either not present or is weakened [17]. Furthermore, the impact of chronic stress on homeostatic control has been observed. For example, in
Drosophila sustained intestinal stem cell proliferation triggered by chronic oxidative stress from an increased bacterial load leads to loss of tissue homeostasis in the gut epithelium [18], [19]. It is also widely known that chronic inflammation of a tissue increases the risk of cancer [20]. Thus, in conditions that lead to chronic sustained proliferation, natural
homeostatic control mechanisms in hPSCs appear inadequate in preventing tumors from forming. In this paper, we propose a synthetic tissue-homeostasis circuit that can
complement and augment healthy or diseased tissue’s ability to respond to chronic stress. It leverages recent developments in the field of synthetic biological design.
Synthetic biology focuses on designing new biological systems using RNA, DNA, protein and small-molecule interactions. It has a wide range of applications in biotechnology, therapeutics, energy production, medicine, and agriculture. While progress has been made in the design of synthetic biological circuits, challenges remain in scaling to larger, more predictable and more robust designs. For example, biological parts are not modular, they experience crosstalk and retroactivity (loading) when combined to form a larger circuit; biology is noisy and synthetic circuit design does not always account for noise accurately; a cell has limited resources and may not tolerate the additional burden of a synthetic circuit; conforming biology to a digital computing architecture is expensive in both the biological parts and the energy needed; and there is a general lack of a useful modeling framework [4]. To adapt synthetic biology to an analog circuit framework, we have developed a schematic that maps synthetic biological circuits to analog circuits with exact mathematical mapping of differential equations [6]. We illustrate this mapping for basic transcription and translation regulatory building blocks and apply it to the design of a complex homeostasis circuit. Drawing on our previous work that adapts analog circuit theory to represent, design and analyze synthetic biological circuits, particularly those involving feedback loops [6], [21], we propose a homeostasis circuit design that achieves various specifications of stability, performance, and robustness in a context that accounts for many of the challenges of biological substrate. Our proposed synthetic design solves several problems seen in prior proposed homeostatic designs [22], [23] and is also more faithful to how homeostasis loops in nature already work.
The paper is organized as follows. In Section IIA, we introduce an analog-circuit schematic representation that serves as the foundation for all circuit design and analysis. In Sections
A
uthor Man
uscr
ipt
A
uthor Man
uscr
ipt
A
uthor Man
uscr
ipt
A
uthor Man
uscr
ipt
IIB, IIC and IID, we then compare between three different synthetic circuit designs: an asymmetric-division-only circuit design; an asymmetric-and-symmetric-division circuit design; and, the latter circuit design with the addition of an incoherent feedforward loop. We characterize steady-state behavior and transient response of all circuit designs. In Section IIE, we provide an analysis of the parameter robustness of our circuits using sensitivity analysis. In Section III, we discuss details of our methods. In Section IV, we conclude our paper by summarizing its main contributions.
II. R
ESULTSA. Analog Circuit Schematic Representation
Analog circuits can quantitatively and schematically represent coupled linear or nonlinear ordinary differential equations (ODEs) as interacting circuit elements, each of which has intrinsic or controlled current-voltage characteristics [6]. Typically, voltages represent molecular concentration or molecular copy-number variables on capacitors; currents represent the production or degradation fluxes of the corresponding molecular variables. For example, Fig. 1 shows how the differential equations underlying transcription and translation at a genetic promoter may be easily represented as an analog circuit [4], [6]. In fact,
although we shall not discuss it here, circuits such as those in Fig. 1 as well as cytomorphic transistor circuits can exactly map stochastic, nonlinear, dynamical differential equations to quantitatively exact noisy analog circuits [4]–[6], [24]–[26]. They can also represent loading and resource consumption automatically via the use of Kirchoff’s current law, or energy or molecular conservation via the use of Kirchoff’s voltage law. For a more extensive and tutorial discussion of how analog circuits can represent molecular biological circuits exactly, and why analog circuits and analog computation is important in biology, we refer the reader to [6].
Fig. 1 shows the traditional biological representation (Fig. 1a), the ordinary differential equations (Fig. 1b) and the analog circuit schematic (Fig. 1c) for the dynamics governing transcription and translation respectively. In this case, the system consists of 4 inputs – activator transcription factor (A), its inducer (Ia), repressor transcription factor (R) and its derepressing inducer (Ir) and 2 state variables – mRNA concentration (M) and protein concentration (P). A and R activates and represses transcription respectively, while inducers Ia and Ir modulate their activities through polymerized or non-polymerized binding that affect certain Hill coefficients. The biological representation, by virtue of being a visual tool, is helpful in guiding our understanding and intuition of the processes. For example, we can quickly determine the overall relationships between inputs and output by following the paths connecting the molecules. In addition, as the Fig. 1 caption shows, quantitative details corresponding to the ODEs such as production and degradation rates, binding, and
dynamics, are transparently represented in the analog-circuit schematic of Fig. 1c. Thus, the analog circuit representation combines the insight afforded by pictures to provide a graphical platform for design while simultaneously representing ODE terms as explicit currents and voltages, which is useful for quantitative analysis.
It is worth mentioning that circuit schematics such as those shown in Fig. 1c can be simulated directly in a circuit simulator, SPICE, which is often embedded in electronic
A
uthor Man
uscr
ipt
A
uthor Man
uscr
ipt
A
uthor Man
uscr
ipt
A
uthor Man
uscr
ipt
computer-aided design (CAD) software (e.g. Cadence). Such software can combine circuit/ODE simulation, hierarchical design, provide libraries of existing ‘differential-equation or circuit parts’, circuit verification, and enable multiple modes of analysis in one holistic graphical tool (transient, steady state, noise, variability, small-signal, parametric, temperature, process variation). The design of complex systems that combine millions of electronic components to create highly complex integrated circuits and printed circuit boards would not be possible without graphical circuit representations.
B. Asymmetric Circuit
In nature, when a stem cell divides, it undergoes either symmetric self-renewal into two stem cells (SS division), symmetric differentiation into two committed daughter cells (CC division), or asymmetric differentiation into a stem cell and a committed daughter cell (SC division) [27], [28]. Since SS or CC division are by themselves sufficient to create a population with any S/C ratio, one may wonder why asymmetric division is necessary at all and seen in nature. We suggest why asymmetric division may provide an advantage over symmetric division in certain circumstances and then exploit this advantage in our first synthetic control circuit.
Suppose stem cells only undergo symmetric division. Any attempt by the cells to correct for changes in the differentiated cell population (C), e.g, due to death or injury, would result in changes in the stem cell population as well either by increasing it via symmetric SS self-renewal or by decreasing it via symmetric CC differentiation. Unless the homeostasis circuit controls the rates of both divisions robustly, there is a risk that stem cells can enter a danger zone of depletion or a danger zone of uncontrolled tumorigenic expansion. In contrast, when a stem cell divides asymmetrically via SC division, it always generates a differentiated daughter cell and another stem cell ensuring that stem cell population numbers are always constant and do not either deplete or grow. Consequently, a homeostasis circuit that exploits asymmetric division can advantageously focus on regulating differentiated cell population only and avoid danger zones by design. An alternative approach is to perform asymmetric division at a population level, wherein every symmetric differentiation of a stem cell is balanced by symmetric self-renewal of a different stem cell. While there are subtle differences between both mechanisms, the general outcome of asymmetric division is that stem cell population is naturally kept constant without the need for complex feedback mechanisms.
A conceptually simple asymmetric control circuit with negative feedback is shown in Fig. 2a and a version with more biological detail is described in Fig. 2b. The caption in Fig. 2 describes the key ideas behind this circuit. A diffusible molecule, AI1, that is secreted by differentiated cells serves as a proxy for their population number and can be easily detected via receptors for AI1 in the cell. In an actual implementation, AI1 could be a native signaling molecule such as growth and differentiation factor 11 (GDF11) or activin [29], [30]; or it could be a non-native signaling molecule such as N-acyl-homoserine lactone, which is derived from bacterial quorum sensing. In either case, a downstream signal, AS, induces the expression of growth arrest factor GAF, which represses the rate of asymmetric division. Depending on the actual signaling molecule used for GAF, there are several ways
A
uthor Man
uscr
ipt
A
uthor Man
uscr
ipt
A
uthor Man
uscr
ipt
A
uthor Man
uscr
ipt
that GAF could affect growth. For example, it could reduce the probability of stem cells entering the differentiation cell cycle, which effectively extends the time that they spend in quiescence [31], thus slowing growth; or GAF could slow stem-cell progression through the cell cycle [32]. On average, the rate of stem cell differentiation is reduced regardless of the actual mechanism behind GAF operation.
In our circuits, we modeled the accumulation and dynamics of AI1 with a Hill equation, which is a saturation function derived from biochemical binding, that depends on the size of differentiated cell population:
dAI1
dt = KpC + KC
d− KdegAI1 (1)
Uptake of AI1 molecules by off-target cells and diffusion of molecules away from the tissue, lead to an effective degradation rate, Kdeg, for AI1.
As with the design of most analog circuits, we characterize the properties of their negative-feedback loops to determine circuit behavior. Negative negative-feedback is known to confer seven significant benefits in circuits [5], [33]. But, feedback loops that are not properly designed can cause oscillations and instability; in our case, in differentiated-cell populations. We can minimize these behaviors by choosing the right set of parameters with the help of root-locus and Bode-plot analysis, two techniques that are commonly used by analog circuit designers to assess feedback circuit behavior, and which we utilize here as well. Interested readers can find a more detailed explanation of such techniques in most analog circuit design textbooks [5], [33].
Traditionally, the stability of a circuit is determined by its eigenvalues: If any eigenvalue contains a real positive value, the circuit is unstable. Root-locus analysis is a graphical tool that illustrates how eigenvalues of a circuit shift on a complex plane when the overall DC loop gain of a feedback loop changes. Loop gain can be understood as the increase in signal strength as it propagates through a feedback loop and returns to its origin [5], [33].
Typically, higher loop gain implies better performance, robustness, speed, and precision at low frequencies but can lead to instability and/or oscillatory dynamics. In the asymmetric homeostasis circuit, a signal passes through 4 stages in cascade to complete a feedback loop, and each stage amplifies the signal according to its DC gain.
DC gain per stage = ∂ ∂X βXn + KdXn n X = Xss Kdeg = Kβn degKd Xssn − 1 Xssn + 12 (2)
A
uthor Man
uscr
ipt
A
uthor Man
uscr
ipt
A
uthor Man
uscr
ipt
A
uthor Man
uscr
ipt
where Xss is the steady-state concentration and Xss= Xss/Kd is the steady-state concentration normalized by the dissociation constant. Equation (2) is valid for small changes around the steady-state concentration.
Equation (2) demonstrates how DC gain can be calculated from the Hill coefficient, dissociation constant, expression level and degradation rate of a binding reaction. Using root-locus analysis (Fig. 3a), we observe that the eigenvalues shift right towards the positive real plane as loop gain increases. If the loop gain reaches a threshold value that moves the eigenvalues across the imaginary axis, our feedback loop becomes unstable. The product of normalized distances between the imaginary axis and the open loop poles along the root locus is, in fact, the gain threshold at which this circuit goes unstable [5], [33]. For example, when all 4 stages of signaling cascade operate on the same timescale of 1, the DC gain threshold is found to be 4 as illustrated in Fig. 3a. In a design where AIS, AS and GAF operate on a timescale that is 10x faster compared to stem cells i.e. the half-lives of the proteins are 10x as short as the half-life of a differentiated cell, the gain threshold for instability increases to 8.9 in the root locus plot (shown in Fig. 3b). Such a strategy for improved stability with higher D.C. gain is analogous to ‘dominant pole compensation’ in analog circuits, one of the primary reasons for why operational-amplifier circuits are usually stable while maintaining good performance at low frequencies [5], [33]. Fig. 3c shows the time-domain responses of the circuit when all 4 components operate on similar time scales (blue), with different feedback loop gains (directly related to the value of the Hill coefficient n = 1, 2, or 3) or with dominant pole compensation (red). Clearly, dominant-pole
compensation maintains relatively precise regulation to the feedback-loop set-point of an input step without causing undesirably large overshoots.
The Bode-plot gain/magnitude and phase response of the feedback loop transmission frequency response shown in Fig. 3d provide useful information for characterizing our feedback loop and provide another useful visual analysis tool. There are two parameters in this Bode plot that are indicative of the circuit’s proximity to instability – the gain and phase margin. Fig. 3d illustrates how both parameters can be measured from the Bode plot and [5] provides further details. In general, both the gain margin and phase margin must be positive and relatively large to ensure that the system is stable, but not excessively large lest they compromise performance in the feedback loop, e.g., accuracy in regulation to an input step set point [5]. We created Bode plots of the asymmetric homeostasis circuit when the half-life of cells is the same as the rest of the circuit, and when the half-life is 10x slower. In the latter case, the magnitude plot started to fall off at a lower frequency, which is characteristic of dominant-pole compensation. Consequently, the phase margin improves from −12.8° to 39.6°, and the gain margin improves from −2.05 dB to 6.8dB drastically improving unstable dynamics to stable dynamics with low overshoot.
A homeostasis circuit that uses asymmetric division only, e.g., the one in Fig. 2, turns out to be relatively simple to design while exemplifying how classical analog circuit techniques can be applied to a biological circuit. However, a key strength of asymmetric division, which is that it keeps stem-cell population naturally constant, can turn out to be a huge weakness: A constant population of stem cells sets an upper limit on the rate at which differentiated
A
uthor Man
uscr
ipt
A
uthor Man
uscr
ipt
A
uthor Man
uscr
ipt
A
uthor Man
uscr
ipt
cells can be replenished; therefore, if the death rate of differentiated cells exceeds the rate at which they can be replenished by a constant stem-cell population, differentiated cells will deplete to catastrophically low numbers or to extinction. A purely asymmetric control circuit is ill-equipped to react to large increases in cell death rate post-transplantation. In addition, since every single stem cell effectively perpetuates indefinitely during asymmetric division, mutations in long-lived stem cells can accumulate and turn the cells cancerous [34]. Thus, asymmetric division alone is insufficient for maintaining optimal differentiated cell population at steady state.
C. Symmetric and Asymmetric Circuit
Despite the benefits of asymmetric division, symmetric division has one huge advantage over asymmetric division: it can regulate stem cell population through SS or CC division. However, as discussed in the previous section, a control circuit that uses only symmetric division runs the risk of either depleting the stem cell population or turning the stem cells cancerous. The control mechanisms need to be robustly designed to avoid these danger zones as we will discuss later in this section. Interestingly, nature has come up with an ingenious solution of using stem-cell niches to induce asymmetric division as a passive control to regulate the ratio of stem cells to differentiated cells [28]. Nevertheless, a synthetic circuit implementation of a niche has to account for the spatial orientation of the niche as well as the number of niche in a tissue, neither of which are easy to design. Instead, it is known that in certain cell lineages, changes in levels of intrinsic signaling mediators such as Polo and Aurora kinases change a stem cell’s propensity for asymmetric or symmetric division [35], [36]. We propose a circuit that exploits both intrinsic and extrinsic cell signaling pathways to control symmetric and asymmetric division and regulate the population of cells.
Fig. 4 shows a probabilistic circuit that controls the growth rate of stem cells (Ggrowth) and the different probabilities of SS, CC and SC division. The figure caption details key ideas behind the control mechanisms in the circuit. Ggrowth is regulated via GAF, affects both asymmetric division and symmetric division, and effects ‘common-mode analog-circuit control’, regardless of the type of division or differentiation. In contrast, PSS, PCC and PSC control the probability that a stem cell differentiates via either SS, CC or SC respectively and effect ‘differential-mode analog-circuit control’.
GAF has a dependence on the product of S and C such that large stem cell or differentiated cell populations upregulate GAF and reduce the overall rate of cell differentiation. This activation of GAF persists until S and C return to healthy levels via cell death or cell differentiation. Consequently, growth regulation ensures that neither population of cells are able to expand uncontrollably. In contrast, low levels of S and C prevent the activation of GAF, thus allowing stem cells to continue to grow and differentiate via SS, CC or SC until S and C return to healthy levels.
While growth regulation is no doubt important, the precise control of the mode of stem cell division, i.e., SS, CC, or SC, produces ideal homeostatic behavior in the presence of disturbances. Since a stem cell can only undergo one of three modes of division, the probabilities of each mode of division, PSS, PCC and PSC sum to 1 in Fig. 4. To produce an
A
uthor Man
uscr
ipt
A
uthor Man
uscr
ipt
A
uthor Man
uscr
ipt
A
uthor Man
uscr
ipt
ideal ratio of stem cells and differentiated cells, our strategy for regulating the probabilities of division must change with changes in S and C. Fig. 4 shows a strategy for such
regulation: If either S or C is low, we upregulate SS division. Such division ensures that both S and C are restored to healthy levels via a stem-cell population increase, which eventually restores C to healthy levels via differentiation, as well. Thus, in Fig. 4 PSS is modeled to be proportional to 1/S+C. If there are sufficient levels of S to prevent the depletion of stem cells and C drops precipitously, stem cells undergo CC division. Thus, in Fig. 4, PCC is modelled to be proportional to S/C. Otherwise, SC division is the default mode of division. In the latter case, S and C are at a good comfortable population size, and aggressive control of either SS or CC division is unnecessary. In Fig. 4, the value of PSC is obtained by subtracting PSS and PCC from 1 using Kirchoff’s current law. At steady state, PSS and PCC will auto regulate via our feedback loop to be equal such that the population of S is stable.
Fig. 5 shows a circuit that combines regulatory loops for growth and for differentiation that could actually be amenable to a practical implementation. Therefore, it includes several additional components to ensure practicality, e.g., the same protein does not hold dual roles of activator and repressor simultaneously. We model the competitive nature of cell division by using signaling molecules that compete for binding sites and affect cell fate accordingly. For example, ASS is a signaling molecule that when bound, activates the pathway for SS division. Likewise, ACC is a signaling molecule that when bound, activates the pathway for CC division. When neither molecule is bound, the cell undergoes SC division, the default mode of division. The caption to Fig. 5 provides more details of circuit operation, which are an instantiation of the core ideas of Fig. 4. Fig. 6 and its associated caption show one possible biological implementation of the circuit. It uses the regulation of transcription to implement the relationships between different circuit components.
We assessed the homeostatic capabilities of the circuit of Fig. 4, 5 and 6 under normal cellular conditions by performing a series of frequency-domain and time-domain analyses that are customary in analog circuits and feedback systems: We first initialized the circuit such that all components are at an operating point near their dissociation constants, which typically maximizes the feedback loop gain. Their normalized concentration value at steady state (concentration/KD) is set to one. The detailed parameters are listed in the S1 Table. To study the transient response of negative-feedback loop, we linearized the circuit about an operating point and applied a step function (an input to the feedback loop that simulates an abrupt cell population growth) to the differentiated cell population. By changing different parameters in the circuit according to (2), we can alter its feedback loop gain. In our case, for simplicity, we chose to increase gain by using larger Hill coefficient values (n in (2)) for the binding characteristics of AIS, AIC, AS, and AC. In general, as (2) shows, gain can be changed by altering production/degradation ratios as well. As they only affect the loop gain, but not the steady state of the circuit, changes in Hill coefficients afford a particularly convenient and simple way of characterizing and studying feedback loops.
Fig. 7 shows how feedback loop-transmission dynamics vary as we increase feedback loop gain. Similar to the asymmetric circuit, as loop gain increases, the feedback
loop-transmission step response exhibits greater ringing behavior. The phase margin of the Bode plot decreases from 180° to 51.8° and 18.7° as loop gain increases from 1 to 3.1 and 6.3
A
uthor Man
uscr
ipt
A
uthor Man
uscr
ipt
A
uthor Man
uscr
ipt
A
uthor Man
uscr
ipt
respectively. Ringing appears when phase margin drops below 45°. However, larger loop gain is also associated with a faster rise time of 15.2 s, 7.53s and 4.56s, and a lower steady-state error of 50%, 25% and 14%, respectively, all of which are desirable characteristics when designing a feedback loop. The analysis points to an inherent trade-off that exist when designing linear time-invariant negative-feedback loops such as we are approximating around an operating point of our nonlinear design. [24]: A high loop gain leads to a fast response and low steady-state error, but it also makes the loop more prone to ringing and oscillatory/unstable behaviors.
To understand why a symmetric-division-only control mechanism is not ideal, we calculated the phase margin for varying levels of asymmetric division relative to symmetric division by changing Ksc. From Fig. 8, we observe that phase margin increases as the proportion of SC division grows, suggesting that asymmetric division reduces the amount of variability of the stem cell population and improves the stability of the differentiated cell population. The improvement in robustness also means that the stem cell population is less likely to ‘accidentally’ deplete from noisy control or to grow uncontrollably.
D. Disturbance Rejection
One of the goals of a homeostatic circuit is to maintain a healthy population of differentiated cells when a tissue is subjected to chronic stress. From a circuit perspective, the increase in death rate is a form of disturbance that we want the circuit to nullify via strong negative feedback. We can test the ability of the circuit to reject disturbances by accelerating the death rate of differentiated cells at multiple time points, and monitoring stem-cell and differentiated-cell population responses. As a control, we first simulated the circuit with accelerated cell death rates in the absence of all negative feedback. Fig. 9 shows that when death rate doubles, the steady state population of differentiated cells halves. When we introduce negative feedback via our circuit, the differentiated cell populations recover to roughly 70% of the healthy state population size. A consequence of larger steady-state population of differentiated cell is the corresponding increase in stem cell population, as shown in Fig. 10 (dotted lines). Since the negative feedback loop in the circuit is designed to increase SS division in the event of low C, the stem cell population increases substantially to support the increased death rate of C. As seen in Fig. 10, when we increase gain from 1 to 3.1, steady state error reduces from 30% to 5%. There are signs of overshoot, which is characteristic of a system with a phase margin below 45°. Increasing the gain further yields a smaller steady state error while producing damped oscillations. These results, once again, illustrate the inherent tradeoff between performance and stability.
There are several strategies from analog feedback circuit design that give us better
performance while minimizing instability. As discussed previously in the asymmetric circuit design of Fig. 2, the slow division of cells relative to the half-life of the other components is a form of dominant-pole compensation, which is also present in the symmetric and
asymmetric circuit design of Fig. 4. However, to improve dynamics further, in this latter circuit design, we also added an incoherent feed-forward loop (IFFL), as shown in Fig. 5 and 11. The addition of the IFFL provides a way to reduce steady-state error without a large increase in loop gain in a manner analogous to the addition of a lead zero in analog circuit
A
uthor Man
uscr
ipt
A
uthor Man
uscr
ipt
A
uthor Man
uscr
ipt
A
uthor Man
uscr
ipt
design: The feed-forward loop works by increasing PSS in proportion with -(dC/dt). The latter derivative is approximated by taking the difference of a relatively fast and relatively slow filtered version of C. In Fig. 11, we use two proteins RFFL and AFFL with different half-lives to obtain these two filtered versions of C. Fig. 11b shows that, with the addition of the IFFL, the steady-state population of differentiated cells improves while simultaneously reducing the amount of ringing. In the Bode plot of Fig. 11c, phase margin increases from 19.3° to 61.3°, while keeping the loop gain relative constant.
E. Parameter Sensitivity and Circuit Robustness
As with most computational models of biological networks, a typical concern is the uncertainty of parameter values used in the model. Ideally, a homeostasis circuit should maintain a healthy population of differentiated cells even when some of the parameters are different from the ones used in its model. Fortunately, one of the benefits of negative feedback control is the reduction of a circuit’s sensitivity to changes in many circuit parameters [5]. Therefore, we were motivated to see if our circuit showed similar robustness under negative feedback.
The sensitivities of various parameters in our circuit design in Fig. 5 and 11 can be obtained by performing sensitivity analysis (SA) with the SA toolbox from MATLAB. We generated many sets of parameters such that the binding affinities of the signaling molecules varied in a random fashion uniformly within a ±10% range of their nominal values. The resulting variation of differentiated cell populations at steady state from their normalized values of 1 can then be tabulated and plotted. In Fig. 12a, we performed robustness analysis on the asymmetric circuit from Fig. 2b. The standard deviation of differentiated cell populations at steady state -increased noticeably as hill coefficient increases, and only starts to decrease when hill coefficient is greater than 2, resulting in an inverted parabola. In other words, the circuit is less robust despite the increase in loop gain from the hill coefficient, but the trend reverses as hill coefficient increases past 2. This behavior is likely due to the hill equation having a smaller slope at low values of n, such that changes to the input at the previous stages are attenuated. As the slope of the hill function increases, the attenuation caused by a flatter hill function starts to diminish while the robustness effects of negative feedback start to dominate, therefore producing the parabolic curve. To test the effects of negative feedback on robustness in the full circuit of Fig. 5, we repeated the robustness analysis as described in Fig. 12b. The standard deviation of normalized populations C reduces from 0.054 to 0.044 when the feedback loop gain is increased. Thus, as in analog electronic circuit design, negative feedback does indeed provide a robustness benefit in our circuit as well. While the robustness analysis described here only surveys the parameters within ±10% range of their nominal values, the circuit is likely to work at other ranges as well so long as the DC operating points of the state variables are close to their respective dissociation constant, which optimizes the DC loop gain for a typical hill function.
III. M
ETHODSAll simulations were performed in MATLAB (Simulink), Release 2016b with a variable-step ODE solver ODE23s. The circuit in Fig. 5 was also simulated in Cadence to demonstrate the
A
uthor Man
uscr
ipt
A
uthor Man
uscr
ipt
A
uthor Man
uscr
ipt
A
uthor Man
uscr
ipt
compatibility of the analog circuit schematic with other popular CAD softwares for
electrical engineers. Simulink and Cadence models of Fig. 5 are available upon request. The ODEs represented by the circuit and parameters used are listed in Table I and II respectively. Bode plots are obtained using Simulink’s Linear Analysis tool and setting the Input
Perturbation and Open-loop Output at the node for C (committed cells).
In our circuit, as in prior design [22], we have made the simplification that stem cells differentiate directly into mature β cells without going through intermediate stages of differentiation. This assumption is accurate only if the intermediate stages of differentiation do not affect the overall negative feedback dynamics significantly [27]. If they do, our design would need to explicitly monitor early intermediate-stage cell population numbers (proxies for our committed cells) that follow a committed path towards β cell differentiation.
IV. CONCLUSIONS
In summary, our results show that the standard techniques and tools of analog electronic feedback circuit design including Bode plots of feedback loop gain and phase; gain margin; phase margin; root-locus analysis with varying loop gain; feedback robustness with loop gain; and, frequency compensation techniques (e.g., dominant-pole compensation or the lead zero and corresponding IFFL circuit) are useful in designing synthetic biological circuits as well. Over almost 100 years, such design techniques have enabled analog circuit designers to build circuits that meet complex specifications [5]. For example, we show that lead
compensation in analog circuits instantiated as an incoherent feed-forward loop in the biological circuit improves stability while simultaneously reducing steady-state tracking error. Our symmetric and asymmetric division scheme also improves phase margin in the feedback loop, and thus improves robustness. Because of the robustness provided by feedback, such designs do not usually require complete and exact knowledge of all circuit parameters. We suggest that the circuit design techniques and strategies that we have outlined in this paper may also prove useful to other biological circuit designers in the future, as demonstrated in our recent design of a synthetic microbial operational amplifier [37].
Acknowledgments
We thank members of the Sarpeshkar group for insightful discussions and critical evaluations of the manuscript. This work was supported in part by NIH R01 Award GM123032 and in part by AFOSR under Grant No. FA9550– 18-1–0467. The work of Jonathan Teo was supported in part by the NSS (PhD) fellowship from the Agency for Science, Technology and Research (A*STAR) and Dartmouth College.
Biography
A
uthor Man
uscr
ipt
A
uthor Man
uscr
ipt
A
uthor Man
uscr
ipt
A
uthor Man
uscr
ipt
Jonathan Teo received the B.A. degree in Physics and Biophysics from Johns Hopkins University in 2012. He is currently working towards his Ph.D. degree in Computational and Systems Biology at the Massachusetts Institute of Technology (MIT). He is a graduate student at the Analog Circuits and Biological Systems group. His research interests include developing a deep quantitative understanding of biological systems in general. He is currently working on applying analog feedback control theory to biological circuit design and analysis, with a focus on stem cell homeostasis and the immune system.
Ron Weiss received B.A. degree from Brandeis University, Waltham, MA, USA and a Ph.D. degree from Massachusetts Institute of Technology (MIT), Cambridge, MA, USA. He is currently a Professor in the Department of Biological Engineering and the Department of Electrical Engineering and Computer Science, and Director of the Synthetic Biology Center at the Massachusetts Institute of Technology.
Rahul Sarpeshkar (M’98–F’18) received B.S. degrees in electrical engineering and physics from the Massachusetts Institute of Technology (MIT), Cambridge, MA, USA, and the Ph.D. degree from the California Institute of Technology, Pasadena, CA, USA. He is currently the Thomas E. Kurtz Professor with Dartmouth College, Hanover, NH, USA, where he is also a Professor of Engineering, Physics, Microbiology and Immunology, and Molecular and Systems Biology. His research creates novel wet DNA-protein circuits in living cells and also advanced dry nanoelectronic circuits on silicon chips. Before joining Dartmouth’s faculty, he was a tenured professor at MIT, leading the analog circuits and biological systems group in the Research Lab of Electronics. Before joining MIT, he was a member of the technical staff of Bell Labs’ division of biological computation in their physics department. His longstanding work on analog and biological computation and his most recent work have helped pioneer the field of analog synthetic biology. His work on a glucose fuel cell for medical implants was featured by Scientific American among 2012’s 10 World Changing Ideas. He holds more than 39 awarded patents and has authored more than 137 publications, including one that was featured on the cover of Nature. His book Ultra Low Power Bioelectronics: Fundamentals, Biomedical Applications, and Bio-Inspired Systems (Cambridge University Press, Cambridge, U.K.) revealed the deep connections between analog transistor circuits and biochemical circuits and founded the field of cytomorphic systems. His group holds several first or best records in analog, bioinspired, synthetic biology, medical device, ultralow power, and energy harvesting systems. His work has applications in implantable medical devices for the deaf, blind, and paralyzed and in
A
uthor Man
uscr
ipt
A
uthor Man
uscr
ipt
A
uthor Man
uscr
ipt
A
uthor Man
uscr
ipt
biotechnology and medical applications that benefit from cellular engineering. Dr. Sarpeshkar received several awards including the NSF Career Award, the ONR Young Investigator Award, and the Packard Fellows Award. He is a Fellow of the IEEE and the National Academy of Inventors.
R
EFERENCES[1]. Di Gregorio A, Bowling S, and Rodriguez TA, “Cell Competition and Its Role in the Regulation of Cell Fitness from Development to Cancer,” Developmental Cell, vol. 38, no. 6 pp. 621–634, 2016. [PubMed: 27676435]
[2]. Deconinck N and Dan B, “Pathophysiology of Duchenne Muscular Dystrophy: Current Hypotheses,” Pediatric Neurology 2007.
[3]. Biteau B, Hochmuth CE, and Jasper H, “Maintaining tissue homeostasis: Dynamic control of somatic stem cell activity,” Cell Stem Cell 2011.
[4]. Sarpeshkar R, “Analog synthetic biology,” Philos. Trans. R. Soc. A Math. Phys. Eng. Sci, vol. 372, no. 2012, pp. 20130110–20130110, 2014.
[5]. Sarpeshkar R, Ultra Low Power Bioelectronics: Fundamentals, Biomedical Applications, and Bio-Inspired Systems, vol. 9780521857 Cambridge: Cambridge University Press, 2010.
[6]. Teo JJY, Woo SS, and Sarpeshkar R, “Synthetic Biology: A Unifying View and Review Using Analog Circuits,” IEEE Trans. Biomed. Circuits Syst, vol. 9, no. 4, pp. 453–474, 2015. [PubMed: 26372648]
[7]. Elowitz MB and Leibler S, “A synthetic oscillatory network of transcriptional regulators,” Nature, vol. 403, no. 6767, pp. 335–338, 1 2000. [PubMed: 10659856]
[8]. Stricker J, Cookson S, Bennett MR, Mather WH, Tsimring LS, and Hasty J, “A fast, robust and tunable synthetic gene oscillator,” Nature, 2008.
[9]. Rezania A et al., “Reversal of diabetes with insulin-producing cells derived in vitro from human pluripotent stem cells,” Nat. Biotechnol, vol. 32, no. 11, pp. 1121–1133, 11 2014. [PubMed: 25211370]
[10]. Russ HA et al., “Controlled induction of human pancreatic progenitors produces functional beta-like cells in vitro,” EMBO J, vol. 34, no. 13, pp. 1759–1772, 7 2015. [PubMed: 25908839] [11]. Pagliuca FW et al., “Generation of Functional Human Pancreatic β Cells In Vitro,” Cell, vol. 159,
no. 2, pp. 428–439, 10 2014. [PubMed: 25303535]
[12]. Lim F and Sun A, “Microencapsulated islets as bioartificial endocrine pancreas,” Science (80-. ), vol. 210, no. 4472, pp. 908–910, 11 1980.
[13]. Veiseh O et al., “Size- and shape-dependent foreign body immune response to materials implanted in rodents and non-human primates,” Nat. Mater, vol. 14, no. 6, pp. 643–651, 6 2015. [PubMed: 25985456]
[14]. Kroon E et al., “Pancreatic endoderm derived from human embryonic stem cells generates glucose-responsive insulin-secreting cells in vivo,” Nat. Biotechnol, vol. 26, no. 1546–1696 (Electronic), pp. 443–52, 4 2008. [PubMed: 18288110]
[15]. Haller MJ, Viener H-L, Wasserfall C, Brusko T, Atkinson MA, and Schatz DA, “Autologous umbilical cord blood infusion for type 1 diabetes,” Exp. Hematol, vol. 36, no. 6, pp. 710–715, 6 2008. [PubMed: 18358588]
[16]. Peterson SE, Garitaonandia I, and Loring JF, “The tumorigenic potential of pluripotent stem cells: What can we do to minimize it?,” BioEssays, vol. 38, pp. S86–S95, 7 2016. [PubMed: 27417126]
[17]. Lee AS, Tang C, Rao MS, Weissman IL, and Wu JC, “Tumorigenicity as a clinical hurdle for pluripotent stem cell therapies,” Nat. Med, vol. 19, no. 8, pp. 998–1004, 8 2013. [PubMed: 23921754]
[18]. Biteau B, Hochmuth C, and Jasper H, “JNK Activity in Somatic Stem Cells Causes Loss of Tissue Homeostasis in the Aging< i> Drosophila Gut,” Cell Stem Cell, vol. 3, no. 4, pp. 442– 455, 10 2008. [PubMed: 18940735]
A
uthor Man
uscr
ipt
A
uthor Man
uscr
ipt
A
uthor Man
uscr
ipt
A
uthor Man
uscr
ipt
[19]. Buchon N, Broderick NA, Poidevin M, Pradervand S, and Lemaitre B, “< i> Drosophila Intestinal Response to Bacterial Infection: Activation of Host Defense and Stem Cell Proliferation,” Cell Host Microbe, vol. 5, no. 2, pp. 200–211, 2 2009. [PubMed: 19218090] [20]. de Visser KE, Eichten A, and Coussens LM, “Paradoxical roles of the immune system during
cancer development,” Nat. Rev. Cancer, vol. 6, no. 1, pp. 24–37, 1 2006. [PubMed: 16397525] [21]. Daniel R, Rubens JR, Sarpeshkar R, and Lu TK, “Synthetic analog computation in living cells.,”
Nature, vol. 497, no. 7451, pp. 619–623, 2013. [PubMed: 23676681]
[22]. Miller M, Hafner M, Sontag E, Davidsohn N, and Subramanian S, “Supporting text for ‘ Modular design of artificial tissue homeostasis : robust control through cellular heterogeneity,’” PLoS Comput. Biol, vol. 8, no. 7, pp. 1–32, 2012. [PubMed: 22629235]
[23]. You L, Cox RS, Weiss R, and Arnold FH, “Programmed population control by cell–cell communication and regulated killing,” Nature, vol. 428, no. 6985, pp. 868–871, 4 2004. [PubMed: 15064770]
[24]. Woo SS, Kim J, and Sarpeshkar R, “A Cytomorphic Chip for Quantitative Modeling of
Fundamental Bio-Molecular Circuits,” IEEE Trans. Biomed. Circuits Syst, vol. 9, no. 4, pp. 527– 542, 8 2015. [PubMed: 26292344]
[25]. Mandal S and Sarpeshkar R, “Circuit models of stochastic genetic networks,” in 2009 IEEE Biomedical Circuits and Systems Conference, 2009, pp. 109–112.
[26]. Mandal S and Sarpeshkar R, “Log-domain circuit models of chemical reactions,” in 2009 IEEE International Symposium on Circuits and Systems, 2009, pp. 2697–2700.
[27]. Rørvik M, Måløy F, Jakobsen P, and Olav B, “Stem cell regulation : Implications when
differentiated cells regulate symmetric stem cell division,” J. Theor. Biol, vol. 380, pp. 203–219, 9 2015. [PubMed: 25997796]
[28]. Simons BD and Clevers H, “Strategies for homeostatic stem cell self-renewal in adult tissues,” Cell, vol. 145, no. 6 pp. 851–862, 2011. [PubMed: 21663791]
[29]. Wu HH et al., “Autoregulation of neurogenesis by GDF11,” Neuron, vol. 37, no. 2, pp. 197–207, 1 2003. [PubMed: 12546816]
[30]. Family GF, Newfeld SJ, Wisotzkey RG, and Kumar S, Molecular Evolution of a Developmental Pathway : Phylogenetic Analyses Genetics, 1999.
[31]. Cheung TH and Rando TA, “Molecular regulation of stem cell quiescence,” Nat. Rev. Mol. Cell Biol, vol. 14, no. 6, pp. 329–340, 5 2013. [PubMed: 23698583]
[32]. Salomoni P and Calegari F, “Cell cycle control of mammalian neural stem cells: putting a speed limit on G1,” Trends Cell Biol, vol. 20, no. 5, pp. 233–243, 5 2010. [PubMed: 20153966] [33]. Clayton George and Winder Steve, Operational Amplifiers Wiley, 2003.
[34]. Knoblich JA, “Asymmetric cell division: recent developments and their implications for tumour biology,” Nat. Rev. Mol. Cell Biol, vol. 11, no. 12, pp. 849–860, 12 2010. [PubMed: 21102610] [35]. Yoo YD and Kwon YT, “Molecular mechanisms controlling asymmetric and symmetric
self-renewal of cancer stem cells,” J. Anal. Sci. Technol, vol. 6, no. 1, p. 28, 2015. [PubMed: 26495157]
[36]. Harandi OF and Ambros VR, “Control of stem cell self-renewal and differentiation by the heterochronic genes and the cellular asymmetry machinery in Caenorhabditis elegans.,” Proc. Natl. Acad. Sci. U. S. A, pp. 287–296, 2015.
[37]. Zeng J, Teo J, Banerjee A, Chapman TW, and Kim J, “A Synthetic Microbial Operational Amplifier,” ACS Synth. Biol, vol. 7, no. 9, 2018.
A
uthor Man
uscr
ipt
A
uthor Man
uscr
ipt
A
uthor Man
uscr
ipt
A
uthor Man
uscr
ipt
Fig. 1.
Genetic promoter circuit. (a) The figure is a graphical representation of a regulated
transcription and translation reaction. A is an activator that is activated by Ia. R is a repressor that is de-repressed by Ir. M represents the mRNA transcript concentration and P represents protein concentration. (b) The ordinary differential equations shown here are one possible instantiation of ODEs that describe the relationships between transcription factors,
transcription rate and translation rate in (a). They use non-linear Michaelis-Menten Kinetics to model the dynamics of transcriptional regulation by A, Ia, R and Ir. (c) A circuit
schematic of (a) that describes the ODEs shown in (b) exactly. The dependent current generators, GM and GP, control production rates of mRNA and protein respectively based on Michaelis-Menten Kinetics while the resistors, RM and RP, control degradation rates of mRNA and protein respectively. The capacitors store state and enable concentration and dynamics to be represented. The multiplier symbols represent biochemical binding between inducers and transcription factors, which generate complexes that alter the transcription rate. General methods and details for how to map biological circuits with associated differential equations such as those in (a) and (b) into mathematically exact electronic-circuit-like schematics including noise, dynamics, and loading such as those in (c) are provided in [1].
A
uthor Man
uscr
ipt
A
uthor Man
uscr
ipt
A
uthor Man
uscr
ipt
A
uthor Man
uscr
ipt
Fig. 2.
Homeostasis circuit using asymmetric division. (a) A circuit abstraction of the regulatory mechanism for C: The dependent current generator, ISC, is downregulated by C, thus forming a feedback loop. (b) A more detailed representation of the negative-feedback loop of (a). Differentiated cells with population number C produce a diffusible small-molecule inducer AI1, which increases activated protein A1, which activates growth-arrest factor (GAF) production, which represses the rate of growth of C. Cells, proteins and small molecules are represented in black, green and purple respectively.
A
uthor Man
uscr
ipt
A
uthor Man
uscr
ipt
A
uthor Man
uscr
ipt
A
uthor Man
uscr
ipt
Fig. 3.
Stability analysis of the asymmetric division circuit of Fig 2. (a) This figure shows a feedback root-locus plot (plot showing motion of eigenvalues as the gain of a feedback loop is changed). In this case, it corresponds to the change in gain of the 4-stage feedback loop of Fig 2 when all time constants are equal in all four stages. The plot shows the critical feedback loop gain at which eigenvalues enter the right half plane and thus cause the loop to become unstable. (b) This figure shows the feedback root-locus plot when a dominantly slow time constant, which is the death rate of the differentiated cells, is used to stabilize the loop of Fig. 2. (c) This figure compares the stability for different circuit gains in the presence and absence of dominant-pole compensation. In the absence of compensation, differentiated cell populations exhibit large overshoots, and oscillations at high gain. Dominant-pole compensation reduces overshoot and oscillation. (d) Bode plots of the feedback loop transmissions with (red corresponding to Fig 3(a)) and without (blue
A
uthor Man
uscr
ipt
A
uthor Man
uscr
ipt
A
uthor Man
uscr
ipt
A
uthor Man
uscr
ipt
corresponding to Fig 3(b)) dominant-pole compensation reveal improved phase margins and gain margins, well-known indicators of improved stability in feedback loops.
A
uthor Man
uscr
ipt
A
uthor Man
uscr
ipt
A
uthor Man
uscr
ipt
A
uthor Man
uscr
ipt
Fig. 4.
Homeostasis circuit using probabilistic symmetric and asymmetric division. The population numbers of the stem cells, S, and the differentiated cells, C are represented by the states of two different capacitors. The growth rate of stem cells during symmetric SS division is represented by current ISS from a negative conductance with a magnitude Ggrowth; Ggrowth is in turn determined by the concentration of GAF, the growth arrest factor. The growth rate of differentiated cells during symmetric CC division is represented by current ICC that both reduces S and increases C with flux ratios of 1:2 respectively. Stem cells probabilistically undergo symmetric SS or CC division, which is represented by the closing of either the PSS or the PCC switches respectively. If stem cells do not undergo division symmetrically, they undergo asymmetric SC division with probability PSC, with PSS + PCC + PSC always adding to 1 automatically in the probabilistic current circuit shown in the top right corner. Since asymmetric SC division does not alter the number of stem cells but only the number of differentiated cells, the growth rate corresponding to SC division adds no current flux to S but only to C as shown on the left. The current flux ISC is also regulated by GAF like other current fluxes and by S. The death of differentiated cells is represented by the conductance Gdeath with death flux Ideath. Homeostasis according to the approximate feedback laws shown in the equations on the bottom right regulate when probabilistic switches are closed to create corresponding current fluxes. The feedback laws ensure that stem cells undergo SS division only if both S and C are relatively low, and undergo CC division only if the ratio of S/C is high enough to make it safe for stem cells to differentiate without danger of depletion. SC division occurs if SS or CC division do not occur. The growth regulating conductance magnitude, Ggrowth, is large only if both stem cell and differentiated cell populations are relatively low.
A
uthor Man
uscr
ipt
A
uthor Man
uscr
ipt
A
uthor Man
uscr
ipt
A
uthor Man
uscr
ipt
Fig. 5.
Circuit schematic of homeostasis control. This figure is a full analog circuit representation of the underlying ODEs that describe the homeostasis control circuit. It is an extension of the probabilistic circuit in Fig. 4, and applies a continuous approximation to the dynamics of stem cell differentiation. Every component of the circuit is a state variable that is represented by a circuit motif made up of a resistor, capacitor and a dependent current generator, just like the genetic promoter circuit in Fig. 1. The division process (black) balances the probability of symmetric and asymmetric divisions such that they sum to 1 as in Fig. 4. The C and S variables represent differentiated and stem-cell population numbers respectively. AIC and AIS are the diffusible molecules that S and C secrete. AIC activates AC and RC, and AIS activates AS, and RS, which activate downstream signaling pathways involving GAF, ACC, and ASS respectively. The effector molecule GAF regulates overall growth, ACC regulates CC division, and ASS regulates SS division. Acc and Ass increase their respective
conductances to regulate differentiation probabilities PSS, PCC and PSC, as represented by the current fluxes. As we discuss further in the text and in Fig. 10, we add an ‘incoherent feedforward loop (box denoted FFL)’ that senses abrupt changes in C to improve the stability, performance, and dynamic behavior of the feedback loop in the homeostasis circuit. The FFL is implemented using RFFL, with slow repression, AFFL with fast
activation, and AFFLOUT, which combines these signals to generate transient control signals at ASdC. ASdC helps regulate ASS such that SS division is enhanced when the death rate of differentiated cells is large.
A
uthor Man
uscr
ipt
A
uthor Man
uscr
ipt
A
uthor Man
uscr
ipt
A
uthor Man
uscr
ipt
Fig. 6.
Biological representation of the homeostatic circuit. This figure is a biological representation of the circuit as shown in Fig. 5. The sensory inputs from the diffusible molecules AIS (red), AIC (green) activate downstream signaling pathways by binding to their respective receptors. Signals are transduced along the pathway using transcriptional and translational regulation to induce the production of ASS and ACC. Depending on the abundance of ASS and ACC, the stem cells undergo either SS, CC or SC division. AIS and AIC are produced constitutively and secreted, such that the concentration of extracellular AIS and AIC are representative of the number of stem cells and differentiated cells.
A
uthor Man
uscr
ipt
A
uthor Man
uscr
ipt
A
uthor Man
uscr
ipt
A
uthor Man
uscr
ipt
Fig. 7.
Step response and Bode plot for the Fig. 5 circuit (without an IFFL). (a) A step input was applied to a linearized model of the circuit. The DC loop gain of the circuit was increased from 1 to 3.1 and 6.3 by raising the Hill coefficient of AIC, AS, AC from 2 to 4 and 6 respectively. This increase in loop gain led to a faster rise time of 15.2 s, 7.53s and 4.56s and a lower steady state error of 50%, 25% and 14%. However, higher loop gain also led to greater overshoot of 16%, 33% and 62.9%, and more ringing behavior. (b) The Bode plot revealed that with increasing loop gain of 1, 3.1 and 6.3, the frequency response had a gain margin of 6.2, 3.5 and 1.6, and a phase margin of 180°, 51.8° and 18.7° respectively. The overall phase shift of 360° between low and high frequencies indicates that the frequency response of the circuit is similar to that of a negative feedback circuit with 4 poles at different locations, with one being dominantly slow.
A
uthor Man
uscr
ipt
A
uthor Man
uscr
ipt
A
uthor Man
uscr
ipt
A
uthor Man
uscr
ipt
Fig. 8.
Phase margin increases with decreasing asymmetric division. The simulation was carried out under the following condition: Hill coefficient of AIC, AS and AC were set to 4 and the death rate of committed cells KDeathC was multiplied by a factor of 1.2. When the ratio of
asymmetric to symmetric division grows via Ksc, phase margin increases, demonstrating the benefits of asymmetric division.
A
uthor Man
uscr
ipt
A
uthor Man
uscr
ipt
A
uthor Man
uscr
ipt
A
uthor Man
uscr
ipt
Fig. 9.
Comparing steady state population of differentiated cells with increasing death rate in the presence and absence of proportional negative feedback control in Fig. 5. Death rate of C is doubled at time = 600, 1000, 1400 and 1800s. In the absence of proportional negative feedback control, the steady state population of C is halved when death rate doubles. The presence of negative feedback increased the steady state population of C, at the expense of creating overshoots.
A
uthor Man
uscr
ipt
A
uthor Man
uscr
ipt
A
uthor Man
uscr
ipt
A
uthor Man
uscr
ipt
Fig. 10.
Increasing feedback loop gain in the circuit of Fig. 5 without an incoherent feedforward loop. The gain of the negative feedback loop is increased from 1 to 3.1 and 8.3 by raising the hill coefficient of AIC, AS, AC from 2 to 4 and 8 in the circuit respectively. Death-rate of C is doubled at 600s, 1000s, 1400s and 1800s. As the loop gain is increased, the steady state population of C (continuous line) drops less with death-rate increases in C. On the other hand, ringing and oscillations become more prominent as loop gain increases, as in most feedback loops. An increase in death rate also prompts the populations of S (dotted line) to expand as a compensatory feedback-loop response.
A
uthor Man
uscr
ipt
A
uthor Man
uscr
ipt
A
uthor Man
uscr
ipt
A
uthor Man
uscr
ipt
Fig. 11.
Cell population response with an incoherent feedforward loop. (a) The probabilistic circuit representation of Fig. 4 is enhanced with an ‘incoherent feed forward loop’ (IFFL) designed to enhance SS division when there is an abrupt increase in the death rate of C (as denoted by the dC/dt regulating Pss). (b) The steady state population of C is higher in the presence of IFFL. Additionally, the transient response exhibits less ringing with the IFFL. This behavior is most clearly observed at time=1000, where a circuit with similar loop gain has
significantly more ringing when the IFFL is absent (blue curves) vs. when it is present (orange curves). (c) This graph is a Bode plot of the loop-transmission frequency response when the differentiated cell death rate is 8x the normal death rate. The phase margin response with and without the incoherent feedforward loop is 61.3° and 19.3° respectively, correlating with the improvement in ringing in Fig. 10 (b).
A
uthor Man
uscr
ipt
A
uthor Man
uscr
ipt
A
uthor Man
uscr
ipt
A
uthor Man
uscr
ipt
Fig. 12.
Robustness analysis. (a) This is a graph of the robustness of the steady state values of C in the asymmetric circuit in Fig. 2b. 1000 different parameter sets of production rates, dissociation constants and degradation rates was used to calculate C for hill coefficient between 0.25 to 3. The standard deviation of C increases with hill coefficient initially and reaches a maximum when n=2. Due to oscillation that sets in when DC loop gain is too high, we did not include results from n>3. (b) This graph is a histogram of the steady states values of C in the symmetric and asymmetric circuit in Fig. 5 for 100 different parameters sets of Kd as listed in S1 Table. The Hill coefficient of AIC, AS and AC is set to 2 for low loop gains and to 4 for high loop gain. These changes result in a larger mean and spread of the
distribution when loop gain is low (0.981±0.054) compared with when loop gain is high (0.989±0.044).
A
uthor Man
uscr
ipt
A
uthor Man
uscr
ipt
A
uthor Man
uscr
ipt
A
uthor Man
uscr
ipt
A
uthor Man
uscr
ipt
A
uthor Man
uscr
ipt
A
uthor Man
uscr
ipt
A
uthor Man
uscr
ipt
TABLE I SYSTEM OF ODES FOR FIG. 5 dAIC dt = KpAICCn + 1Cn − KDegAIcAIC dAIS dt = KpAISSn + 1Sn − KDegAIsAIS dAC dt = KpAC AIC nAIcAICnAIc + 1− KDegACAC dRC
dt = KpRC AIC nAIc
AICnAIc + 1− KDegRCRC dAS dt = KpAS AIS n AISn + 1− KDegASAS dRS dt = KpRS AS n ASn + 1− KDegRSRS dASdC dt = KpASC AFFLOUT n + 1 AFFLOUTn + RS + 1 − KDegASdCASdC dACC dt = KpACC AS n ASn + RC/KDRcn + 1 KDegACCACC dASS dt = KpASS ASdC n + 1 ASdCn + RCn + 1 − KDegASSASS dGAF dt = KpGAF AS nAsACnAc
ASnAsACnAc + ASnAs + ACnAc + 1
− KDegGAFGAF dRFFL dt = KpRFFL AIC n AICn + 1− KDegRFFLRFFL dAFFL dt = KpAFFL AIC n AICn + 1− KDegAFFLAFFL dAFFLOUT dt = KpAFFLOUT AFFL n + 1 AFFLn + RFFLn + 1 − KDegAFFLOUTAFFLOUT Growth = GrowthMax 1
A
uthor Man
uscr
ipt
A
uthor Man
uscr
ipt
A
uthor Man
uscr
ipt
A
uthor Man
uscr
ipt
dSS dt = ASS n ASSn + ACCn + Ksc dCC dt = ACC n ASSn + ACCn + Ksc dSC dt = Ksc ASSn + ACCn + Ksc dS dt = Growth dSSdt −dCCdt dC dt = Growth 2dCCdt +dSCdt − KDeathCCA
uthor Man
uscr
ipt
A
uthor Man
uscr
ipt
A
uthor Man
uscr
ipt
A
uthor Man
uscr
ipt
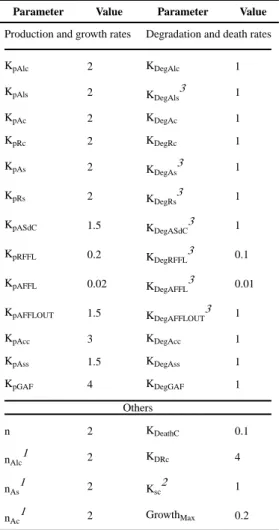
TABLE 2PARAMETER VALUES FOR SYSTEM OF ODES IN TABLE 1
Parameter Value Parameter Value
Production and growth rates Degradation and death rates
KpAlc 2 KDegAlc 1 KpAls 2 KDegAls3 1 KpAc 2 KDegAc 1 KpRc 2 KDegRc 1 KpAs 2 KDegAs3 1 KpRs 2 KDegRs3 1 KpASdC 1.5 KDegASdC3 1 KpRFFL 0.2 KDegRFFL 3 0.1 KpAFFL 0.02 KDegAFFL3 0.01 KpAFFLOUT 1.5 KDegAFFLOUT3 1 KpAcc 3 KDegAcc 1 KpAss 1.5 KDegAss 1 KpGAF 4 KDegGAF 1 Others n 2 KDeathC 0.1 nAlc1 2 KDRc 4 nAs1 2 Ksc2 1 nAc1 2 GrowthMax 0.2 1.
These hill coefficients are raised to 2, 4, 6 or 8 to increase the overall gain of the negative feedback loop. 2.
Ksc controls the rate of asymmetric division relative to symmetric division. 3.