HAL Id: hal-00316695
https://hal.archives-ouvertes.fr/hal-00316695
Submitted on 1 Jan 2000
HAL is a multi-disciplinary open access
archive for the deposit and dissemination of sci-entific research documents, whether they are pub-lished or not. The documents may come from teaching and research institutions in France or abroad, or from public or private research centers.
L’archive ouverte pluridisciplinaire HAL, est destinée au dépôt et à la diffusion de documents scientifiques de niveau recherche, publiés ou non, émanant des établissements d’enseignement et de recherche français ou étrangers, des laboratoires publics ou privés.
MST radars
T. E. van Zandt
To cite this version:
T. E. van Zandt. A brief history of the development of wind-profiling or MST radars. Annales Geophysicae, European Geosciences Union, 2000, 18 (7), pp.740-749. �hal-00316695�
A brief history of the development of wind-pro®ling or MST radars
T. E. Van Zandt
Aeronomy Laboratory, National Oceanic and Atmospheric Administration, Boulder, Colorado 80303, USA Received: 5 November 1999 / Revised: 13 March 2000 / Accepted: 15 March 2000
Abstract. The history of the development of the wind-pro®ling or MST radar technique is reviewed from its inception in the late 1960s to the present. Extensions of the technique by the development of boundary-layer radars and the radio-acoustic sounding system (RASS) technique to measure temperature are documented. Applications are described brie¯y, particularly practical applications to weather forecasting, with data from networks of radars, and scienti®c applications to the study of rapidly varying atmospheric phenomena such as gravity waves and turbulence.
Key words: Meteorology and atmospheric dynamics (instruments and techniques) ± Radio science (remote sensing; instruments and techniques)
1 Discovery of the technique
Wind-pro®ling radars measure the wind by detecting the Doppler shift of echoes from turbulent irregularities of radio refractivity, under the assumption that such irregularities are advected by the wind. Thus, develop-ment of the wind-pro®ling radar technique depended upon recognition that some radar echoes are from turbulence and then on being able to separate the turbulent echoes from other echoes. At long wave-lengths these spurious echoes include echoes from strati®ed gradients of refractivity and at short wave-lengths they are principally echoes from particulates, such as hydrometeors, birds, and insects.
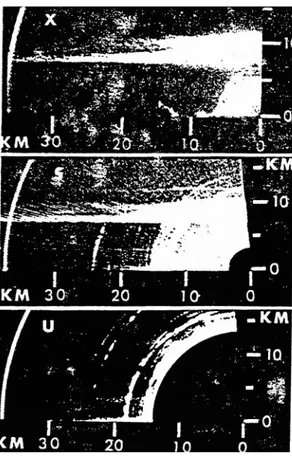
The simultaneous observations by three radars with wavelengths of 3.2, 10.7, and 71.5 cm shown in Fig. 1 (Atlas et al., 1966a, b) were particularly important in showing that turbulent and particulate echoes can be separated by their dierent wavelength dependences. Ideally, turbulent echoes vary with wavelength to the )1/3 power, while particulate echoes vary to the )4
power (Gossard et al., 1998). Thus, the cloud with its base at 7 km was seen by the 3.2 and 10.7 cm radars but not by the 71.5 cm radar, while the turbulent layer at 12 km was seen by the 10.7 and 71.5 cm radars but not by the 3.2 cm radar. (As noted in the ®gure caption, this layer was visible on the original data, but not in the published ®gure).
Following this demonstration, the ®rst published Doppler radar wind measurements in clear air were made independently in 1969 and 1970 by Dobson (1969) and Browning et al. (1973) using large, steerable 10.7-cm radars at Wallops Is., Virginia, and at Deord, England, and by Woodman and GuilleÂn (1974) using a very large 50 MHz (6.0 m) ®xed-beam radar at Jica-marca, Peru. The 10.7-cm radars were used only brie¯y, presumably because of the expense of maintaining such large, steerable antennas, although during their opera-tion they obtained important results on the dynamics of the lower atmosphere up to about 3 km.
The design of the Jicamarca ionospheric radar did not permit detection of echoes from the troposphere, but it could observe in the lower stratosphere and also in the daytime in the mesosphere. Examples of measurements of the vertical and zonal components of the mesospheric wind are shown in the upper and lower panels of Fig. 2. (The ¯uctuations of both components were dominated by a large-amplitude, short-period gravity wave.)
Measurement of the vertical wind is a unique capability of windpro®ling radars. Measurements of shorter-term vertical motions due to gravity waves, convection, fronts (Nastrom et al., 1989), etc., and long-term averages in the tropics (Balsley et al., 1988) have been reported; that is, under conditions when the vertical motions are suciently larger than the system-atic errors due to instrumental (Chau and Balsley, 1998a) and atmospheric (Nastrom and Van Zandt, 1994; Muschinski, 1996) eects.
After the development of wind-pro®ling radars, the assumption that turbulence is advected by the wind was validated by many comparisons between radar and radiosonde winds, although errors of the order of a
meter per second are possible because a radar does not observe all parts of a turbulent layer with equal weight and also because the ¯ow ®eld, especially with respect to vertical motion, is not stationary.
2 Development of dedicated wind-pro®ling radars The success of the Jicamarca observations motivated the development of radars designed speci®cally to measure winds. The ®rst generation of wind-pro®ling radars included the small 40 MHz radar at Sunset, Colorado (Green et al., 1975), the 53.5 MHz SOUSY radar in Germany (Czechowsky et al., 1976), and the 41 MHz radar at Urbana, Illinois (Miller et al., 1978). Figure 3 shows a wind pro®le delineated by Doppler spectra taken at by the Sunset radar during a jet stream. Because these observations were made with 1 km range gates, the spectra are spread by wind shear, particularly at 11 km in the center of a large wind shear. This time-height cross section of meridional winds during passage of a jet stream in Fig. 4 shows the superiority of the radar wind-pro®ling technique over 12-hourly balloon soundings. The Sunset radar could observe only in the troposphere and lower stratosphere, but the more sensitive SOUSY and Urbana radars could observe higher in the strato-sphere and in the mesostrato-sphere.
All of these early, new radars operated in the lower VHF band, from 40 to 54 MHz (7.4 to 5.6 m). The choice of this frequency range was determined by balancing several considerations. First, because the radar cross section of turbulent irregularities of refrac-tive index is very small, a wind-pro®ling radar must have a large power-aperture product. Second, in order to obtain accurate wind velocities, the beam width must be small. Third, contamination by non-turbulent echoes should not be too severe. As the frequency is lowered below about 40 MHz, contamination by ionospheric echoes becomes increasingly more frequent. On the other hand, as the frequency is increased a large power-aperture product becomes expensive and the echoes are increasingly contaminated by particulate echoes, as noted above.
In the VHF band, antennas are relatively cheap per unit area because the geometrical tolerances are rela-tively large, being proportional to the radar wavelength. All VHF wind-pro®ling radar antennas are phased arrays. The early radars could be pointed in only a few,
Fig. 1. RHI (range-height-intensity) scans at 3.2 cm (X band), 10.7 cm (S band), and 71.5 cm (UHF band) wavelengths (top, center, and bottom panels, respectively) at 90° azimuth taken at 1030 EST 18 February 1966 at Wallops Island, Virginia. The layer at 12 km in the bottom panel was visible on the original photographs (from Atlas et al., 1966b)
Fig. 2. Sample time series of vertical (top) and zonal (bottom) wind speeds at 85 km in the mesosphere showing large sinusoidal ¯uctuations due to gravity wave (from Woodman and GuilleÂn, 1974)
typically three, directions or if they could be pointed in more directions, the direction could be changed only slowly. Another reason for choosing a VHF frequency is that in the mesosphere, the scattering from turbulent irregularities is greatly enhanced by D-region electrons during the daytime. Higher-frequency radars cannot normally observe in the mesosphere because turbulent irregularities with scales of the order of their radar wavelengths are strongly attenuated there (Hocking, 1985).
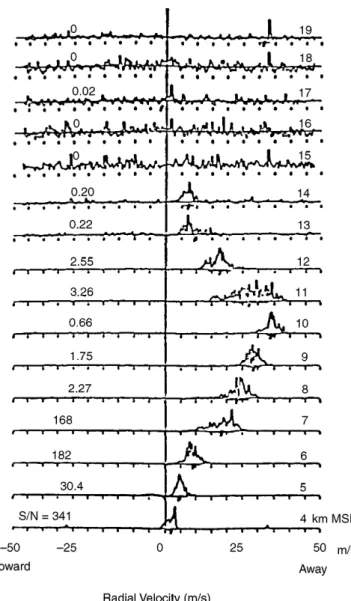
However, even with the most powerful VHF radars, such as the Jicamarca radar, there is normally a gap of echoes in the upper stratosphere and lower mesosphere, as shown in Fig. 5, which can be ®lled only by special observations (Maekawa et al., 1993). The scattering from turbulent irregularities in the neutral stratosphere decreases as the atmospheric density decreases with altitude.
Most of these early wind-pro®ling radars and some present wind-pro®lers operated in a campaign mode. However, as fast, inexpensive computers and signal processors became available in the 1980s, some research radars and all operational radars, which will be discussed later, were designed to operate more-or-less continuously.
Among the several research radars developed in the late 1970s and early 1980s, the Poker Flat radar in
Fig. 3. Radial velocity versus altitude measured by the Sunset radar on 15 April, 1976, at 1606 105°W time, with the beam pointed at 30° to the north (from Van Zandt et al., 1978)
Fig. 4. Time-height cross section of the meridional wind measured by the Sunset radar on 15±16 April 1976 during the passage of a
polar-front jet stream (from Green et al., 1978) Fig. 5. Backscattered power pro®le observed by the 50 MHzJicamarca radar (from Woodman and GuilleÂn, 1974) 742 T. E. Van Zandt: A brief history of the development of wind-pro®ling
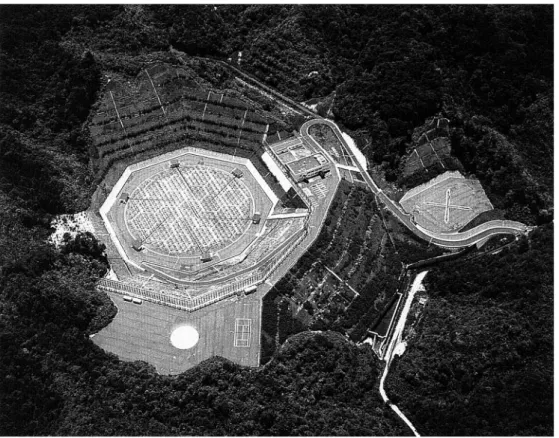
Alaska (Balsley et al., 1980) and the MU radar in Japan (Fukao et al., 1985a, b, 1990) deserve special mention. The 50 MHz (6.0 m) Poker Flat radar, designed to study the mesosphere in the auroral region, had a very large, 200 m ´ 200 m, antenna array. The 46.5 MHz (6.5 m) MU radar was the culmination of the techno-logical development of wind-pro®ling radars. It had an average transmitter power of 50 kW and an antenna 103 m in diameter, shown in Fig. 6, consisting of 475 crossed Yagi elements in 25 groups, so that 1657 beam directions are available within 30° of the zenith. The antenna array and the receiving system are con®gured so that the beam can be changed from pulse to pulse. Thus the radar can observe in up to 255 directions essentially simultaneously. Even now, almost 15 years since its inauguration, the MU radar is still the most sensitive and ¯exible wind-pro®ling radar in the world. Many very important results are continuing to come from its observations.
Other important research radars have been developed in many countries, including Australia (Briggs et al., 1984), Canada (Hocking, 1991; Hocking et al., 1995), France (Crochet, 1989; Bertin et al., 1987; Ney, 1995), India (Rao et al., 1995), Taiwan (Chao et al., 1986), and Wales (Slater et al., 1991). Also, the Trans-Paci®c Pro®ler Network (Gage et al., 1990; Johnston et al., 1997), consisting of several UHF or VHF radars near the equator from Peru to Indonesia, has been estab-lished to study atmospheric dynamics in the equatorial region, including the wind changes during El NinÄo/La NinÄa cycles.
3 Application to operational weather forecasting
After the success of the small Sunset radar it was quickly recognized that wind-pro®ling radars would have oper-ational applications, because they have a much faster cadence of observations than radiosonde balloons. Initially, meteorologists were skeptical of the utility of measuring the wind with radars, partly because of unfamiliarity and partly because the early radars had poor height resolution, but more fundamentally because the radars could not also measure the temperature and humidity pro®les that are essential to weather forecast-ing. In spite of these limitations, within a few years the potential of wind-pro®ling was generally recognized. The series of observations by Ecklund et al. (1979) in Fig. 7 using a 50 MHz radar at Platteville, Colorado, was particularly important in demonstrating the utility of wind-pro®ling radars, because it obtained these frequent wind pro®les in unattended operation. The times of routine radiosonde launches are highlighted, showing that the rapid change centered on 00Z on 8 February was not well-described by the balloons.
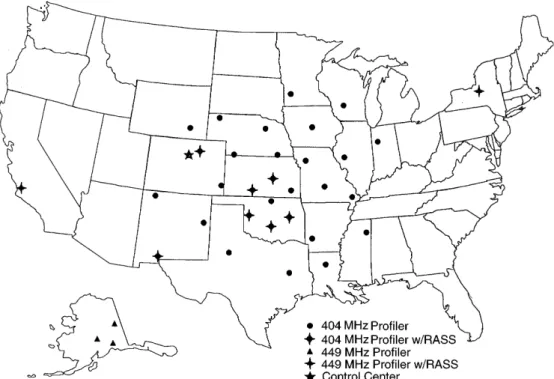
Building on these studies, the NOAA Wave Propa-gation Laboratory (now the Environmental Technology Laboratory) developed the technology for operational windpro®lers, and in the early 1980s deployed the Colorado Wind-Pro®ling Network (Strauch et al., 1984), consisting of ®ve mostly 50 MHz radars. Then in the late 1980s and early 1990s the NOAA Forecast Systems Laboratory and its predecessors developed the Wind Pro®ler Demonstration Network (now the NOAA Pro®ler Network, NPN, (Wuertz et al., 1995; Chadwick and Ackley, 1997), consisting of 32 radars in the
Fig. 6. An aerial view of the MU radar near Shigaraki, Japan
400-MHz range deployed mostly in the central United States, centered in Kansas/Oklahoma, as shown in Fig. 8.
A frequency in the lower UHF range was chosen as a compromise among several considerations. Frequencies in the VHF range are not suitable for operational wind-pro®ling because they cannot easily achieve a height resolution smaller than a few hundred meters and because an operational radio frequency allocation could not be obtained. On the other hand, as the radar frequency is increased, echoes from particulates, parti-cularly hydrometeors, become more frequent.
The mean winds from the NPN are distributed hourly to the United States National Weather Service and incorporated into the NWS numerical model forecasts. Several studies have shown that the NPN data makes a signi®cant improvement in the numerical
forecasts. The NPN data have also been fundamental to many meteorological research projects. Many references to these applications are given in Wuertz et al. (1995).
Networks of operational windpro®ling radars are also being developed in other parts of the world, particularly in Europe under the aegis of COST-76 (Oakley and Nash, 1998).
4 Boundary-layer radars
In order to study the lowest part of the atmosphere, several laboratories have developed specialized bound-ary-layer radars in the UHF band with frequencies ~1 GHz (Ecklund et al., 1988; Hashiguchi et al., 1995; Campistron et al., 1997) and in the S band with frequencies ~3 GHz (wavelength, ~10 cm) (Ecklund
Fig. 7. Hourly-averaged wind pro®les observed by the Platte-ville radar on 7±8 February, 1978. The velocity scale appears be-neath the composite set of pro®les to the left of the main panel. The time of each pro®le is indicated by the dotted line below each pro®le. Darkened pro®les corre-spond to the times of the routine National Weather Service radio-sonde ascents from Denver (from Ecklund et al., 1979)
Fig. 8. The locations of the NOAA Pro®ler Network stations in 1997 (from Chadwick and Ackley, 1997)
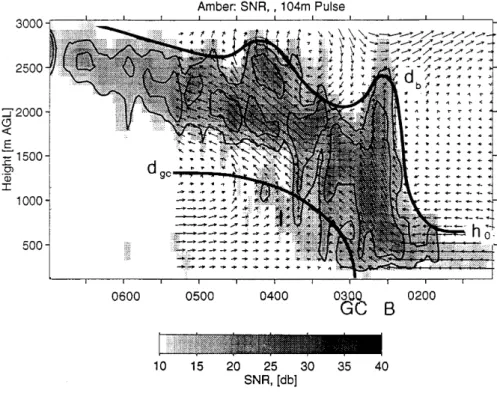
et al., 1999). (It is interesting that the 10-cm radars return to the wavelength of the ®rst wind-pro®ling radars at Wallops Island and Deord, but the present S-band radars have much smaller transmitters and small, ®xed-beam antennas). Because of interference from particulate echoes, these radars often cannot measure the vertical wind and inference of the horizon-tal wind is more dicult (Fukao et al., 1985c). However, researchers have taken advantage of the echoes from hydrometeors to study their microphysics and the development of precipitation, including the raindrop size distribution, which has many scienti®c and practical applications (Wakasugi et al., 1986; Gossard, 1988; Rogers et al., 1993; Gage et al., 1994; Ralph, 1995). A striking demonstration of the power of these boundary-layer radars is shown in Fig. 9, which shows the two-dimensional ¯ow ®eld of a density-current like front (Koch and Clark, 1999).
5 Terminology and extensions of the technique
It is interesting to note the origin of the terms, ``MST radar'' and ``wind-pro®ling radar''. ``MST radar'' was coined at a special workshop in Logan, Utah, in 1977. Because some wind-pro®ling radars could observe only in the troposphere and lower stratosphere, while others could also observe in the mesosphere, it was ®rst suggested that the larger, more sensitive radars be called TSM radars for Troposphere-Stratosphere-Mesosphere, and that the smaller radars be called TS radars. However, this would have lead to confusion with Thomson Scatter radars or with Topside Sounder radars, so W.E. Gordon proposed that the acronyms be reversed to MST and ST. It might seem unlikely that the term TS would be a source of confusion with
Thomson Scatter or Topside Sounder because the contexts are so dierent, but it must be remembered that many of the early practitioners of wind-pro®ling were ionospheric scientists. The term ``wind-pro®ling radar'' or ``wind-pro®ler'' (coined by the Wave Propa-gation Laboratory) is often used to emphasize the operational applications of the technique.
6 Extensions of the technique
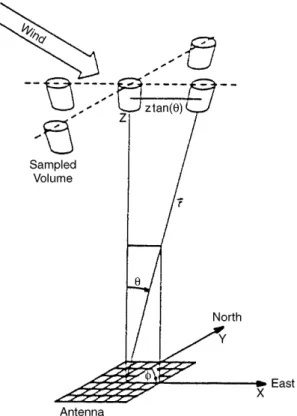
All of the radars discussed so far used the Doppler-Beam-Swinging or DBS technique, in which the east, west, and vertical components of the wind are calculated from the radial wind velocities along at least three non-collinear narrow beams. The method is illustrated in Fig. 10 for a ®ve-beam radar. But the wind can also be measured by observing the radar echoes on at least three spaced antennas and inferring the wind from the speed of propagation of the echo pattern across the ground. This is called the Spaced Antenna (SA) technique. The DBS and SA techniques are described in detail by RoÈttger and Larsen (1990).
Various extensions of the spaced antenna technique have been developed, involving additional hardware and/or more sophisticated data analysis (e.g., Chau and Balsley, 1998b). These techniques can be used to measure not only the horizontal wind, but also the angle of arrival of echoes from tilted surfaces and the vertical and horizontal motion of atmospheric scatter-ers. In spite of their advantages over the DBS technique, such techniques have thus far been used only in research campaigns and not for routine wind pro®ling.
One of the defects of windpro®lers relative to balloons was, as mentioned, their inability to measure
Fig. 9. Two-dimensional ¯ow ®eld relative to motion of the gravity current derived from the Amber, Oklahoma, UHF wind pro®ler for 0100±0515 UTC 17 April, 1991, and signal-to-noise ratio from the vertical beam. For de®nitions of the curves and other notations, see Koch and Clark (1999)
temperature and humidity. The lack of temperature measurements has been remedied at least in part by the Radio Acoustic Sounding System (RASS) technique for measuring temperature pro®les. The development of this technique was greatly stimulated by the success in 1986 in obtaining temperature pro®les up to 20 km using the MU radar. Figure 11 from Matuura et al. (1986) shows excellent agreement between RASS temperature pro®les up to 21 km under light winds and radiosonde temper-ature pro®les from a station about 160 km south.
Measurement of temperature to such great heights was possible because the MU radar beam could be steered to the direction of the echo from the acoustic pulse, which is advected by the wind.
RASS can measure temperature pro®les much more frequently than radiosondes. The pro®les in Fig. 12, also from the MU radar, were taken every 3.6 min, 100 times more frequently than the 6-hourly balloon pro®les shown in the left panel (or 200 times as frequent as routine 12-hourly radiosonde observations) (Arikawa et al., 1998). These pro®les were used to infer frequent pro®les of the Brunt-VaÈisaÈlaÈ frequency and the Rich-ardson number. The MU results lead directly to the application of RASS to research radars and to the addition of RASS to some of the NPN operational radars (May et al., 1990; Chadwick and Ackley, 1997), as shown in Fig. 8. Temperatures from the NPN are reported hourly to the United States National Weather Service along with the winds.
The lack of humidity measurements by wind-pro®l-ing radars may be largely overcome by the development of active remote sensing techniques, which were reviewed by Weckwerth et al. (1999).
7 Further applications
The unique capabilities of the wind-pro®ling radar technique has been applied to a variety of atmospheric problems, including the study of vertical velocity and precipitation.
The rapid cadence of observations of wind pro®les by wind-pro®ling radars has also greatly facilitated the study of rapidly varying atmospheric phenomena such as jet streams, illustrated in Fig. 4, Kelvin-Helmholtz instabilities in the troposphere (Browning et al., 1973) and mesosphere (Klostermeyer and RuÈster, 1981), internal gravity (or buoyancy) waves (Van Zandt et al., 1979), frontal structure (Nastrom et al., 1989; Koch and Clark, 1999), etc.
Fig. 10. Illustration of the Doppler-beam-swinging (DBS) technique for wind measurements with a ®ve-beam radar. The altitude, range, and zenith angle are denoted by z, r, and h, respectively
Fig. 11. Temperature pro®les on 1±3 August, 1985, measured by the MU radar with RASS with three dierent radar zenith angles, compared with the mean temperature from routine Japan Meteorological Agency radiosonde ascents from Shionomisaki, ~157 km to the south (from Matuura et al., 1986)
Since wind-pro®ling radars get most of their echoes from turbulent refractivity ¯uctuations, they can be used to study turbulence. In fact, the radar re¯ectivity is proportional to the turbulence refractivity structure constant C2
n (Atlas et al., 1966c; Ottersten, 1969). With
further analysis, the rate of dissipation of turbulent energy per unit mass, denoted epsilon, can also be inferred, either from C2
n (Gage et al., 1980) or from the
width of the Doppler spectrum (Hocking, 1985; Nastrom and Eaton, 1997).
When the beam of a lower-VHF radar is directed toward the zenith, the echo strength is strongly enhanced by re¯ection from horizontally strati®ed refractivity irregularities. This enhancement decreases with increas-ing zenith angle until it disappears at about 15° from the zenith. This phenomenon has been studied particularly by the MU radar by steering its beam from the zenith to about 20° in small steps (Tsuda et al., 1986).
8 Conclusion
Since the ®rst developments of the wind-pro®ling radar technique 30 years ago, the technique has become a major research instrument not only for measuring wind pro®les, but also for studying a variety of atmospheric dynamical processes. They have also become an impor-tant tool for operational weather forecasting. Thus, the dream of replacing in situ measurements of the principle atmospheric parameters with remote sensing may ®nally be nearing realization.
In summary, the unique capabilities of the wind-pro®ling or MST radar technique include:
1. A cadence of observations much more rapid than balloons
2. Simultaneous and continuous observations of wind, turbulence, and temperature (using RASS) over a large height range at a ®xed location versus time 3. Measurement of vertical wind ¯uctuations
4. Study of precipitation, particular with UHF and higher frequencies
5. Unattended and continuous operation with resulting low operating costs
More detailed discussions of many of the topics mentioned in this brief review can be found in Atlas (1990).
Acknowledgements. I thank Toshitaka Tsuda and Seth Gutman for Figs. 6 and 8.
The Editor in Chief thanks J. Klostermeyer and S. Fukao for their help in evaluating this paper.
References
Arikawa, Y., J. Furumoto, T. Tsuda, and T. Adachi, Fine structure of the tropopause observed with the MU radar/RASS, Extend-ed Abstracts 4th Int. Symp. on Tropospheric Pro®ling: NeExtend-eds and Technologies, Snowmass CO, September 21±25, 1998, 16±18, 1998.
Atlas, D., Ed., Radar in Meteorology, American Meteorological Society, Boston, xvii +806 pp, 1990.
Atlas, D., K. R. Hardy, K. M. Glover, I. Katz, and T. G. Konrad, Tropopause detected by radar, Science, 153, 1110±1112, 1966a. Atlas, D., K. R. Hardy, and T. G. Konrad, Radar detection of the tropopause and clear air turbulence, Preprints, 12th Radar Meteorology Conf., Norman OK, American Meteorological Society, 279±284, 1966b.
Atlas, D., K. R. Hardy, and K. Naito, Optimizing the radar detection of clear air turbulence, J. Appl. Meteorol., 5, 450±460, 1966c.
Balsley, B. B., W. L. Ecklund, D. A. Carter, and P. E. Johnston, The MST radar at Poker Flat, Alaska, Radio Sci., 15, 213±223, 1980. Balsley, B. B., W. L. Ecklund, D. A. Carter, A. C. Riddle, and K. S. Gage, Average vertical motions in the tropical atmosphere observed by a radar wind pro®ler on Pohnpei (7°N latitude, 157°E longitude), J. Atmos. Sci., 45, 39 6405, 1988.
Bertin, F., M. Cremieu, M. Glass, M. Massebeuf, R. Ney, and M. Petitdidier, The PROUST radar: ®rst result, Radio Sci., 22, 51±60, 1987.
Briggs, B. H., B. Candy, W. G. Elford, W. K. Hocking, P. T. May, and R. A. Vincent, The Adelaide VHF radar-capabilities and future plans, Handbook for MAP, 14, 357±359, 1984.
Browning, K. A., J. R. Starr, and A. J. Whyman, The structure of an inversion above a convective boundary layer as observed using high-power pulsed Doppler radar, Bound.-Layer Meteo-rol., 4, 91±111, 1973.
Fig. 12. (Left) temperature pro®les obtained by radiosondes with an interval of six hours. (Right) temperature pro®les obtained by the MU radar with RASS with an interval of 3.6 min (from Arikawa et al., 1998)
Campistron, B., B. Benech, J. Dessens, S. Jacoby-Koaly, E. Dupont, and B. Carissimo, Performance evaluation of a UHF boundary layer radar in raining conditions based on disdrometer mea-surements, Proc. 8th Workshop on Technical and Scienti®c Aspects of MST Radar, Bangalore, India, 334±337, 1997. Chadwick, R. B., and M. H. Ackley, The NOAA pro®ler network:
experiences and plans, Extended Abstracts, COST-76 Pro®ler Workshop, Engelberg, Switzerland, 51±58, 1997.
Chao, J. K., F. S. Kuo, Y. S. Chu, I. J. Fu, J. RoÈttger, and C. H. Liu, The ®rst operation and results of the Chung-Li VHF radar, Handbook for MAP, 20, 359±363, 1986.
Chau, J. L., and B. B. Balsley, A statistical comparison of VHF techniques to study clear-air vertical velocities in the lower atmosphere using the Jicamarca VHF radar, Radio Sci., 33, 1565±1583, 1998a.
Chau, J. L., and B. B. Balsley, A statistical comparison of horizontal winds obtained by a variety of spaced antenna techniques using the Jicamarca VHF radar, Radio Sci., 33, 1669±1683, 1998b.
Crochet, M., Characteristics of Provence radar, Handbook for MAP, 28, 491±492, 1989.
Czechowsky, P., J. Klostermeyer, J. RoÈttger, R. RuÈster, G. Schmidt, and R. F. Woodman, The SOUSY-VHF-radar for tropospheric, stratospheric and mesospheric sounding. Preprints, 17th Radar Meteorology Conf., Seattle WA, American Meteorological Society, 349±353, 1976.
Dobson, E. B., Doppler radar measurements of mean wind variations in the clear atmosphere. Preprints, 14th Radar Meteorology Conf., Tucson AZ, American Meteorological Society, 69±72, 1970.
Ecklund, W. L., D. A. Carter, and B. B. Balsley, Continuous measurement of upper atmospheric winds and turbulence using a VHF Doppler radar: preliminary results, J. Atmos. Terr. Phys., 41, 983±994, 1979.
Ecklund, W. L., D. A. Carter, and B. B. Balsley, A UHF wind pro®ler for the boundary layer: Brief description and initial results, J. Atmos. Ocean. Technol., 5, 432±441, 1988.
Ecklund, W. L., C. R. Williams, P. E. Johnston, and K. S. Gage, A 3-GHz pro®ler for precipitating cloud studies, J. Atmos. Ocean. Technol., 16, 309±322, 1999.
Fukao, S., T. Sato, T. Tsuda, S. Kato, K. Wakasugi, and T. Makahira, The MU radar with an active phased array system: 1. Antenna and power ampli®ers, Radio Sci., 20, 1155± 1168, 1985a.
Fukao, S., K. Wakasugi, T. Sato, S. Morimoto, T. Tsuda, I. Hirota, I. Kimura, and S. Kato, The MU radar with an active phased array system: 2. In-house equipment, Radio Sci., 20, 1169±1176, 1985b.
Fukao, S., T. Tsuda, T. Sato, S. Kato, K. Wakasugi, and T. Makahira, Direct measurement of air and precipitation particle motion by very high frequency Doppler radar, Nature, 316, 712±714, 1985c.
Fukao, S., T. Sato, T. Tsuda, M. Yamamoto, M. D. Yamanaka, and S. Kato, MU radar: new capabilities and system calibrations, Radio Sci., 25, 477±485, 1990.
Gage, K. S., B. B. Balsley, E. L. Ecklund, R. F. Woodman, and S. K. Avery, Wind-pro®ling Doppler radars for tropical atmospheric research, EOS, 50, 1851±1854, 1990.
Gage, K. S., C. R. Williams, and W. L. Ecklund, Application of the 915 MHz pro®ler for diagnosing and classifying tropical precipitating cloud systems, Meteorol. Atmos. Phys., 59, 141± 151, 1994.
Gossard, E. E., Measuring drop-size distributions in clouds with a clear-air-sensing Doppler radar, J. Atmos. Ocean. Technol., 5, 640±649, 1988.
Gossard, E. E., D. E. Wolfe, K. P. Moran, R. A. Paulus, K. D. Anderson, and L. T. Rogers, Measurement of clear-air gradients and turbulence properties with radar wind pro®lers, J. Atmos. Ocean. Technol., 15, 321±342, 1998.
Green, J. L., K. S. Gage, and T. E. Van Zandt, Three dimensional wind observations of a jet stream using a VHF Doppler radar,
Preprints, 18th Radar Meteorology Conf., Atlanta GA, Amer-ican Meteorological Society, 184±189, 1978.
Green, J. L., J. M. Warnock, R. H. Winkler, and T. E. Van Zandt, Studies of winds in the upper troposphere with a sensitive VHF radar, Geophys. Res. Lett., 2, 19±21, 1975.
Hashiguchi, H., S. Fukao, T. Tsuda, M. D. Yamanaka, D. L. Tobing, T. Sribimawati, S. W. B. Harijono, and H. Wiryosum-arto, Observations of the planetary boundary layer over equatorial Indonesia with an L-band clear-air Doppler radar: initial results, Radio Sci., 30, 1043±1054, 1995.
Hocking, W. K., Measurement of turbulent energy dissipation rates in the middle atmosphere by radar techniques: a review, Radio Sci., 20, 1403±1422, 1985.
Hocking, W. K., The University of Western Ontario VHF atmospheric radar, Proc. 6th Workshop on Technical and Scienti®c Aspects of MST Radar, Urbana IL, 349±356, 1991. Hocking, W. K., M. C. Kelley, R. R. Rogers, J.-P. St. Maurice, and
D. Moorcroft, A new VHF atmospheric-ionospheric radar at the EPCO site in Resolute Bay, Canada, VHF atmospheric radar, Proc. 7th Workshop on Technical and Scienti®c Aspects of MST Radar, Hilton Head SC, 454±456, 1995.
Johnston, P. E., S. K. Avery, B. B. Balsley, S. A. Carter, and K. S. Gage, A trans-Paci®c pro®ler network for tropical dynamics and climate research, Preprints, 22nd Conf. on Hurricanes and Tropical Meteorology, Ft. Collins CO, 503± 504, 1997.
Klostermeyer, J., and R. RuÈster, Further study of a jet stream-generated Kelvin-Helmholtz instability, J. Geophys. Res., 86, 6631±6637, 1981.
Koch, S. E., and W. L. Clark, A nonclassical cold front observed during COPS-91: frontal structure and the process of severe storm initiation, J. Atmos. Sci., 56, 2862±2890, 1999.
Maekawa, Y., S. Fukao, M. Yamamoto, M. D. Yamanaka, T. Tsuda, S. Kato, and R. F. Woodman, First observation of the upper stratospheric vertical wind velocities using the Jicamarca VHF radar, Geophys. Res. Lett., 20, 2235±2238, 1993.
Matuura, N., Y. Masuda, H. Inuki, S. Kato, S. Fukao, T. Sato, and T. Tsuda, Radio acoustic measurement of temperature pro®le in the troposphere and stratosphere, Nature, 323, 426±428, 1986.
May, P. T., R. G. Strauch, K. P. Moran, and W. L. Ecklund, Temperature sounding by RASS with wind pro®ler radars: a preliminary study, IEEE Trans. Geosci. Remote Sensing, 28, 19±28, 1990.
Miller, K. L., S. A. Bowhill, K. P. Gibbs, and I. D. Countryman, First measurements of mesospheric vertical velocities by VHF radar at temperate latitudes, Geophys. Res. Lett., 5, 939±942, 1978.
Muschinski, A., Possible eect of Kelvin-Helmholtz instability on VHF radar observations of the mean vertical wind, J. Appl. Meteorol., 35, 2210±2217, 1996.
Nastrom, G. D., and F. E. Eaton, A brief climatology of eddy diusivities over White Sands Missile Range, New Mexico, J. Geophys. Res., 102, 29 819±29 826, 1997.
Nastrom, G. D., M. R. Peterson, J. L. Green, K. S. Gage, and T. E. Van Zandt, Sources of gravity wave activity seen in the vertical velocities observed by the Flatland VHF radar, J. Appl. Meteorol., 29, 783±792, 1989.
Nastrom, G. D., and T. E. Van Zandt, Mean vertical motions seen by radar wind pro®lers, J. Appl. Meteorol., 33, 984±995, 1994. Ney, R., French INSU-METEO research ST radar network:
geographical and technical characteristics, Proc. 7th Workshop on Technical and Scienti®c Aspects of MST Radar, Urbana IL, 461±464, 1995.
Oakley, T., and J. Nash, CWINDE, networking of wind pro®lers in Europe as part of COST 76, Extended Abstracts 4th Intern. Symp. on Tropospheric Pro®ling: Needs and Technologies, Snowmass CO, 237±239, 1998.
Ottersten, H., Atmospheric structure and radar backscattering in clear air, Radio Sci., 4, 1179±1193, 1969.
Ralph, F. M., Using radar-measured radial vertical velocities in rain and snow to distinguish precipitation scattering from clear-air scattering, J. Atmos. Ocean. Technol., 12, 259±267, 1995.
Rao, P. B., A. R. Jain, P. Kishore, P. Balamuralidhar, S. H. Damle, and G. Viswanathan, Indian MST radar: 1. System description and sample wind measurements in ST mode, Radio Sci., 30, 1125±1138, 1995.
Rogers, R. R., W. L. Ecklund, C. A. Carter, K. S. Gage, and S. A. Ethier, Research applications of a boundary-layer wind pro®ler, Bull. Am. Meteorol. Soc., 74, 567±580, 1993.
RoÈttger, J., and M. F. Larsen, UHF/VHF radar techniques for atmospheric research and wind pro®ler applications, in Radar in Meteorology, Ed. D. Atlas, American Meteorological Society, Boston, 235±281, 1990.
Slater, K., A. D. Stevens, S. A. M. Pearmain, D. Eccles, A. J. Hall, R. G. T. Bennett, L. France, G. Roberts, Z. K. Olewicz, and L. Thomas, Overview of the MST radar system at Aberystwyth, Proc. 5th Workshop on Technical and Scienti®c Aspects of MST Radar, Urbana IL, pp 479±482, 1991.
Strauch, R. G., D. A. Merritt, K. P. Moran, K. B. Earnshaw, and D. van de Kamp, The Colorado wind-pro®ling network, J. Atmos. Ocean. Technol., 1, 37±49, 1984.
Tsuda, T., T. Sato, K. Hirose, S. Fukao, and S. Kato, MU radar observations of the aspect sensitivity of backscattered VHF echo power in the troposphere and lower stratosphere, Radio Sci., 21, 971±980.
Van Zandt, T. E., J. L. Green, K. S. Gage, and W. L. Clark, Vertical pro®les of refractivity turbulence structure constant: comparison of observations by the Sunset radar with a new theoretical model, Radio Sci., 13, 819±829, 1978.
Wakasugi, K, A. Mizutani, M. Matsuo, S. Fukao, and S. Kato, A direct method for deriving drop-size distribution and vertical air velocities from VHF Doppler radar spectra, J. Atmos. Ocean. Technol., 3, 623±629, 1986.
Weckwerth, T. M., V. Wulfmeyer, R. M. Wakimoto, R. M. Hardesty, J. W. Wilson, and R. M. Banta, NCAR-NOAA lower-tropospheric water vapor workshop, Bull. Am. Meteorol. Soc., 80, 2339±2357, 1999.
Woodman, R. F., and A. GuilleÂn, Radar observations of winds and turbulence in the stratosphere and mesosphere, J. Atmos. Sci., 31, 493±505, 1994.
Wuertz, D. B., D. E. Wolfe, B. L. Weber, and R. B. Chadwick, NOAA's Wind Pro®ler Demonstration Network: an overview of applications and impact on research, NOAA Technical Memorandum ERL ETL-249, February 1995.