HAL Id: hal-00296983
https://hal.archives-ouvertes.fr/hal-00296983
Submitted on 26 Apr 2007
HAL is a multi-disciplinary open access
archive for the deposit and dissemination of
sci-entific research documents, whether they are
pub-lished or not. The documents may come from
teaching and research institutions in France or
abroad, or from public or private research centers.
L’archive ouverte pluridisciplinaire HAL, est
destinée au dépôt et à la diffusion de documents
scientifiques de niveau recherche, publiés ou non,
émanant des établissements d’enseignement et de
recherche français ou étrangers, des laboratoires
publics ou privés.
Measurement of solid precipitation with an optical
disdrometer
G. E. Lempio, K. Bumke, A. Macke
To cite this version:
G. E. Lempio, K. Bumke, A. Macke. Measurement of solid precipitation with an optical disdrometer.
Advances in Geosciences, European Geosciences Union, 2007, 10, pp.91-97. �hal-00296983�
www.adv-geosci.net/10/91/2007/ © Author(s) 2007. This work is licensed under a Creative Commons License.
Geosciences
Measurement of solid precipitation with an optical disdrometer
G. E. Lempio, K. Bumke, and A. Macke
Leibniz Institute of Marine Sciences (IFM-GEOMAR), Kiel, Germany
Received: 21 July 2006 – Revised: 9 January 2007 – Accepted: 15 February 2007 – Published: 26 April 2007
Abstract. A study about measurements of solid
precipita-tion using an optical disdrometer is presented. The optical disdrometer is an improved version of the ODM 470 dis-drometer. It allows to measure hydrometeors within a size range of 0.4 to 22 mm in diameter.
The main advantage of this instrument is its ability to esti-mate accurately precipitation even under strong wind condi-tions (Großklaus, 1996). To measure solid precipitation a ge-ometrical model was developed to determine the mean cross-sectional area of snow crystals for different predefined shapes and sizes. It serves to develop an algorithm, which relates the mean cross sectional area of snow crystals to their max-imum dimension, liquid water content, and terminal veloc-ity. The algorithm was applied to disdrometer measurements during winter 1999/2000 in Uppsala/Sweden. Resulting pre-cipitation was compared to independent measurements of a Geonor gauge and to manual measurements. In terms of daily precipitation the disdrometer shows a reliable perfor-mance.
1 Introduction
Snow plays an important role in the hydrological cycle and in the global energy budget. Several studies have been car-ried out to measure precipitation rate and size distribution of solid precipitation (Lundberg and Halldin, 2001; Hanesch, 1999). The main problem in measuring snow arises from wind induced flow distortion (Yang et al., 1999), yielding er-rors exceeding 100% in terms of precipitation rates at wind speeds of 10 m/s. The introduction of precipitation radars has strengthened the interest in using disdrometers because such remote sensing techniques need to be calibrated in terms of relations between reflectivity Z and precipitation rate R,
Correspondence to: K. Bumke
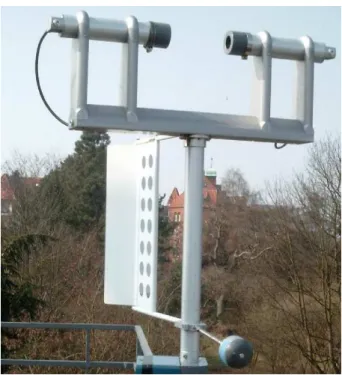
the so called ZR-relation. A recent study, focused on liq-uid precipitation, has shown the advantage of the optical dis-drometer ODM 470 (Fig. 1) to measure precipitation even under strong wind conditions compared to the well known Joss Waldvogel-disdrometer (Bumke et al, 2004).
Therefore, it seems promising to use this kind of disdrom-eter also for measurements of solid precipitation. However, some specific questions need to be addressed. Since rain drops have a nearly spherical shape and a constant density, their liquid water content, fall velocity, and thus rain-rate can be easily parameterized from their cross sectional areas mea-sured by the disdrometer. In case of solid precipitation par-ticles with varying complex shapes a relation between ob-served geometrical cross section and snow rate is not imme-diately available. Different snow crystals with identical max-imum dimension have different fall velocities and different equivalent liquid water contents. Furthermore, the disdrome-ter measures a cross sectional area depending on size, shape, and orientation of the snow crystals.
Therefore, a unique snow rate retrieval scheme cannot be expected. The aim of this paper is to investigate the role of snow crystal geometries on the ability of the optical disdrom-eter ODM 470 to measure solid precipitation.
Section 2 describes the disdrometer and explains how to evaluate precipitation from measurements. Section 3 gives details of the geometrical model to derive cross sectional ar-eas as observed by the disdrometer for several types of snow crystals. Based on resulting relations between cross sectional areas and maximum sizes of snow crystals a new algorithm has been developed and tested. This algorithm is applied to data of a measurement campaign from winter 1999/2000 in Uppsala Sweden as explained in Section 4 followed by con-clusions.
92 G. E. Lempio et al.: Measurement of solid precipitation with an optical disdrometer
Fig. 1. The optical disdrometer ODM 470.
2 The disdrometer
2.1 Technical realisation
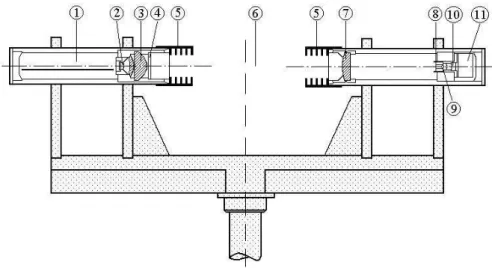
The principle of the present disdrometer is light extinction of precipitation particles passing through a cylindrical sen-sitive volume of 120 mm length and 22 mm diameter. The electronic signal caused by a particle is proportional to its cross-sectional area. The sensitive volume is kept perpendic-ular to the local flow direction by aid of a wind vane. The cylindrical form makes the measurement independent from the incidence angle of the particles. Local up- and down-drafts do not influence the measurements. The light source of the ODM 470 is a 150 mW IR-LED (Infra Red Light Emit-ting Diode), emitEmit-ting light at 880 nm wavelength. In order to achieve a homogeneously illuminated sensitive volume, col-lector lenses and an optical blend are used (Fig. 2). This disdrometer simultaneously measures the size of the cross-sectional area and the time of flight of the particles through the volume. The detectable size range covers particles from 0.4 to 22 mm in diameter. Because of this small size range effects like coincidences (more particles at the same time within the sensitive volume) and edge-effects (partly scanned particles) are likely. These effects are already considered for raindrops and need to be addressed for snowflakes in future work.
2.2 Evaluation of the precipitation rate
From the available information, the particle-size distribution density n(bin) can be calculated either by evaluation of the residence time (ti) of the particles (Eq. 1) or by particle counting knowing the local wind (Eq. 2). Experience in mea-suring rain shows that using the counted particles (N (bin)) combined with the measured wind (ff ) leads to improved results (Clemens , 2002). n(bin) = 1 V · T X i ti(bin) (1) n(bin) = N(bin) L · D · T ·pff2+(v ∞(bin))2 (2)
The remaining variables in Eq. (1) and Eq. (2) are the mea-suring time interval (T ), the terminal velocity of the particles (v∞(bin)), the number of the size-bin (bin), the length (L) and the diameter (D) of the sensitive Volume (V ). The opti-cal disdrometer divides the measurements into 129 size-bins with a logarithmic increasing size to improve resolution at smaller particle sizes.
Precipitation rates (R) in kg/m2h or mm/h can be deter-mined from the particle-size distribution density by assum-ing liquid water content or mass m and terminal fall velocity of the particles depending on their size (Eq. 3).
R =3600 ·
128 X
bin=0
n(bin) · v∞(bin) · m(bin) (3)
Therefore mass and terminal fall velocity have to be known to obtain reliable precipitation measurements.
3 Model study of mean shadow areas of snow crystals
Hogan (1994) provides relationships for mass and terminal fall velocity of different ice crystal types depending on their maximum dimension (Dmax), which were derived from
mea-surements of single particles, classified in the same way as in Magono and Lee (1966).
Instead of the maximum dimension the disdrometer mea-sures the shadow area which is generated by the cross-sectional area perpendicular to the optical axis of the instru-ment. It determines the diameter Dbinof a sphere with same
area (Fig. 3). The disdrometer is not able to measure the maximum dimension of non-spherical particles. In order to use the parameterisations of Hogan (1994) it is necessary to assume that ice crystals fall randomly oriented through the sensitive volume. Hence, a large amount of randomly ori-ented crystals of the same type and size have a repeatable mean cross-sectional area. This allows to develop a trans-formation function, to derive the maximum dimension of a certain crystal type from the measured cross-sectional area.
For randomly oriented ice crystals of the same type an im-plementation of the transformation function of this crystal
Fig. 2. Cross-section of the optical disdrometer ODM 470. From left to right: electronics (1), light emitting diode (2), lens system (3),
window (4), baffles (5), sensitive volume (6), achromatic collector lens (7), optical blend (8), ocular (9), photo diode (10), electronics compartment (11).
type into the calculation of its liquid water content and ter-minal fall velocity provided from Hogan (1994) will result in a reliable precipitation rate.
However, the disdrometer cannot identify the type of a particle or of an aggregate of single snow crystals. Hence, the following study can be regarded as a simple theoretical experiment to infer the sensitivity of the ODM 470 on the assumed particle geometry and to get an idea to solve the problem of how to calculate the precipitation rate from mea-surements of solid precipitation with the optical disdrometer. A geometrical model based on the IDL ice crystal visu-alisation code by Macke et al. (1998) has been developed to simulate different snow crystal types (Fig. 4) and to deter-mine the mean cross-sectional area out of 3000 randomly ori-ented projections for different sizes. The shape of the crys-tals was constructed from the graphics in Magono and Lee (1966). Their thickness is nonlinearly size depended and was determined from the aspect ratio relations of Auer and Veal (1970).
The choice to the six simulated ice crystals was mainly de-termined by the available information of fall velocity, mass and thickness for different maximum diameters and the high variable shapes. It would be also interesting to consider nee-dles in this study but the required information is not available for this crystal type.
For each simulated crystal type the diameter (Dbin) of its
mean cross-sectional area is plotted against its maximum di-mension (Fig. 5, squares) within the size range where the specific crystal type was observed. Linear regressions have been performed (Fig. 5, colored lines) and their coefficients yield the transformation functions.
Fig. 3. Dmaxand from disdrometer measured Dbinfor one orienta-tion of Crystal P1d. Dbinalters when the crystal orientation will be changed.
Applying Eq. (3) with a monodisperse particle-size dis-tribution density to each measurable size of every simulated crystal yields the precipitation rates depicted in Fig. 6a. Us-ing the transformation functions to convert Dbinto the
max-imum dimension of each crystal before determine liquid wa-ter content and fall velocity results in precipitation rates as shown in Fig. 6b.
Due to the nearly spherical shape of “Lump Graupel” (R4B from Magono and Lee (1966)) no transformation
94 G. E. Lempio et al.: Measurement of solid precipitation with an optical disdrometer
Fig. 4. Simulated ice crystals.
Fig. 5. Transformation functions for 6 different crystal types.
function from cross-sectional area to maximum dimension is required for this crystal type and its graphs in Fig. 6a and b are identical.
As expected the precipitation rates of the simulated crys-tals without transformation of the diameters (Fig. 6a) are much lower than the precipitation rates determined with an implementation of the transformation functions (Fig. 6b). Surprising, precipitation rates estimated by using transfor-mation of diameters are close to the precipitation rate derived by using parameterisations of “Lump Graupel” (Fig. 6b).
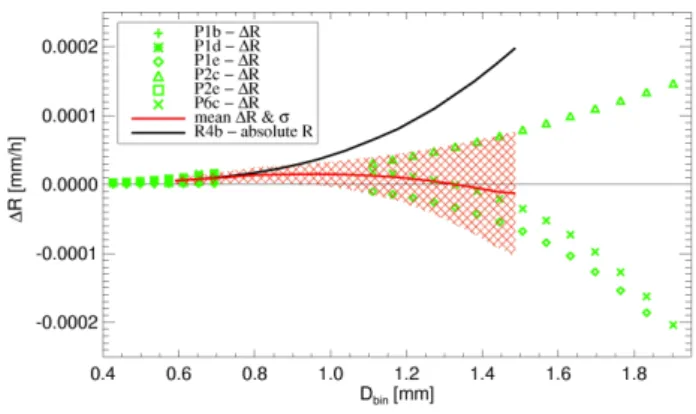
A more detailed investigation of the differences between the precipitation rates of “Lump Graupel” and the simulated crystals by using transformation of diameters is shown in Fig. 7. Here, the running mean and its standard deviation of a combination of precipitation rate differences of all simulated crystal types to “Lump Graupel” were calculated.
Due to the fact that only values within the observed size range of certain ice crystal types were considered (squares in Fig. 5) there are not more than 6 values of precipitation rate differences per scanned size. To get at least 40 data points of precipitation differences for the calculation of running mean
Fig. 6. Simulated precipitation rates with n(bin)=1 for simulated
crystal types and “Lump Graupel” (R4b, Magono and Lee (1966)),
(A): without applying the transformations to the diameters of the
mean cross-sectional areas, (B): including transformation of diame-ters before determine mass and fall velocity. The results were plot-ted in the defined size range of the crystals.
Fig. 7. Running mean and standard deviation of the R-differences
between “Lump Graupel”-R4b and all simulated crystal types.
and standard deviation adjacent bins were merged into inter-vals. The differences according to the interval with the small-est size ranges and the interval with the largsmall-est size ranges are shown as green symbols. For a comparison the absolute value of the precipitation rate of “Lump Graupel” is plotted as black line. The running mean of the differences (red line) remains close to the zero line.
With respect to the standard deviation of the interval with the largest bins the precipitation rate derived from the “Lump Graupel” parameterisation yields an uncertainty of less than 40% to the precipitation rates of all simulated crystal types by using transformation functions from cross-sectional area to maximum dimension.
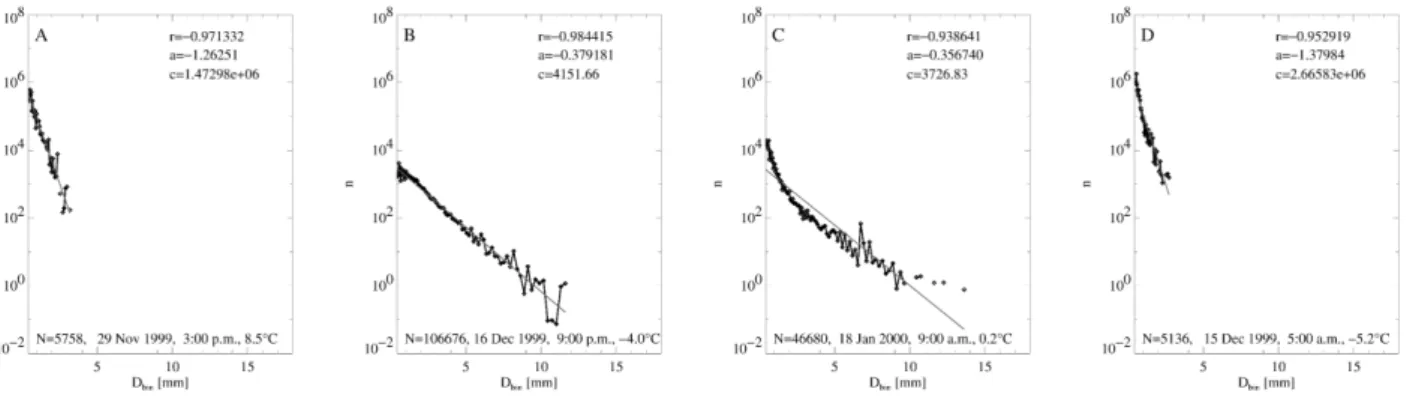
Fig. 8. Comparison of different precipitation spectra (1 h integration time). (A) rain spectrum, (B) snow spectrum, (C) sleet spectrum, (D)
snow spectrum.
N (bin) – number of counted particles per bin, 1Dbin(bin) – size of bin, R – precipitation rate of the entire spectrum, r – correlation coefficient, a – slope of linear regression line, c – zero-crossing, N – number of particles per spectrum.
Given the preconditions of the present theoretical exper-iment, it follows that the products of terminal velocity and liquid water content as a function of the cross sectional area of different types of snow crystals are in the same order of magnitude and allow to use one common parameterization, in this case the parameterization of “Lump Graupel”.
4 The data analysis
As a first test of this hypothesis the parameterization of “Lump Graupel” has been applied to disdrometer measure-ments from winter 1999/2000. The disdrometer was installed at the Meteorologisk Institut Uppsala/Sweden. A Geonor gauge was situated close to it and during the disdrometer measurements most of the time manual measurements were taken.
Caused by technical problems the Geonor data are incor-rect on some days but mostly the data agree with the man-ually measured precipitation indicating that the Geonor had worked well at these specific days. Additionally, the temper-ature from the measuring station and synoptical data from the airport about 20 km away from the station were considered to identify the type of precipitation.
4.1 Precipitation phase identification considering size spectra
Most important for the calculation of the precipitation rate from disdrometer data is the precipitation phase. The shape of the size spectra might be useful to identify rain, snow or sleet.
Therefore, with an integration time of one hour, the num-ber of counted particles per bin were normalised with the size of their bin and the precipitation rate of the entire spec-trum calculated with the parameterisation of “Lump Grau-pel” (Fig. 8).
In Fig. 8a a typical rain spectrum is shown, the slope of the linear regression is steep (a=−1.26), the absolute value of the correlation coefficient is larger than 0.97 and the max-imum measured particle size is smaller than 5 mm.
Figure 8b shows a typical snow spectrum. The slope of the linear regression is flat (a=−0.38), the absolute value of the correlation coefficient is larger than 0.98 and the maximum measured particle size is larger than 11 mm.
Figure 8c shows a typical sleet spectrum. The slope of the linear regression is almost the same as the slope of the snow spectrum but the absolute value of the correlation coefficient is noticeably smaller. The most interesting point in the sleet spectrum is the increasing slope at particle sizes smaller than 2 mm, which may result from a mixture of two populations, for example snow and rain. The slope of a snow spectrum can also be very steep as seen in Fig. 8d. In this case the maximum measured particle size is smaller than 4 mm and the temperature is lower than −5.2◦C.
Hence, it could be possible to infer the type of precipita-tion from the regression slope and the correlaprecipita-tion coefficient in combination with the temperature. To validate this hypoth-esis additional measurements together with comprehensive synoptic observations have to be performed in future.
4.2 Solid precipitation rate results
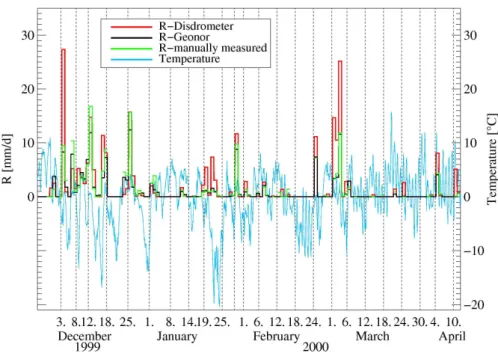
The daily accumulated precipitation sums during the mea-suring period of the disdrometer, the Geonor and the manual measurements are shown in Fig. 9. The integration time was from 6 a.m. at the present day to 6 a.m. of the next day. The temperature (blue line) is shown with a time resolution of 10 min.
To identify the type of precipitation the synoptical information was used, because the method to estimate precipitation type from precipitation spectra (Sect. 4.1) was
96 G. E. Lempio et al.: Measurement of solid precipitation with an optical disdrometer
Fig. 9. Daily precipitation from disdrometer, Geonor and manual measurements in comparison to the temperature with a time resolution of
10 min.
Fig. 10. Comparison of daily disdrometer and manual measure-ments.
gained from the present data set and has not been sufficiently tested against independent data yet.
It is recognizable that on many days with high amounts of precipitation the disdrometer indicates more precipitation than the other methods. In particular at the 3 December and the 1, 2 and 3 March the overestimation of precipitation by the disdrometer exceeds more than 100%. Besides the er-rors by indicating the phase of precipitation and the here not answered question if the above theoretical experiments pre-conditions are generally valid for all winterly precipitation
events, two other factors could be accountable for this over-estimation.
Firstly, the disdrometer measures also under strong wind conditions without underestimating the precipitation rate caused by the wind induced flow distortion. Secondly, the pa-rameterisation of “Lump Graupel” for the liquid water con-tent and the terminal fall velocity fits only particles within a size range from 0.4 mm up to 9 mm (Hogan, 1994). Dur-ing the analyzed period there have been several precipitation events with observed particles with a cross-sectional area of more than 9 mm in diameter. Snowflakes can reach maxi-mum dimensions of up to 30 mm under average snow condi-tions or in extreme events even more (Lawson et al., 1998).
Giant Snowflakes cause cross-sectional areas of up to 22 mm in diameter. Hogan’s parameterisation of “Lump Graupel” is not valid to determine the liquid water content and the terminal fall velocity of such large measured solid precipitation particles (Hogan, 1994). An adjustment of the parameterisation for large particles is needed. As a first at-tempt to calculate precipitation rates from the presented data set the parameterisation of “Lump Graupel” was extrapolated for measurements larger as 9 mm.
On some days with large amounts of precipitation the agreement of disdrometer measurements with the other methods is satisfactory, e.g. at 25 December, 1 January, 11 January, 1 February and 7 February. A more detailed in-vestigation of the differences between the daily precipitation of the disdrometer and the manual measurements is given in Fig. 10. A normal and inverse linear regression (red lines)
and the mean regression (blue line) were made. A number of 56 events were considered. The correlation coefficient is r=0.794. The mean regression shows that at events with more than 1 mm/d precipitation the disdrometer indicates more than the manual measurements and at events with less than 1 mm/d the manual measurements are larger than the disdrometer measurements. The large scatter in Fig. 10 is partly explained by the varying conditions of type of precip-itation, wind speed and temperature. Because of the limited number of observations it was not possible to differentiate these conditions in the present comparison.
5 Conclusions
The present sensitivity study concerning the transforma-tion between the maximum dimension and the mean cross-sectional area of snow crystals is based on a theoretical ex-periment considering six exemplary snow crystal types. Un-der these preconditions it is shown that only one parameteri-sation of terminal fall velocity and liquid water content is re-quired to calculate the precipitation rate from measurements of the optical disdrometer ODM 470.
In a first attempt the algorithm was applied to solid precipi-tation measurements from winter 1999/2000 in Uppsala. The results indicate a general overestimation of precipitation rates from disdrometer measurements compared to other methods. Future validation and improvements of the algorithm shall include:
– Validation of “Lump Graupel” parameterisation for
par-ticle sizes beyond 9 mm in diameter, if necessary ad-justed also for different winterly precipitation events,
– More measurements for a statistically relevant
evalua-tion of the method,
– Further comparisons with relevant instruments like
video- disdrometers, particle mass measurements, etc., Precipitation phase may be identified in real time via spec-trum shapes. Applying the algorithm to solid precipitation then yields an unique system: an instrument based on a sim-ple hardware princisim-ple is enabled to solve a comsim-plex mea-surement task (water equivalent of solid precip), which is urgently needed in a wide field of applications like remote sensing etc.
Acknowledgements. The authors thank A.-S. Smedman and H. Bergstr¨om for the possibility to perform disdrometer measurements in Uppsala/Sweden at the Meteorologisk Institut and for making their measurements available to us. The authors thank their colleagues for continuing support and discussion around the coffee breaks.
Edited by: S. C. Michaelides and E. Amitai Reviewed by: anonymous referees
References
Auer Jr., A. H. and Veal, D. L.: The Dimension of Ice Crystals in Natural Clouds, J. Atmos. Sci., 27, 919–926, 1970.
Bumke, K., Clemens, M., Grassl, H., Pang, S., Peters, G., Seltmann, J. E. E., Siebenborn, T., and Wagner, A.: Accurate areal precip-itation measurements over land and sea (APOLAS), BALTEX Newsletter, Nr. 6, 9–13, 2004.
Clemens, M.: Machbarkeitsstudie zur r¨aumlichen Niederschlags-analyse aus Schiffsmessungen ¨uber der Ostsee, IfM-Geomar, Kiel/Germany, Dissertation, 2002.
Großklaus, M.: Niederschlagsmessung auf dem Ozean von fahren-den Schiffen, IfM-Geomar, Kiel/Germany, Dissertation, 1996. Hanesch, M.: Fall Velocity and Shape of Snowflakes,
Disserta-tion submitted to Swiss Federal Institute of Technology (ETH) Z¨urich, 1999.
Hogan, A. W.: Objective Estimates of Airborne Snow Properties, J. Atmos. Oceanic Technol., 11, 432–444, 1994.
Lawson, R. P., Steward, R. E., and Angus, L. J.: Observations and numerical simulations of the origin and development of very large snowflakes, J. Atmos. Sci., 55, 3209–3229, 1998. Lundberg, A. and Halldin, S.: Snow measurements techniques for
land-surface-atmosphere exchange studies in boreal landscapes, Theor. Appl. Climatol., 70, 215–230, 2001.
Macke, A., Francis, P. N., Mc Farquhar, G. M., and Kinne, S.: The role of ice particle shapes and size distributions in the single scat-tering properties of cirrus clouds, J. Atmos. Sci., 55, 17, 2874– 2883, 1998.
Magono, C. and Lee, C. W.: Meteorological classification of natural snow crystals, J. Fac. Sci. Hokkaido Univ., 7, 321–362, 1966. Yang, D. Q., Elomaa, E., Tuominen, A., Aaltonen, A.,
Goodi-son, B., Gunther, T., Golubev, V., Sevruk, B., Madsen, H., and Milkovic, J.: Wind-induced precipitation undercatch of the Hell-mann gauges, Nordic Hydrol., 30(1), 57–80, 1999.