HAL Id: hal-00299208
https://hal.archives-ouvertes.fr/hal-00299208
Submitted on 1 Nov 2004
HAL is a multi-disciplinary open access
archive for the deposit and dissemination of
sci-entific research documents, whether they are
pub-lished or not. The documents may come from
teaching and research institutions in France or
abroad, or from public or private research centers.
L’archive ouverte pluridisciplinaire HAL, est
destinée au dépôt et à la diffusion de documents
scientifiques de niveau recherche, publiés ou non,
émanant des établissements d’enseignement et de
recherche français ou étrangers, des laboratoires
publics ou privés.
Principal component analysis of geoelectrical signals
measured in the seismically active area of Basilicata
Region (southern Italy)
L. Telesca, G. Colangelo, K. Hattori, V. Lapenna
To cite this version:
L. Telesca, G. Colangelo, K. Hattori, V. Lapenna. Principal component analysis of geoelectrical signals
measured in the seismically active area of Basilicata Region (southern Italy). Natural Hazards and
Earth System Science, Copernicus Publications on behalf of the European Geosciences Union, 2004,
4 (5/6), pp.663-667. �hal-00299208�
Natural Hazards and Earth System Sciences (2004) 4: 663–667 SRef-ID: 1684-9981/nhess/2004-4-663
© European Geosciences Union 2004
Natural Hazards
and Earth
System Sciences
Principal component analysis of geoelectrical signals measured in
the seismically active area of Basilicata Region (southern Italy)
L. Telesca1, G. Colangelo1, K. Hattori2, and V. Lapenna1
1Istituto di Metodologie per l’Analisi Ambientale, CNR, Tito (PZ), Italy 2Marine Biosystems Research Center, Chiba University, Japan
Received: 19 July 2004 – Revised: 25 October 2004 – Accepted: 26 October 2004 – Published: 1 November 2004 Part of Special Issue “Precursory phenomena, seismic hazard evaluation and seismo-tectonic electromagnetic effects”
Abstract. Geoelectrical fluctuations are the end product of
several geophysical phenomena. In particular geoelectri-cal signals measured in seismigeoelectri-cally active areas can be at-tributed to stress and strain changes, associated with earth-quakes. The complexity of this problem has suggested the development of advanced statistical methods to investigate the heterogeneous nature of these fluctuations. In this paper we analysed the time dynamics of short-term variability of geoelectrical field measured at Giuliano station, located in Basilicata Region, one of the most seismically active areas of southern Italy. We applied the principal component anal-ysis (PCA). The analanal-ysis has shown earthquake precursory patterns in the daily variation of the principal components, revealing that the PCA approach is promising for monitoring seismic areas.
1 Introduction
The scientific research applied to earthquake dynamics is ex-periencing a more and more growing interest in the analy-sis of a variety of geophysical signals that can provide in-direct information on the dynamics underlying the tectonic processes. Field measurements in seismic areas have docu-mented anomalous geophysical patterns linked to stress and strain changes, followed by earthquakes (i.e. Zhao et al., 1994; Hayakawa et al., 1996; Park, 1997; Martinelli and Al-barello, 1997; Vallianatos and Tzanis, 1999; Hayakawa et al., 1999, 2000; Telesca et al., 2001). In particular, transient vari-ations of the Earth’s electric field have been observed prior to seismic activities (Johnston, 1997). Variations in the stress and fluid flow fields can produce changes in the geoelectrical field, which can provide useful information on geodynamical mechanisms underlying phases of normal conditions as well as phases of intense seismic activity.
Correspondence to: L. Telesca
A geoelectrical signal consists in measuring the poten-tial voltage difference between two points on earth’s surface due to the presence of an electric field produced by natu-ral sources distributed in the subsoil (e.g. Parasnis, 1987; Sharma, 1997 and references therein).
Geoelectrical signals have been largely applied in geother-mal, environmental and engineering research to locate and delineate sources associated with movement of fluids and groundwater (Ogilvy et al., 1969; Corwin and Hoover, 1979; Sharma, 1997 and references therein). Furthermore, other significant applications can be found in the geophysical sur-vey of volcanic and tectonic areas (Di Maio and Patella, 1991; Di Maio et al., 1997).
The most known phenomenon originating geoelectrical variations is the “streaming potential”: the electrical signal is produced, when a fluid flows in a porous rock due to a pore pressure gradient. The phenomenon is generated by the for-mation within the porous ducts of a double electrical layer between the bounds of the solid, that absorbs electrolytic anions and cations distributed in a diffused layer near the boards. Due to pressure gradient, the fluid flows and trans-ports a part of the cations, giving on one side of the layer an excess of positive charges. This produces an induced electric field along the length of the duct and the associated potential differences (“streaming potential”). The “streaming poten-tial” is given by the following equation:
1V = C1P = 4π ηζρε1P ,
where ζ is the zeta potential, that is the potential between mobile and immobile charges, η is the dynamic viscosity of the electrolyte, ε is the dielectric constant of electrolyte, ρ is the resistivity of the electrolyte, 1P is the gradient of pres-sure and C is the coefficient of “streaming potential”.
The increasing accumulation of strain in a seismic focal region can cause dilatancy of rocks (Nur, 1972). The phe-nomenon of dilatancy consists in the formation and propaga-tion of cracks inside a rock as stress reaches about half its strength (Brace et al., 1966). If the rocks in the focal re-gion and surrounding volumes are saturated with fluids, the
664 L. Telesca et al.: Principal component analysis of geoelectrical signals
Fig. 1
Fig. 1. The main structural faults of Shuthern Apennine Chain.
voids generate pressure gradients, which the fluid particles are subject to. Hence, fluids invade the newly opened voids and flow until the pressure balances inside the whole system of interconnected pores. During fluid invasion the condition of rock dilatancy hardening can be reached, which prevents the rock strength limit can be thus over-come: the rock sud-denly weakens and the earthquake is triggered.
The dissolved salts increase the amount of anions and cations of the underground liquids. The free liquid in the cen-tre of the rock pore is usually enriched in cations, while an-ions are usually absorbed on the soil surface in silicate rock. The free pore water carries an excess positive charge, a part of which accumulates close to the solid-liquid interface form-ing a stable double layer. When the liquid is forced through the porous medium, owing to the action of the pressure gra-dients due to dilatancy, the water molecules carry free pos-itive ions in the diffusion part of the pore. This relative movement of cations with reference to the firmly attached anions generates the well know streaming potential (Keller and Frischknecht, 1966). Of course, the role of the electrical charges can be reversed, according to the absorption proper-ties of the rocks. As suggested by Mizutani et al. (1976), the streaming potential can be responsible for the voltage mea-sures on the ground surface preceding an earthquake (Patella et al., 1997).
Although the theory on the possible generation of anoma-lous patterns in geoelectrical signals associated with in-coming earthquakes is well known (Vallianatos and Tzanis, 1999), robust statistical methodologies are necessary to ex-tract from the geoelectrical variability those features which are very probably linked to the earthquake activity. In the literature many papers have dealt with the statistical analy-sis of geoelectrical signals, using spectral methods as well as fractal and multifractal tools. In Telesca et al. (2001) a significant correlation has been observed between the scal-ing parameters describscal-ing the temporal fluctuations of geo-electrical data and seismicity. In Hayakawa et al. (2000) the analysis of the temporal variation of the exponent of the ULF spectrum has shown a clear decrease before the occurrence of a large shock; such behaviour has been explained in the
context of Self-Organized Criticality (SOC) (Tzanis and Val-lianatos, 2003). Multifractal investigations of geoelectrical signals have revealed a structural discrimination between sig-nals measured in seismic areas and those measured in aseis-mic areas (Telesca et al., 2004).
In this paper we propose another approach to investi-gate the short-term time dynamics of geoelectrical data mea-sured in Giuliano station located in Basilicata Region (south-ern Italy), one of the most seismically active areas of the Mediterranean. The method used is the principal compo-nent analysis (PCA). This technique has been successfully applied by Gotoh et al. (2002), which reported on the effec-tiveness of PCA approach for the signal discrimination and have found a ULF geomagnetic signature associated with Izu Islands earthquake in 2000. In Hattori et al. (2004), the PCA technique has shown to be a promising method for monitor-ing crustal activity.
2 Geological and seismological setting
The southern Apennine chain is an Adriatic-verging chain, built up from early Miocene to Pleistocene. It is mainly com-posed of sedimentary cover of platform and deep water en-vironments, scraped off from the former Mesozoic Ligurian ocean, from the western passive margin of the Adriatic plate and from the Neogene-Pleistocene foredeep deposits of the active margin (Monaco and Tortorici, 1995; Schiattarella, 1998; Giano et al., 1999). Thrusting in the frontal eastern part of the accretionary wedge is followed by back-arc ex-tension in the rear to the west. One of the evidence of active extension along the Apennine axis is widely documented in the field (e.g. Val d’Agri, Vallo di Diano, etc.) and by seis-micity (e.g. the 1980 Irpinia earthquake).
Quaternary folding and brittle deformations of subaerial slope deposits in the northern part of the Agri Valley have been studied through geophysical and structural analyses. The results revealed that the area underwent both transpres-sional and transtentranspres-sional tectonics during Pleistocene times. On this basis, the valley appears to be a more complex struc-ture than a simple extensional graben, as traditionally as-sumed in the literature.
The architecture and the large-scale kinematics of the southern Apennines (Fig. 1) constructed a depth-extrapolated cross-section through the whole chain, from the Tyrrhenian Sea to the Adriatic (Apulian) foreland. Several tectonic units have been distinguished in the cross-section, moving from West to East, and from the top to the bottom of the chain. The Apulian carbonate platform has been incorporated by under plating at the base of the accretionary wedge. Restoration of the cross-section gave about 50% of shortening (correspond-ing to about 100 km); not includ(correspond-ing the displacement related to the basal thrust of the Apennine units on the Apulian plat-form. Shortening could be at least twice considering that the deformed “Apulian” units should be present at the base of the whole accretionary wedge. Due to the time span estimated
L. Telesca et al.: Principal component analysis of geoelectrical signals 665 for the Apennine orogeny (about 20 Ma), a very high
short-ening rate may be calculated (1 cm/y).
From the seismological point of view, the Campano-Lucano sector of the Southern Apennines chain is one of the most active areas of the Mediterranean region. In particular, this area is characterised by a probability >60% to gener-ate at least one earthquake with M>3.5 in a time span of 3 years (Martinelli and Albarello, 1997). In this region on February 1826 an earthquake, reaching up to VIII degree on the MCS scale (Alessio et al., 1995), hit the village of Tito where is located our prototype station. One of the most his-torically relevant events, the 16 December 1857 (I=XI MCS) normal-faulting earthquake (Mallet, 1862), occurred close to Marsico Nuovo village in Val d’Agri. On 23 November 1980 (Ms=6.9), a large normal-faulting earthquake occurred in the nearby Irpinia area. Seismic activity occurred after the 1980 event consisted of medium intensity events (M<5.5) located close to the border between Campania and Basilicata regions (Alessio et al., 1995).
The 5 May 1990 (MD=5.0, ING-National Institute of
Geo-physics) and the 26 May 1991 (MD=4.7) earthquakes took
place in the north of Potenza town (Tertulliani et al., 1992). These events have been generated by a strike-slip fault sys-tem with WE direction, perpendicularly oriented toward the Apennine chain (Ekstr¨om, 1994), located in such a way to limit toward north and south two great seismogenetic faults that caused the 1857 Val d’Agri and 1980 Irpinia earthquakes respectively. These geological and seismological features, combined with a very low level of cultural noise, allow us to consider the selected area as an ideal outdoor laboratory to study the possible correlations between tectonic activity and anomalous patterns in geoelectrical signals. Since the area is also characterized by seismic quiescence periods, in princi-ple, it is possible to test alarms and false alarms.
3 The monitoring station
The Giuliano station (40.688◦N, 15.789◦E) is located just on a strike fault. It measures two goelectrical signals. The dipoles are located parallel and perpendicular to the strike-fault. Figure 3 shows the fault and the directions of the dipoles. The distance between the probes is 100 m for the dipole oriented along the strike-fault direction (EW), and 80 m for the other dipole (NS) perpendicular to the fault. The lithology of the site is characterized by clay sediments. Each electrode is inserted in the ground 1 m depth and are linked to a high-resolution multimeter connected to a PC with an interface NI4350. This interface contains a 24-bit sigma-delta analogue-to-digital converter (ADC) with differential analogue inputs. The low leakage construction, along with analogue and digital filtering, provides excellent resolution, accuracy, and noise rejection. The terminal block TBX-68T is connected to the acquisition card. Both are connected to the screened cables coming from the sensors. The sampling time is 1t=1 min.
Fig. 2
Fig. 2. Station Giuliano and epicenter distribution of the earth-quakes occurred during the observation period and satisfying Do-brovolskiy’s rule.
4 Principal component analysis
In order to extract anomalous behavior of geoelectrical data observed at Giuliano station, the principal component analy-sis (PCA) has been performed. The PCA was firstly applied in Gotoh et al. (2002). Two orthogonal geoelectrical signals have been used for this analysis. We analyzed data from 1 March 2000 to 30 April 2004 to investigate the long-term variations.
The procedure of PCA is as follows. Let us con-sider the time series data (1 day 1440 points) are given by ych1=[ych1(t1), ych1(t2), . . . , ych1(t1440)]T, ych2 =
[ych2(t1), ych2(t2), . . . , ych2(t1440)]T where subscripts
ch1 and ch2 correspond to the NS and EW component of geoelectrical data, respectively. Then, the data matrix Y =
[ych1, ych2]T is obtained and the variance matrix R = Y YT
is computed, where T means transpose. The eigenvalue de-composition of R is performed, R = V 3VT, where 3g is
eigenvalue matrix with λ1and λ2and V is the eigenvectors
matrix whose column is y1, and y2. Here subscript 1and 2
in-dicate the order of magnitude (λ1>λ2). In the PCA approach,
the projection axis (eigenvector v1)is chosen to maximize
the variance of the observed data along the axis. The signal space defined by Y is considered to be the most dominant signal subspace or the most intense signal subspace and it is called the first principal component. Then, it is possible to perform orthogonal expansion of observed signal space into
666 L. Telesca et al.: Principal component analysis of geoelectrical signals Fig. 3 0 200 400 600 800 1000 1200 0 20 40 60 80 100 2.0 2.5 3.0 3.5 4.0 sq rt ( λ1 ) t (day) a) A C B N
Fig. 3. Technical scheme of the station Giuliano.
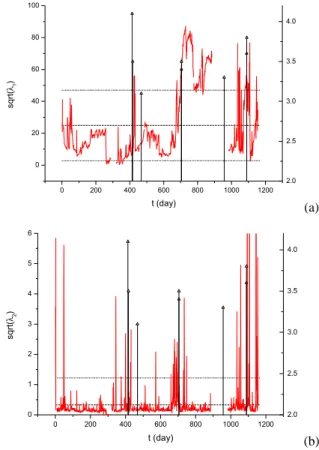
5 Results
In order to extract anomalous behavior of geoelectrical data observed at Giuliano station, the principal component anal-ysis (PCA) has been performed. In order to evaluate possi-ble correlations with the local seismic activity, we extracted the earthquakes from the INGV (National Institute of Geo-physics and Volcanology) catalog, occurred during the ob-servation period and satisfying Dobrovolskiy’s rule (Dobro-volskiy et al., 1979; Dobro(Dobro-volskiy, 1993). This law, which is a theoretical relation between earthquake magnitude, dis-tance from the epicenter and volumetric strain, states that de-tectable seismically induced strain exceeds 10−8. From this
relation the maximum distance from the epicenter in which the effects of the earthquake are detectable is r=100.43M, where r is measured in km. Figure 2 shows the epicentral dis-tribution of the selected earthquakes with magnitude M≥3.0. The night time data (00:00–06:00 LT) are used for PCA, since we expect less artificial signals at night. Figure 4 shows the daily variation of the two principal components√λ1and
√
λ2. The earthquake occurrences are shown by vertical
ar-rows. In order to recognize anomalous values for the princi-pal components, we calculated the average and the standard deviation σ among all values. The anomalous principal com-ponent value is then defined as the value exceeding the aver-age of more than 1 σ . In Fig. 4 the averaver-age value is indicated by a horizontal dashed line, while the 1−σ range is delim-ited by horizontal dotted lines. The variation
√
λ1shows an
approximately regular behaviour at large timescale, while it appears more spiky at shorter timescales (Fig. 4a). We ob-serve a clear correlation between the anomalous values of the principal component with the earthquake selected by Dobro-volskiy’s rule, and in several cases the earthquakes are pre-ceded by anomalous values. Anomalous values of√λ1are
(we will indicate the anomaly by the number of the day, in which it occurred): 1) day 420, just after the two earthquakes occurred in day 414 and 417, and before the earthquake oc-curred in day 468; 2) in day 690, preceding the earthquakes occurred in day 705; 3) the period from approximately day 700 and day 800, during which no earthquakes occurred, but
Fig. 3 0 200 400 600 800 1000 1200 0 20 40 60 80 100 2.0 2.5 3.0 3.5 4.0 sq rt ( λ1 ) t (day) a) A C B N (a) 0 200 400 600 800 1000 1200 0 1 2 3 4 5 6 2.0 2.5 3.0 3.5 4.0 sq rt ( λ2 ) t (day) b) Fig. 4 (b) Fig. 4. Results of the PCA for eigenvalues calculated for nightime data (00:00–06:00 LT): (a) variation of the first principal component
√
λ1; (b) variation of the second principal component
√ λ2. The occurrence times of the earthquakes satisfying Dobrovolskiy’s rule (M≥3.0) are shown by means of vertical arrows.
probably related with some post-seismic phenomena or some redistribution of the stress in the focal region; 4) the period from approximately day 820 and day 900, that preceded the earthquake occurred in day 957; 5) the period from day 1030 and day 1050 with the period from day 1070 and day 1110, during which two earthquakes occurred (one in day 1090 and the other in day 1091).
The behaviour of the second principal component
√ λ2
is characterized by a more spiky feature, and presents the anomalous values structured as clusters. A correlation be-tween the anomalous values of the component and the earth-quake occurrences can be seen, except for the first anomalous cluster located at around 50 h. In particular the anomalous values which are correlated with earthquakes are localized at around day 330, from day 400 to day 420, day 570, from about day 670 to day 700, at day 760 and from day 1030 to day 1150.
Therefore the character of these anomalous clusters is al-most always precursory-like.
6 Conclusions
We have analysed geoelectrical data measured at station Giu-liano, located in one of the most seismically active areas of
L. Telesca et al.: Principal component analysis of geoelectrical signals 667 southern Italy from 1 March 2001 to 30 April 2004. We
per-formed the PCA using the night time data (00:00 to 06:00 LT) in order to disregard possible artificial sources of signal, es-pecially linked with anthropic activity. We studied the daily time evolution of the two principal components and found an interesting seismic precursory-like pattern in both com-ponents, revealing the PCA approach as a promising method for the monitoring of seismic areas.
Acknowledgements. The authors are grateful to F. Vallianatos and
an anonymous referee, whose suggestions significantly improved the present paper.
The present work is partly supported by the Italy-Japan bilateral project “Ground-based and satellite geophysical monitoring and modelling of seismotectonic structures” (Team leaders: V. Lapenna, Italy and M. Hayakawa, Japan), to which we are grateful. Edited by: P. F. Biagi
Reviewed by: F. Vallianatos and another referee
References
Alessio, G., Esposito, F., Gorini, A., and Porfido, S.: Detailed study of the Potentino seismic zone in the Southern Apennines, Tectonophysics 250, 113–134, 1995.
Brace, W. F., Paulding Jr., B. W., and Scholz, C. H.: Dilatancy in the fracture of cristalline rocks, J. Geophys. Res. 71, 3939–3953, 1966.
Corwin, R. F. and Hoover, D. B.: The self-potential method in geothermal exploration, Geophysics, 44, 226–245, 1979. Di Maio, R. and Patella, D.: Basic theory of electrokinetic effects
associated with earthquake, Boll. Geof. Teor. e Appl., 33, 130– 131, 1991.
Di Maio, R., Mauriello, P., Patella, D., Petrillo, Z., Piscitelli, S., Siniscalchi, A., and Veneruso, M.: Self-potential, geoelectric and magnetotelluric studies in Italian active volcanic areas, Annali di Geofisica, 40, 519–537, 1997.
Dobrovol’skiy, I. P.: Analysis of preparation of a strong tectonic earthquake, Phys. Solid Earth, 28, 481–492, 1993.
Dobrovol’skiy, I. P., Zubkov, S. I., and Miachkin, V. I.: Estima-tion of the size of earthquake preparaEstima-tion zones, Pageoph., 117, 1025–1044, 1979.
Ekstr¨om, G.: Teleseismic analysis of the 1990 and 1991 earth-quakes near Potenza, Annali di Geofisica, 37, 1591–1599, 1994. Giano, I., Maschio, L., Alessio, M., Ferranti, L., Improta, S., and Schiattarella, M.: Radiocarbon Dating of the active faulting in the Agri High valley, Southern Italy, J. Geodynamics, 29, 371– 386, 1999.
Gotoh, K., Akinaga, Y., Hayakawa, M., Yumoto, K., Nagao, T., and Uyeda, S.: Principal component analysis of ULF mag-netic anomaly preceding the 1997 Kagoshima earthquakes, in: Seismo Electromagnetics: Lithosphere-Atmosphere-Ionosphere Coupling, edited by Hayakawa, M. and Molchanov, O., Terra-pub, Tokyo, 19–28, 2002.
Gotoh, K., Akinaga, Y., Hayakawa, M., and Hattori, K.: Princi-pal component analysis of ULF geomagnetic data for Izu islands earthquakes in July 2000, J. Atmos. Electr., 22, 1–12, 2002. Hattori, K., Serita, A., Gotoh, K., Yoshino, C., Harada, M., Isezaki,
N., and Hayakawa, M.: ULF geomagnetic anomaly associated
with the 2000 Izu Islands earthquake swarm, Japan, Phys. Chem. Earth, 29, 425–435, 2004.
Hayakawa, M., Kawate, R., Molchanov, O. A., and Yumoto, K.: Re-sults of ultra-low-frequency magnetic field measurements during the Guam earthquake of 8 August, 1993, Geophys. Res. Lett., 23, 241–244, 1996.
Hayakawa, M., Itoh, T., and Smirnova, N.: Fractal analysis of ULF geomagnetic data associated with the Guam earthquake on 8 Au-gust 1993, Geophys. Res. Lett., 26, 2797–2800, 1999.
Hayakawa, M., Hattori, K., Itoh, T., and Yumoto, K.: ULF electro-magnetic precursors for an earthquake at Biak, Indonesia on 17 February 1996, Geophys. Res. Lett., 27, 1531–1534, 2000. Johnston, M. J. S.: Review of electric and magnetic fields
accom-panyng seismic and volcanic activity, S. Geophys., 18, 441–475, 1997.
Keller, G. V. and Frischknecht, F. C.: Electrical Methods in Geo-physical Prospecting (Pergamon Press, Oxford), 523, 1966. Martinelli, G. and Albarello, D.: Main constraints for siting
moni-toring networks devoted to the study of earthquake related hydro-geochemical phenomena in Italy, Annali di Geofisica, 40, 1505– 1522, 1997.
Monaco, C. and Tortorici, L.: Tectonic role of ophiolote-bearing terranes in the development of the Shouthern Apennines orogenic belt, Terra Nova 7, 153–160, 1995.
Nur, A.: Dilatancy pore fluids and premonitory variations of ts/tp travel times, Bull. Seism. Soc. Am., 62, 1217–1222, 1972. Ogilvy, A. A., Ayed, M. A., and Bogoslovsky, V. A.: Geophysical
studies of water leakages from reservoirs, Geophys. Prosp., 22, 36–62, 1969.
Parasnis, D. S.: Principles of Applied Geophysics, Chapman and Hall, 1986.
Park, S. K.: Monitoring resistivity changes in Parkfield, California 1988–1995, J. Geophy. Res., 102, 24 545–24 559, 1997. Patella, D.: Introduction to ground surface self-potential
tomogra-phy, Geophys. Prospect., 45, 653–681, 1997.
Schiattarella, M.: Quaternary tectonics of the Pollino Ridge, Calabria-Lucania boundary, southern Italy, in: Continen-tal Transpressional and Transtensional Tectonics, edited by Holdsworth, R. E., Strachan, R. A., and Dewey, J. F., Geolog-ical Society Special Publication, 135, 341–354, 1998.
Sharma, P. S.: Enviromental and Engineering Geophysics, Cam-bridge Univ. Press, 1997.
Telesca, L., Cuomo, V., Lapenna, V., and Macchiato, M.: A new ap-proach to investigate the correlation between geoelectrical time fluctuations and earthquakes in a seismic area of Southern Italy, Geophys. Res. Lett., 28, 4375–4378, 2001.
Telesca, L., Balasco, M., Colangelo, G., Lapenna, V., and Macchi-ato, M.: Investigating the multifractal properties of geoelectrical signals measured in southern Italy, Phys. Chem. Earth, 29, 295– 303, 2004.
Tertulliani, A., Anzidei, M., Maramai, A., Murru, M., and Riguzzi, F.: Macroseismic study of the Potenza (Southern Italy) earth-quake of 5 May 1990, Natural Hazards, 6, 25–38, 1992. Vallianatos, F. and Tzanis, A.: On possible scaling laws between
Electric Earthquake Precursors (EEP) and Earthquake Magni-tude, Geophys. Res. Lett., 26, 2013–2016, 1999.
Tzanis, A. and Vallianatos, F.: Distributed power-law changes and crustal deformation in the SW Hellenic Arc, Natural Hazards and Earth System Sciences, 3, 179–195, 2003,
SRef-ID: 1684-9981/nhess/2003-3-179.
Zhao, Y. and Qian, F.: Geoelectric precursors to strong earthquakes in China, Tectonophysics, 233, 99–113, 1994.