HAL Id: hal-00296342
https://hal.archives-ouvertes.fr/hal-00296342
Submitted on 28 Sep 2007
HAL is a multi-disciplinary open access
archive for the deposit and dissemination of
sci-entific research documents, whether they are
pub-lished or not. The documents may come from
teaching and research institutions in France or
abroad, or from public or private research centers.
L’archive ouverte pluridisciplinaire HAL, est
destinée au dépôt et à la diffusion de documents
scientifiques de niveau recherche, publiés ou non,
émanant des établissements d’enseignement et de
recherche français ou étrangers, des laboratoires
publics ou privés.
from ISCCP Dx data
N. Petrenz, M. Sommer, F. H. Berger
To cite this version:
N. Petrenz, M. Sommer, F. H. Berger. Long-time global radiation for Central Europe derived from
ISCCP Dx data. Atmospheric Chemistry and Physics, European Geosciences Union, 2007, 7 (18),
pp.5021-5032. �hal-00296342�
Received: 4 May 2007 – Published in Atmos. Chem. Phys. Discuss.: 14 June 2007
Revised: 12 September 2007 – Accepted: 21 September 2007 – Published: 28 September 2007
Abstract. The global Dx dataset of the International
Satel-lite Cloud Climatology Project (ISCCP) with a spatial resolu-tion of about 30×30 km2was analysed to produce spatially highly resolved long-time datasets to describe the radiation budget for Central Europe over the period of 1984–2000. The computation of shortwave and longwave radiant flux densi-ties at top of atmosphere and at surface was based on 1D radiative transfer simulations. The simulations were carried out for all relevant atmospheric and surface conditions and the results were inserted into a look-up table. Thus, long-time calculations for all conditions and long-time slices of the Dx dataset could be realised. The study is focussed on the global radiation at surface.
The first examination was carried out for the ISCCP D1 and the ISCCP D2 dataset. These datasets, including cloud and surface information on a different spatial scale (280×280 km2), were applied to the produced look-up ta-ble analogue to the Dx data. The calculated global radiation of the D1 and D2 dataset were compared to the Dx dataset. The differences between these datasets mainly range from 5–15 Wm−2 (2–6%) with regional peaks up to 25 Wm−2 (10%).
The evaluation with the GEWEX Surface Radiation Bud-get (SRB) data emphasises differences between 5–25 Wm−2 (6–16%) over land areas. Deviations to an ISCCP provided flux data set vary from 0 Wm−2in the North up to 35 Wm−2 (0–13%) in the South of Central Europe.
The global radiation datasets provided by the Global En-ergy Balance Archive (GEBA) and the German Meteorolog-ical Service (DWD) agree well, but they are 5–25 Wm−2(7– 10%) lower than the Dx results.
Annual analyses of global radiation of various regional cli-mate models complete the study. It is figured out that the used models and methods reveal a couple of discrepancies. Correspondence to: N. Petrenz
Especially in wintertime the results of our analysis differ to the considered models. Principally the uncertainties were caused by the determined range of values and simplifications for the computation of the radiative transfer simulation.
1 Introduction
The knowledge of incoming and outgoing shortwave and longwave radiant flux densities provides the key information for the net balance and thus for energy exchanges between atmosphere and surface. Therefore it is necessary to infer these radiant flux densities as accurately as possible to re-alise a correct characterisation of the Earth’s climate system (Hollmann et al., 2006). The radiation budget is object of in-vestigation in numerous studies, which infer radiant flux den-sities at top of atmosphere (TOA) and at surface using ground based measurements or remotely sensed data (Raschke et al., 2005, 2006).
Among others the Global Energy Balance Archive (GEBA/Gilgen et al., 1997; Gilgen and Ohmura, 1999), the Baseline Surface Radiation Network (BSRN/Ohmura et al., 1998), the Atmospheric Radiation Measurement (ARM/Stokes and Schwartz, 1994) or the Surface Radia-tion Budget Network (SURFRAD/Augustine et al., 2000) provide high quality datasets from surface observation sites with directly measured radiant flux densities. Due to the point measurements spatial interpolations are ambiguous and mostly less representative because of the wide distances be-tween the stations within meteorological networks. Remote sensing systems collect radiative properties and surface tem-peratures at different temporal and spatial scales allowing the derivation of area-integrated radiances and radiant flux densities at different atmospheric layers. In this regard the global datasets of the Earth Radiation Budget Experiment (ERBE/Barkstrom et al., 1989), the International Satellite Cloud Climatology Project (ISCCP/Schiffer and Rossow,
Table 1. Summary of the used ISCCP data products according to Rossow et al. (1996).
Dataset Temporal Resolution Spatial Resolution Parameters
Cloud Surface Other ISCCP Dx 3-hourly ca. 30×30 km2 – cloud top temperature
– cloud top pressure – optical thickness
– (clear sky) surface temperature – land/water/ near shore flag – snow/ice code
– latitude, longitude – solar zenith angle – day/night flag ISCCP D1 3-hourly ca. 280×280 km2 – cloud top temperature
– cloud top pressure – optical thickness
– (clear sky) surface temperature – land/water cover
– snow/ice cover
– latitude, longitude – solar zenith angle – day/night ISCCP D2 3-hourly monthly means ca. 280×280 km2 – cloud top temperature
– cloud top pressure – optical thickness
– surface temperature – land/water cover – snow/ice cover
– latitude, longitude
1983), the Clouds and the Earth’s Radiant Energy System (CERES/Wielicki et al., 1998) or the GEWEX Surface Ra-diation Budget (SRB/Stackhouse et al., 2000) are often ap-plied. Estimations of shortwave and longwave surface ra-diation fluxes from satellite measurements are carried out with specially developed algorithms consisting of simple pa-rameterisations concerning cloud physics, atmosphere and aerosols (Darnell et al., 1988, 1992; Gupta et al., 1992; Pinker and Laszlo, 1992; Pinker et al., 1995; Rossow and Zhang, 1995; Zhang et al., 1995). The evaluation of calcu-lated radiative flux components is complicated since the pa-rameterisation of atmospheric and surface properties is still problematic in model approaches.
The decisive input to the climate system is the incoming solar radiation, which is nearly con-stant at TOA. Incoming solar radiation is attenuated by the atmosphere and the de-scription of this process of radiative transfer is treated differ-ently by the available transfer codes. Further investigations regarding other radiation budget components assume an ex-act determination of the sum of direct and diffuse incoming solar radiation (global radiation). This paper describes and discusses a specially developed method for calculating radi-ation budget components at TOA and at surface using vari-ous ISCCP data. Detailed analyses and comparisons for the global radiation are shown.
2 Input data and method description
2.1 Data source
The ISCCP datasets with a current availability from July 1983 to December 2004 are used to compute the shortwave and longwave radiant flux components for both TOA and sur-face. At present three datasets (Dx/D1/D2) exist combining data of all available geostationary and polar orbit weather satellites (Rossow et al., 1996; Rossow and Schiffer, 1999). The datasets build up on each other (D1 on Dx and D2 on D1) and include a nearly complete global information of
var-ious cloud properties. Table 1 gives a summery of the spatial and temporal resolution of the datasets as well as the used parameters.
Additionally the weekly snow/ice cover data from the NOAA/National Environmental Satellite Data and Informa-tion Service (NESDIS) and from the NAVY/NOAA Joint Ice Center (see Rossow et al., 1991) are enclosed.
As reference the three-hourly ISCCP Dx data with a spa-tial sampling resolution of approx. 30×30 km2, one
ran-dom pixel of 4–7 km without specific knowledge of loca-tion is characteristic for the whole grid cell, is used. IS-CCP D1 and D2 are datasets with an equal area grid of approx. 280×280 km2(2.5◦×2.5◦ at the equator), but with different temporal sampling intervals. Thus the D1 dataset provides three-hourly cloud information and the D2 dataset is statistically averaged to three-hourly monthly means (see more details in Rossow et al., 1996).
All calculations are carried out over the pe-riod of 1984–2000 (17 years) covering a region of 65◦N/35◦E/30◦S/15◦W (henceforth Central Europe). In the run-up to radiative transfer simulations gaps, plausibility and spatial structures for each dataset are tested. The global D1 and D2 time series of cloud amount and surface temperature have only few gaps (<0.2%). Due to the method creating the equal-area grid cells uncertainties in spatial structures are possible. But the analysis exhibited logical spatial structures. In contrast the gaps of parame-ters, which are estimated only during the day, like optical thickness, cloud type and reflectivity, are more extensive (approx. 5.0%) and cause uncertainties for further computa-tions. Furthermore at the edge of the geostationary satellite images the data are either missing or of insufficient quality.
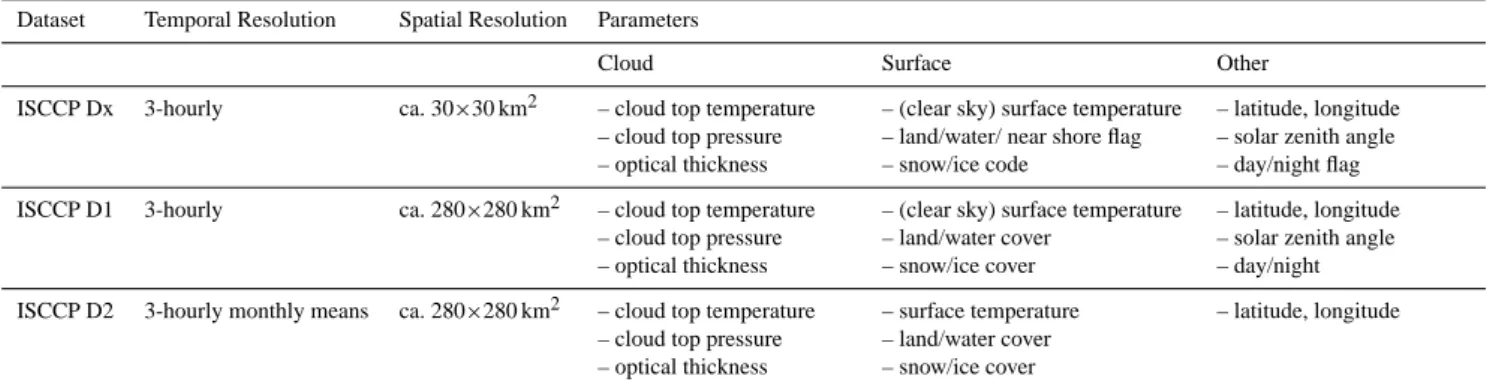
In Fig. 1a the mean global cloud amount of the D1 dataset over the whole period is shown in context with the calculated temporal trends. To avoid the influences of seasonal vari-ations annual means are produced and applied to the trend analysis. A clear negative trend in the cloud amount of about 2.5% over wide areas with regional peaks of 15.0% and more is observed. To verify the detected trends the non-parametric
Fig. 1. Mean global ISCCP D1 cloud amount. (a) Annual mean over the period of 1984–2000. (d) Temporal variances of cloud amount as well as statistically firmed trends within black contoured regions over the periods of 1984–2000. (b), (c) Obvious inhomogeneities of time series in two special regions (inhomogeneous time series are black, homogeneous time series are grey).
Mann-Kendall test – applicable in case of non-linear trends – is used (Rapp, 2000): Q = N −1 P i=1 N P j =i+1 sgn(yj−yi) q 1 18[N (N − 1)(2N + 5)] (1)
where Q is the numerical test value, N is the length of the time series, sgn describes the lead-ing sign, yi and yj are the values to compare. The test only rates the relative increase or decrease of the values but provides no detailed information of time dependent changes. The corresponding confidence in-terval V and the probability value α to every calculated Q are taken from Rapp (2000). In Fig. 1 the visible global trends are only significant within the contoured regions exhibiting a confidence interval of V >99.7%. At the edge of the geo-stationary satellite images the largest negative trends occur which are also statistically firmed. Evaluating these trends the time series of two joining pixel in two different areas are investigated (red circles).
Figure 1c reveals the inhomogenities over the period of August 1984 to December 1985 (black graph). Long-term measurement gaps of the operational geostationary satellite GOES-East were discovered that intensify these trends. The black graph in Fig. 1b represents a pixel that belongs to the disk recorded by the geostationary satellite INSAT. The data
of this satellite only exist for the period of April 1988 to March 1989. Due to this huge failure only the data of po-lar orbit satellites were available twice per day therefore pro-viding insufficient measurements. At the beginning of 1998 Meteosat-5 has been replaced to the position 63◦ East to compensate for the full disk of INSAT resulting in consistent time series. Regarding to these analyses the observed and as-sured trends within the critical regions are adulterated. For Central Europe only Meteosat data are used. There no pro-foundly long-term gaps and failures could be located. Similar analyses relating to inhomogeneities in the time series of the ISCCP dataset are documented in Evan et al. (2007).
The used ISCCP Dx dataset includes pixel level cloud in-formation that is primarily based on the inin-formation of the cloud mask (1 = clouds; 0 = no clouds) and on relevant in-formation of cloud top temperature, cloud top pressure and cloud optical thickness. With these parameters a classifica-tion of cloud classes and cloud layers according to Rossow et al. (1996) is carried out. 15 cloud classes and three cloud layers could be determined and the frequencies of each are calculated.
2.2 Radiative Transfer Model (RTM) and method
The computations are carried out with the complex 1D RTM Streamer, that calculates radiances and radiant flux densities at each atmospheric level for several atmospheric
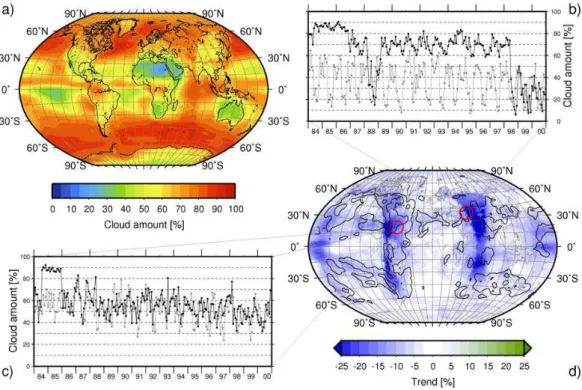
Fig. 2. Global radiation at surface based on ISCCP Dx data. (a) Annual mean over the period of 1984–2000, (b) Temporal trend over the period of 1984–2000 with areas of statistical significance (black contoured).
and surface conditions (Key, 2001; version 3.0 beta 7). The solution of the radiative transfer equation can be re-alized for a horizontal plane-parallel atmosphere with the Delta-2-Stream-Approximation (Toon et al., 1989) and the Discrete-Ordinate-Method (DISORT) according to Stamnes et al. (1988). To estimate shortwave (0.28–4.0 µm) and long-wave (4.0–500.0 µm) radiant flux densities at different layers special input parameters are required regarding clouds, their geometrical, optical and microphysical properties as well as surface and atmospheric properties. First calculations are carried out for the monthly D2 dataset at 12:00 UTC. For that purpose the input parameters are taken directly from the dataset except information concerning the microphysics of clouds. The microphysical cloud parameters, like Liq-uid/Ice Water Content (LWC/IWC) and effective radius re, are defined according to Polar Radiation Fluxes from IS-CCP (PRFI, 2000). Thus LWC is 0.2 gm−3and r
e is 10 µm for water clouds and IWC is 0.07 gm−3and r
e is 30 µm for ice clouds. Atmospheric and aerosol standard profiles from surface (0 km) up to TOA (100 km) are specified within the model. The different vegetation types of the D datasets are adapted to the vegetation types defined in the RTM Streamer followed by the internal modulation of reflectivity.
To handle radiative transfer computations for all ISCCP D datasets and all radiation budget components for the period of 1984–2000 (17 years) look-up tables are an useful instru-ment. Hence relevant nodes of all individual model input pa-rameters are defined and radiative transfer computations are carried out for all expedient input parameter combinations. The resulting shortwave and longwave radiant flux densities with their appropriate parameter sets are tabulated. Now for every individual input parameter set of each grid cell at each time slice the corresponding radiant flux densities can be de-rived using multidimensional linear interpolations between the parameter increments.
3 Results
3.1 Comparison with other satellite derived data products
The computed and altitude corrected global radiation at sur-face over the period of 1984–2000 is based on the highly resolved ISCCP Dx dataset and is shown in Fig. 2 for Cen-tral Europe. There the distinctive North-South gradient with values of about 75 Wm−2in the North and maxima of 300 Wm−2 in the South of the investigation area is shown in Fig. 2a. Data gaps along the coastlines are displayed in white. Due to the solely usage of Meteosat data the cov-ered area is limited to the scanned disk so less values above ca. 60◦latitude exist. Figure 2b shows the temporal variabil-ity of global radiation for the 17 years examined. A statis-tically firmed increase of global radiation (10–20 Wm−2)in
the South of the target area is distinguished. The strong con-tours indicate regions with a confidence interval >99.7% and fine contours assign a confidence interval of >90.0–95.0%. Positive and negative trends are detected in the remaining Central Europe as well, but they could not be certified.
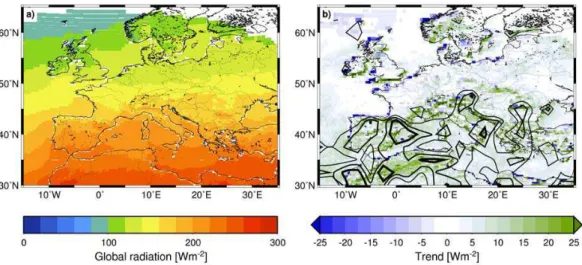
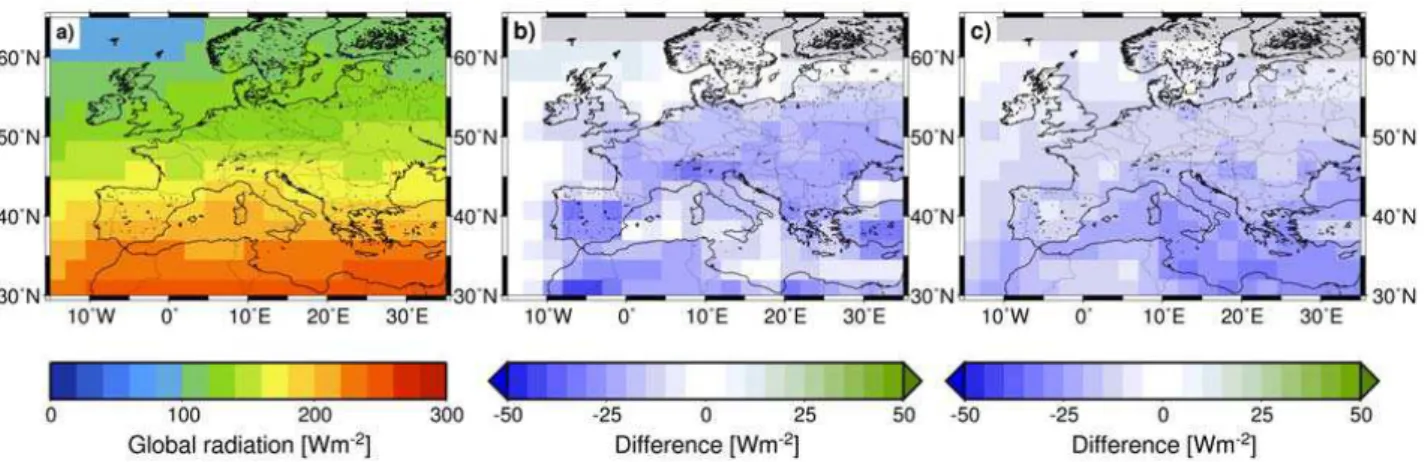
Additionally the global radiation for the ISCCP D1 and ISCCP D2 datasets was computed using the same look-up table as for the Dx dataset in order to provide a common basis for comparisons between the three datasets. Due to their different temporal and spatial resolutions the datasets are adapted and upscaled to the resolution of the D2 dataset (monthly means, 280×280 km2). Figure 3 shows that over wide areas the radiant flux densities of the D1 dataset are approx. 10–15 Wm−2lower than the Dx dataset, except for the most southern area where differences increase up to 20– 30 Wm−2. In contrast deviations between the Dx and the D2 dataset only appear in few regions, most notably in alpine re-gions and in North Africa. Thus values up to ±25 Wm−2in comparison to the Dx dataset can be observed. Considerable
Fig. 3. Comparison of calculated global radiation at surface over the period of 1984–2000. (a) ISCCP Dx dataset (reference) and the appropriate differences to the ISCCP D1 dataset (b: D1-Dx) as well as to the ISCCP D2 dataset (c: D2-Dx).
discrepancies to the Dx dataset are detected for higher al-titudes (Alps) with higher values and for arid environment (North Africa) with lower values for the D1 and D2 dataset. That suggests possible uncertainties in altitude correction and in atmospheric and subjacent surface parameterisation. Given the identical analysis the deviations between the IS-CCP D datasets using same method indicate that after adapt-ing to the comparable resolution the parameters of the origin datasets from Dx over D1 to D2 differ considerably. The dif-ferences at northern latitudes above 60◦are not relevant due to the insufficient Dx data quality as above mentioned.
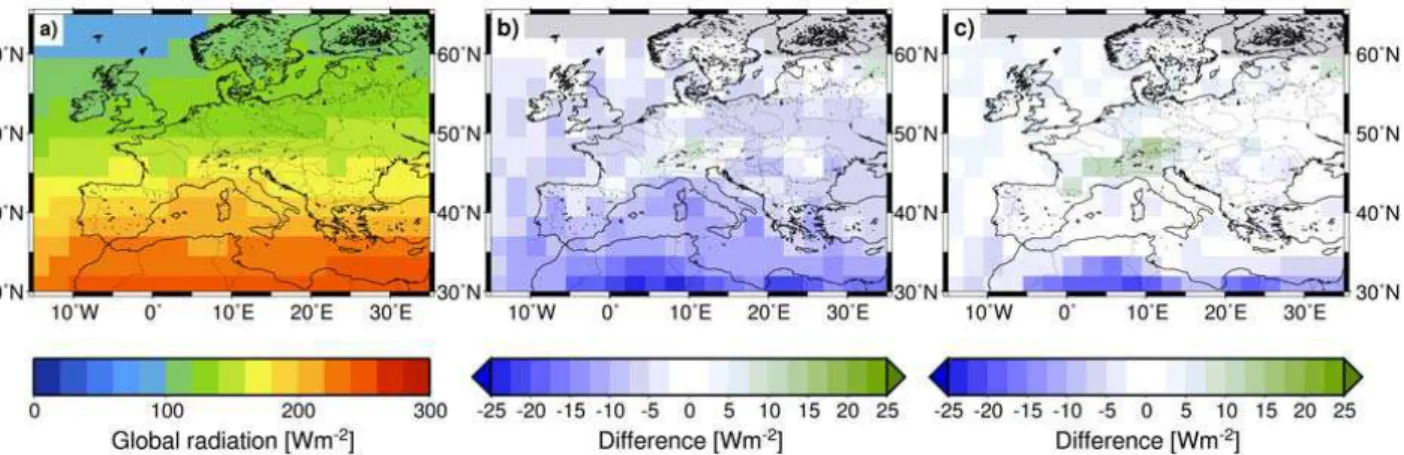
For verification of the Streamer results the satellite data products of the GEWEX SRB and the ISCCP FD (Rossow and Zhang, 1995) dataset are applied. Both datasets include monthly shortwave and longwave radiant flux densities at TOA and at surface, but on different spatial resolutions. Thus radiative transfer computations for the SRB long time series are carried out on a 1◦×1◦global grid on the basis of satel-lite derived cloud data from the ISCCP Dx dataset. The IS-CCP FD data depend on cloud information of the ISIS-CCP D1 dataset on a 2.5◦×2.5◦grid.
Hence for comparison the ISCCP Dx and the SRB data are modified and projected onto a grid equivalent to the spatial resolution of the ISCCP FD dataset. The investigation period is 1984–1993 (10 years).
Figure 4 (b, c) clearly presents a 25 Wm−2 higher Dx global radiation at surface for nearly whole Central Europe compared to SRB and ISCCP FD. In North Africa even val-ues up to 45 Wm−2are achieved.
Considerable differences compared to the SRB dataset mainly exist for land surfaces suggesting some assumptions in our used method. In this context analyses regarding the surface albedo are carried out by varying the reference albedo of grassland (0.225±0.1). This results in global radiation variations of ±5–10 Wm−2(5–8%), especially with increas-ing optical thickness. Additional intensifications are
ob-served over snow, where uncertainties of 10–20% in global radiation could be determined.
The impact of clouds on global radiation is without contro-versy. Therefore the detection of clouds in special developed algorithms is a decisive factor for the quality of the data basis. Over water surfaces clouds could be detected well, but over land surfaces it is difficult in many cases. Thus uncertainties due to land surface heterogeneities could occur. Furthermore cloud radiative forcing and absorption of solar radiation by clouds might be underestimated in the used radiative transfer model (Li, 1995; Cess et al., 1995) which leads to the higher values in global radiation just like a to transparent cloud-free atmosphere.
Additional uncertainties are based on our computations processed using the standardised aerosol profile included in Streamer (aerosol profile of rural areas) with constant aerosol content over the investigated time period. An adaptation to altered conditions within the analysed time series is planned for future studies. The effects of changing aerosol content on global radiation in cloud-free atmospheres are discussed in Wild and Liepert (1998). There the included aerosol effect caused a mean decrease of 18 Wm−2 in global radiation at seven German sites.
Another reason for discrepancies could be the altitude correction applied to the global radiation. Our correction method seems to overestimate the global radiation in moun-tainous regions noticeable in comparison to the SRB data.
The differences to the ISCCP FD dataset are between 5– 20 Wm−2. They are distributed over the whole area showing a slight North-South gradient with maxima of 35 Wm−2 es-pecially over the Mediterranean. These differences were fur-ther analysed for special regions, for seasonal cycle as well as the dependence on latitude or longitude within the seasonal cycle, but no sufficient explanation could be found.
Raschke et al. (2006) compared the SRB and ISCCP FD Data and emphasised uncertainties of −3 to 7 Wm−2
Fig. 4. Comparison of calculated global radiation at surface over the period of 1984–1993; (a) ISCCP Dx dataset (reference) and the appropriate differences to the GEWEX SRB dataset (b: SRB-Dx) as well as to the ISCCP FD dataset (c: FD-Dx).
Fig. 5. Monthly global radiation at surface over the period of 1984–1990 for the ISCCP Dx data in comparison with all available GEBA-Stations of Central Europe (left) and the mean difference at each station between the Dx and GEBA data (right, GEBA-Dx).
in global radiation between 30◦N and 60◦N between the datasets due to different initial input data (different total so-lar irradiance, sun angles above horizon, ancilso-lary data from other sources) and different radiative transfer codes.
3.2 Evaluation with surface measurements
For comparisons with surface measurements data of the Global Energy Balance Archive (GEBA) and the German Meteorological Service (DWD) are used. The analyses are based on different periods and regions. While the monthly GEBA data are actually available online from January 1983 until December 1990 for 305 stations in Central Europe, the data of the DWD stations exist for the complete investiga-tion period but only for Germany. To evaluate the compari-son between satellite derived radiant flux densities and sur-face measurements complete years and time series are used. Thus the investigation period for the GEBA dataset is 1984 to 1990 (98 Stations, 28 within Germany) and for the DWD
dataset the periods are 1984 to 1990 (28 Stations regarding to GEBA) and 1984–2000 (34 Stations).
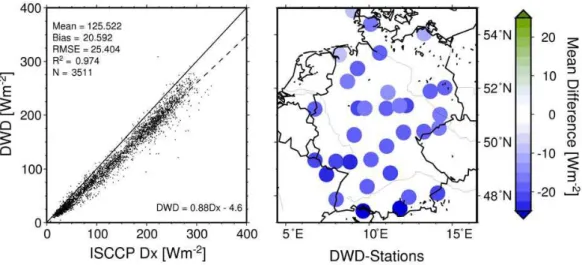
The results are statistically analysed and presented in Fig. 5. The scatterplot (Fig. 5, left) reflects a good agreement for the global radiation at surface derived from ISCCP Dx data and the values directly measured at the GEBA stations within the corresponding ISCCP Dx pixel (30×30 km2). But with increasing global radiation values an increase in scat-tering is visible. The included statistics for the two datasets reveals that over the whole investigation period the RMSE is 25.8 Wm−2 and the bias is about 19.4 Wm−2. Thus, the values of the ISCCP-Dx pixel are on the average 10% higher than the values directly measured at the ground stations also mirrored in the equation for the best linear fit. The differ-ences range from 5–25 Wm−2.
Other investigations are carried out for Germany using the data of the DWD and GEBA. The scatterplot in Fig. 6 il-lustrates that the Dx global radiation and the DWD global radiation match well, but the Dx data are approx. 12% higher
Fig. 6. Monthly global radiation at surface over the period of 1984–1990 for the ISCCP Dx data in comparison with the DWD data of all available gauging stations within the meteorological network of Germany (left) and the mean differences at each station between the Dx and DWD data (right, DWD-Dx).
than the DWD data. Outliers are mainly observed for the IS-CCP Dx data with tendency to be higher than the pyranome-ter measurements. The RMSE and the bias between the two datasets are 25.4 Wm−2and about 20.6 Wm−2respectively.
At the individual stations differences from 10–25 Wm−2
oc-cur.
Analyses regarding observation site measurements of GEBA and DWD show only minor deviations between the datasets. As expected the surface measurements agree and it is assumed that the surface sites of GEBA and DWD are the same.
Among the potential reasons for deviations between satel-lite data and surface measurements, like coarse atmospheric parameterisation within Streamer or changing aerosol con-tents (Garrat, 1994), the target comparison between a point measurement and an area of 30×30 km2is one of the most effective due to land surface heterogeneity. The individual pixels within this section have a resolution of 4–7 km. For each time slice one random pixel is used to describe the con-dition of the whole area. Suboptimal case is that every time an other pixel is chosen to represent a Dx grid cell. An-other problem are the radiances determined onboard satel-lites and in situ because of the different spectral channels of the radiometers. Philipona (2002) assumes in his investiga-tions that unconditioned pyranometer measurements in the past systematically underestimate downward shortwave radi-ant flux density. After an appropriate correction an approx-imation of measured and modelled data could be achieved. Generally the uncertainties of surface measurements should be taken into account for validation.
Completing the survey of surface measurements the an-nual means of global radiation over Germany calculated us-ing the directly measured DWD data (Germany-DWD) and the corresponding ISCCP Dx pixel data (Germany-Dx) over
the whole investigation period are compared and analyses of trends are carried out (Fig. 7). Apart from an average dif-ference of 25 Wm−2 between the two datasets like above mentioned there is a slightly positive trend <1.4 Wm−2for
the Germany-Dx data but a strong positive trend for the Germany-DWD data of 9.1 Wm−2(Fig. 7a) over the period
of 1984–2000. The increase of global radiation at various surface observation sites not only in Germany but also in Eastern and Central Europe since 1990 is also documented as “brightening” in Wild et al. (2005). Potential reason for the weaker increase of Germany-Dx data might be the neglected changes of aerosols absorbing solar radiation over the inves-tigation period above mentioned. Considered separately for each station Fig. 7 (b, c) exhibits irregular positive and neg-ative trends for Germany-Dx and strong positive trends for most Germany-DWD data. Statistically firmed (red circles) is the trend of 10 Wm−2 of only one Germany-Dx station (Fig. 7b) but there are a number of stations with significant trends for Germany-DWD data. Their trends range between 2 and 20 Wm−2. However, it is conspicuously that the firmed
station of Germany-Dx is not proved for Germany-DWD.
3.3 Comparison with model data
A further comparison refers to the results of the regional climate models of the respective partners within the project Quantification of Uncertainties In Regional Climate and Cli-mate Change Simulations (QUIRCS). The mesoscale hydro-static Regional Model (REMO, Jacob and Podzun, 1997; Ja-cob, 2001) and the non-hydrostatic Meteorological Model (MM5, Grell et al., 1995, 2000) are applied. REMO is used by the BTU Cottbus (BTU, REMO 5.0) as well as by the MPI Hamburg (MPI, REMO 5.1) and MM5 is used by the IMK Karlsruhe. These models operate on a different spatial
Fig. 7. (a) Annual station means of global radiation at surface over the period of 1984–2000 for the ISCCP Dx data and the DWD data of all available gauging stations within the meteorological network of Germany, (b), (c) temporal trends over the period of 1984–2000 with statistical significant stations (red circles).
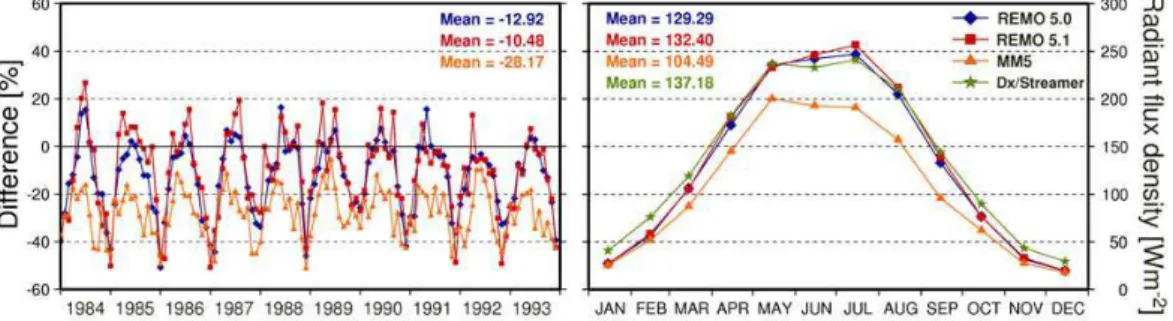
Fig. 8. Monthly differences of global radiation at surface over Germany between the ISCCP Dx data and the results of the regional climate models of the project partners (left: model-Dx) in comparison with the monthly means (right: REMO 5.0 – BTU, blue; REMO 5.1 – MPI, red; MM5 – IFU, orange; Dx/Streamer, green) over the period of 1984–1993.
scale. Hence our results were adapted to the particular avail-able 1/6◦grid (18 km) of the models. The investigation pe-riod of project QUIRCS is 1979–1993 (15 years). Due to the availability of ISCCP D data starting in July 1983 the inves-tigation period is limited to 1984–1993 (10 years). Figure 8 (left) plots the differences of monthly global radiation at sur-face for Germany simulated by regional climate models with respect to our calculated results.
In summertime the REMO output and our results agree well with mean differences of approx. −2 to 4 Wm−2 (−1 to 2%) but in wintertime there are stronger discrepancies be-tween all datasets. Hence the mean annual cycles are exam-ined (Fig. 8, right) and show clearly that our computed global radiation is nearly conform to the results of REMO within the summer months. In winter our results differ on the aver-age 16 Wm−2(27%) from the model results. Largest devia-tions are registered compared to the non-hydrostatic model. The MM5 output is obviously lower, on average 30 Wm−2 (28%). Wild et al. (1995) explain the problem of overesti-mation of global radiation over continents in many climate models amongst others due to an excessive summer dryness.
Hence the good agreement to the REMO results in sum-mertime might also denote an overestimation of the REMO global radiation. Accordingly the humidity in our method seems to be to low and have to be modified.
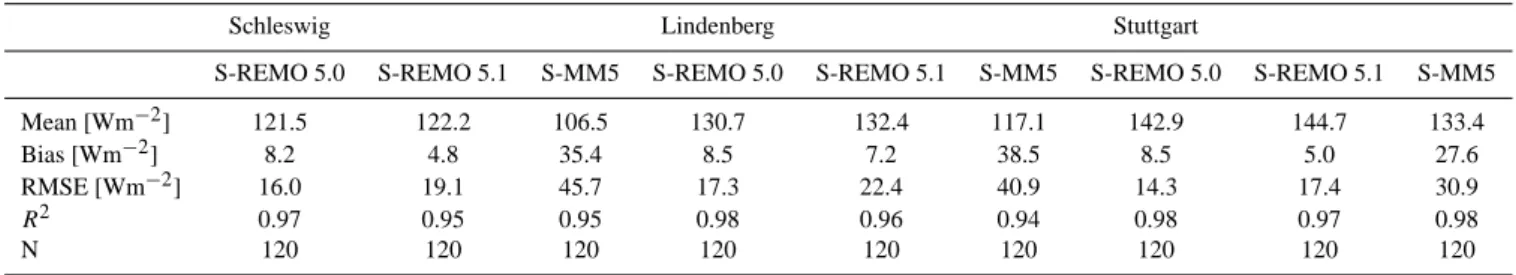
Detailed analyses for the three German regions Schleswig, Lindenberg and Stuttgart each defined by 49 grid cells show similar results. In Fig. 9 the global radiation at surface with reference to our results (Streamer) is demonstrated. The ten-year means of all models for eve-ry region are given in Fig. 9 (right). It becomes obvious that the pattern for each sta-tion is always the same, only the range of values is differ-ent. Thus our results are all the time the highest and the results of the MM5 are permanent smaller than the remain-ing model results. Additionally the dependence on the nat-ural North-South gradient of the global radiation is visible. The scatter plot (Fig. 9, left) shows good agreement between Streamer and REMO 5.0 for all stations with a mean RMSE of 15.9 Wm−2. Larger variances appear between Streamer and REMO 5.1 as well as for Streamer and MM5. Complete results are shown in Table 2.
4 Discussion and conclusion
The global radiation at surface calculated using look-up ta-bles based on radiative transfer calculations with the 1D model Streamer are presented in comparison to a number of data products. Our method describes a technique to han-dle long-time datasets, like ISCCP Dx, with high temporal and spatial resolution. Uncertainties that become apparent in the evaluation with other datasets are caused by assumptions and simplifications using defined constants and increments for the look-up table to determine the shortwave and long-wave radiant flux densities at TOA and at surface. Also data gaps and systematic gaps in the ISCCP Dx dataset intensify these incertitudes.
This study demonstrates the first version of our method that needs to be revised due to the extensive deviations to all compared datasets. The modification of the standardised at-mospheric profiles included in Streamer is planned using the TIROS Operational Vertical Sounder (TOVS) atmospheric dataset (Kidwell, 1995). The variable integration of surface albedo for different land surfaces, mainly for vegetation with seasonal albedo variations, should be implemented. Besides the humidity depending on the five cloud classes and the at-mospheric profiles has to be adjusted.
In general the global radiation exhibits on average higher values over the whole investigation area as well as for spe-cial regions than the products of comparison. Thus the comparison between the satellite data based products re-veal mostly higher values with differences of 5–45 Wm−2 (RMSE=17.7 Wm−2) to the SRB dataset and 5–35 Wm−2 (RMSE=17.1 Wm−2)to the ISCCP FD dataset.
Surface measurements of global radiation for all avail-able stations in Central Europe and in Germany reveal RM-SEs of ca. 26 Wm−2 in relation to our data and biases of ca. 20 Wm−2. That causes a 10–12% higher amount of global radiation at surface for our method. But the compari-son of point measurement versus area measurement is more difficult and hence associated with preassigned uncertainties.
Fig. 9. Comparison of global radiation at surface (left: monthly values; right: 10-year means) for the regions Schleswig, Lindenberg and Stuttgart based on ISCCP Dx data (Dx/Streamer, green) and on the results of the regional climate models of the project partners (REMO 5.0 – BTU, blue; REMO 5.1 – MPI, red; MM5 – IFU, orange) over the period of 1984–1993.
The correction of the bias (approx. 10%) between the Dx and the SRB dataset as well as between the Dx and the IS-CCP FD dataset is carried out (Sommer, 20071). Accord-ingly not only the differences between the several grid cells could be reduced but also the corresponding RMSE values. They are now only one-third of the original values. This im-plicates lower deviations between Dx and SRB as well as between Dx and ISCCP FD than between the SRB and the ISCCP FD dataset (Sommer, 20071). It is difficult to realise this procedure in case of non-linear deviations. Hence it is more reasonable to improve the input for the look-up-table on the physical point of view.
As next step a better solution for replacing the gaps of the original ISCCP datasets and therefor reducing associated un-certainties are sought at present.
1Sommer, M.: Quantifizierung der r¨aumlichen und zeitlichen
Variabilit¨aten des Strahlungsflusses in Europa, Bestimmung mittels ISCCP Daten, Diss., TU Dresden, Institute of Hydrology and Me-teorology, Department of MeMe-teorology, submitted, 2007.
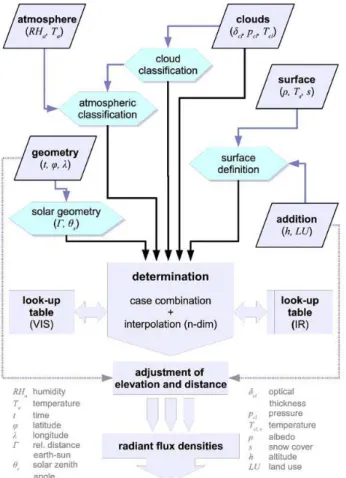
Fig. 10. Schematic diagram of the procedure to determine radiant flux densities using remote sensing data (ISCCP) (Sommer, 20071).
In spite of the demonstrated problems according the data basis and the used method the attained results are valuable because of their highly resolved spatial area-integrated infor-mation over a long investigation period. The produced radi-ant flux density datasets and especially the revised datasets are a solid basis for further improvements and investigations.
Appendix A
The newly developed method for the determination of radi-ant flux densities is based on a modular concept, where the core is the algorithm of determination coupled to the look-up tables.
The ten-dimensional look-up-tables consist of
– atmospheric parameters: standardised atmospheric
pro-file, aerosol model, visibility, humidity
– cloud parameters: cloud class, optical thickness – land surface parameters: land use, albedo, surface
tem-perature and
– solar geometry: solar zenith angle.
Relevant nodes of these individual parameters have been de-fined in order to compute the shortwave and longwave radiant flux densities with Streamer for each parameter combination and its additional information, e.g. the reor the LWC. All re-sults together with their appropriate parameter sets have been tabulated separately for shortwave (VIS) and longwave (IR) radiant fluxes. Unrealistic and very unusual combinations have been filtered out.
Analyses of the ISCCP D datasets regarding the georef-erencing, the gaps and the gap filling are made beforehand (Sommer, 20071).
The input dataset for each pixel of the time series consists of
– the geometry: date, longitude, latitude,
– the cloud properties: optical thickness, pressure, cloud
top temperature
– the surface properties: albedo, temperature, snow cover – the atmospheric properties: humidity, temperature
pro-file and
– additional information: altitude, land use.
It is used to calculate the solar geometry, to define the sur-face type and to classify the clouds and the atmosphere. For each combination of the latter parameters the shortwave and longwave radiant flux densities can be determined using mul-tidimensional linear interpolations between the nodes in the look-up tables (VIS/IR). The interpolations are carried out between 2nnodes, where n is the number of degrees of free-dom (approx. 5–6 degrees of freefree-dom are possible due to the direct coupling of dimensions).
At the end the adjustment of elevation and distance (Earth – Sun) is applied to the estimated shortwave and longwave radiant flux densities. For more details see Sommer (2007)1. The schematic diagram for determination of radiant flux densities is shown in Fig. 10.
Look-up tables yield advantages in terms of reducing the computation time for complete time series of each pixel/grid cell due to the realisation of complex radiative transfer sim-ulations only for relevant parameter combinations. The util-isation of the look-up tables is not only repeatable but also expandable and therefore applicable to different time periods and regions.
References
Augustine, J. A., DeLuisi, J. J., and Long, C. N.: SURFRAD – A National Surface Radiation Budget Network for Atmospheric research, B. Am. Meteorol. Soc., 81, 2341–2357, 2000. Barkstrom, B., Harrison, E., Smith, G., Green, R., Kibler, J., Cess,
R., and the ERBE Science Team: Earth Radiation Budget Exper-iment (ERBE) archival and April 1985 results, B. Am. Meteorol. Soc., 70, 1254–1262, 1989.
Cess, R. D., Zhang, M. H., Minnis, P., Corsetti, L., Dutton, E. G., Forgan, B. W., Garber, D. P., Gates, W. L., Hack, J. J., Harri-son, E. F., Jing, X., Kiehi, J. T., Long, C. N., Morcrette, J.-J., Potter, G. L., Ramanathan, V., Subasilar, B., Whitlock, C. H., Young, D. F., and Zhou, Y.: Absorption of Solar Radiation by Clouds: Observations Versus Models, Science, 267, 496–499, doi:10.1126/science.267.5197.496, 1995.
Darnell, W. L., Staylor, W. F., Gupta, S. K., and Denn, F. M.: Es-timation of Surface Insolation using sun-synchronous Satellite data, J. Climate, 1, 820–835, 1988.
Darnell, W. L., Staylor, W. F., Gupta, S. K., Ritchey, N. A., and Wilber, A. C.: Seasonal variation of surface radiation budget de-rived from International Satellite Cloud Climatology Project C1 data, J. Geophys. Res., 97, 15 741–15 760, 1992.
Evan, A. D., Heidinger, A. K., and Vimont, D. J.: Ar-guments against a physical long-term trend in global IS-CCP cloud amounts, Geophys. Res. Lett., 34, L04701, doi:10.1029/2006GL028083, 2007.
Jacob, D. and Podzun, R.: Sensitivity studies with the regional cli-mate model REMO, Meteorol. Atmos. Phys., 63, 119–129, 1997. Jacob, D.: A note to the simulation of the annual and inter-annual variability of the water budget over the Baltic Sea drainage basin, Meteorol, Atmos. Phys., 77, 61–73, 2001.
Garrat, J. R.: Incoming Shortwave Fluxes at the Surface – A Com-parison of GCM Results with Observations, J. Climate, 7, 72–80, 1994.
Gilgen, H., Wild, M., and Ohmura, A.: Global Energy Balance Archive (GEBA) Report 3: The GEBA Version 1995 Database, Z¨urcher Geographische Schriften 74, 105 pp. (available from In-stitute of Geography ETH, Winterthurerstr. 190, 8057 Zurich, Switzerland), 1997.
Gilgen, H. and Ohmura, A.: The Global Energy Balance Archive (GEBA), B. Am. Meteorol. Soc., 80, 831–850, 1999.
Grell, G. A., Dudhia, J., and Stauffer, D. R.:. A description of the fifth generation Penn State/NCAR mesoscale model (MM5),
Data and Information Service, Washingtion, DC, 394 pp., 1995. Key, J. R.: Streamer Version 3.0 – User’s Guide, NOAA/NESDIS,
70 pp., 2001.
Li, Z., Barker, H. W., and Moreau, L.: The Variable Effect of Clouds and Atmospheric Absorption of Solar Radiation, Nature, 376, 486–490, 1995.
McMillin, L. M.: Evaluation of a Classification Method for Retriev-ing Atmospheric Temperatures from Satellite Measurements, J. Appl. Meteorol., 30, 432–446, 1991.
Ohmura, A., Dutton, E. G., Forgan, B., and Co-Authors: Base-line Surface Radiation Network (BSRN/WCRP): New Precision Radiometry for Climate Research, B. Am. Meteorol. Soc., 79, 2115–2136, 1998.
Pinker, R. T. and Laszlo, I.: Modeling Surface Solar Irradiance for Satellite Applications on a Global Scale, J. Appl. Meteorol., 31, 194–211, 1992.
Pinker, R. T., Frouin, R., and Li, Z.: A Review of Satellite Methods to Derive Surface Shortwave Irradiance, Rem. Sens. Environ., 51, 108–124, 1995.
PRFI: Polar Radiation Fluxes from ISCCP (PRFI) – Procedure De-scription, http://stratus.ssec.wisc.edu/products/d1fluxes/fluxes3. html, 2000.
Rapp, J.: Konzeption, Problematik und Ergebnisse klimatol-ogischer Trends f¨ur Europa und Deutschland, Berichte des Deutschen Wetterdienstes 212, Offenbach am Main, Selbstver-lag des Deutschen Wetterdienstes, 2000.
Raschke, E., Ohmura, A., Rossow, W. B., Carlson, B. E., Zhang, Y. C., Stubenrauch, C., Kottek, M., and Wild, M.: Cloud Effects on the Radiation Budget Based on ISCCP Data (1991 to 1995), Int. J. Climotol., 25, 1103–1125, 2005.
Raschke, E., Bakan, S., and Kinne, S.: An assessment of radiation budget data provided by the ISCCP and GEWEX-SRB, Geophys. Res. Lett., 33, L07812, doi:10.1029/2005GL025503, 2006. Rossow, W. B. and Schiffer, R. A.: ISCCP Cloud data Products, B.
Am. Meteorol. Soc., 72, 2–20, 1991.
Rossow, W. B., Garder, L. C., Lu, P. J., and Walker, A. W.: Interna-tional Satellite Cloud Climatology Project (ISCCP) Documenta-tion of Cloud Data, WMO/TD-266, (revised), World Clim. Res. Progr. (ICSU and WMO), Geneva, 76 pp. plus three appendices, March 1991.
Rossow, W. B. and Zhang, Y. C.: Calculation of Surface and Top of Atmosphere Radiative Fluxes from Physical Quantities Based on ISCCP Data Sets, 2. Validation and first results, J. Geophys. Res., 100, 1167–1197, 1995.
Rossow, W. B. and Zhang, Y. C.: Documentation of Radiative Flux Dataset (FC), http://isccp.giss.nasa.gov/docs/docs fc.html, 1995. Rossow, W. B., Walker, A. W., Beuschel, D. E., and Roiter, M. D.: International Satellite Cloud Climatology Project (ISCCP): Doc-umentation of new cloud Datasets, WMO/TD-No. 737, World climate research Programme (ICSU and WMO), Genf, 1996. Rossow, W. B. and Schiffer, R. A.: Advances in Understanding
Clouds from ISCCP, B. Am. Meteorol. Soc., 80, 2261–2287, 1999.
Schiffer, R. A. and Rossow, W. B.: The International Satellite Cloud Climatology Project (ISCCP): The first project of the World Cli-mate Research Programme, B. Am. Meteorol. Soc., 64, 779–984, 1983.
Stackhouse, P. W., Gupta, S. K., Cox, S. J., Chiacchio, M., and Mikovitz, J. C.: The WCRP/GEWEX Surface Radiation Budget Project Release 2: An assessment of surface fluxes at 1 degree resolution, 2000, in: Current Problems in Atmospheric Radia-tion, International Radiation Symposium, IRS 2000, edited by: Smith, W. L. and Timofeyev, Y. M., St. Petersburg, Russia, 24– 29 July 2000.
Stamnes, K., Tsay S. C., Wiscombe, W., and Jayaweera, K.: Nu-merically Stable Algorithm for Discrete-Ordinate-Method Ra-diative Transfer in Multiple Scattering and Emitting Layered Me-dia, Appl. Opt., 27, 2502–2509, 1988.
Stokes, G. M. and Schwartz, S. E.: The Atmospheric Radiation Measurement (ARM) Program: Programmatic and Design of the Cloud and Radiation Test Bed, B. Am. Meteorol. Soc., 75, 1201– 1221, 1994.
Toon, O. B., McKay C. P., and Ackermann, T. P.: Rapid Calculation of Radiative Heating Rates and Photodissociation Rates in Inho-mogeneous Multiple Scattering Atmospheres, J. Geophys. Res., 94, 16 287–16 301, 1989.
Wielicki, B. A., Barkstrom, B. R., Harrison, E. F., and Co-Authors: Clouds and the Earth’s Radiant Energy System (CERES): Algo-rithm Overview, IEEE T. Geosci. Remote, 36, 1127–1141, 1998. Wild, M., Gilgen, H., Roesch, A., Ohmura, A., Long, C. N., Dutton, E. G., Forgan, B., Kallis, A., Russak, V., Tsvetkov, A.: From Dimming to Brightening: Decadal Changes in Solar Radiation at Earth’s Surface, Science, 308, 847–850, doi:10.1126/science.1103215, 2005.
Wild, M., Ohmura, A., Gilgen, H., and Roeckner, E.: Regional cli-mate simulation with a high resolution GCM: surface radiation fluxes, Clim. Dynam., 11, 469–486, 1995.
Wild, M. and Liepert, B.: Excessive transmission of solar radia-tion through the cloud-free atmosphere in GCMs, Geophys. Res. Lett., 25, 2165–2168, 1998.
Zhang, Y. C., Rossow, W. B., and Lacis, A. A.: Calculation of Surface and Top of Atmosphere Radiative Fluxes from Physical Quantities Based on ISCCP Data Sets, 1. Method and Sensitivity to Input data Uncertainties, J. Geophys. Res., 100, 1149–1165, 1995.