HAL Id: hal-00316750
https://hal.archives-ouvertes.fr/hal-00316750
Submitted on 1 Jan 2000
HAL is a multi-disciplinary open access
archive for the deposit and dissemination of sci-entific research documents, whether they are pub-lished or not. The documents may come from teaching and research institutions in France or abroad, or from public or private research centers.
L’archive ouverte pluridisciplinaire HAL, est destinée au dépôt et à la diffusion de documents scientifiques de niveau recherche, publiés ou non, émanant des établissements d’enseignement et de recherche français ou étrangers, des laboratoires publics ou privés.
Hysteresis of foF2 at European middle latitudes
D. Bure?ová, J. La?tovi?ka
To cite this version:
D. Bure?ová, J. La?tovi?ka. Hysteresis of foF2 at European middle latitudes. Annales Geophysicae, European Geosciences Union, 2000, 18 (8), pp.987-991. �hal-00316750�
Hysteresis of foF2 at European middle latitudes
D. BuresÏovaÂ, J. LasÏtovicÏka
Institute of Atmospheric Physics, BocÏnõÂ II, 141 31 Prague 4, Czech Republic e-mail: [email protected], [email protected]
Received: 24 March 2000 / Accepted: 19 May 2000
Abstract. The hysteresis of foF2 is studied for several European stations over the whole 24-hour diurnal intervalfor the equinoctialmonths of the years just before and just after the solar cycle minimum for solar cycles 20 and 21. Based on previous results, the hysteresis is expected to develop best just for the equinoctial months and near the solar cycle minimum. The hysteresis is generally found to be negative, i.e. higher foF2 for the rising branch compared to the falling branch of solar cycle. However, this is not the case in some individualmonths of some years. The noontime hysteresis represents the hysteresis at other times of the day qualitatively (as to sign) but not quantitatively. The hysteresis appears to be relatively persistent from one solar cycle to another solar cycle in spring but not in autumn. A typicalvalue for springtime hysteresis is about 0.5 MHz. The inclusion of hysteresis into long-term ionospheric and radio wave propagation predic-tions remains questionable.
Key words: Ionosphere (mid-latitude ionosphere; ionospheric disturbances)
1 Introduction
Long-term predictions of foF2 and other ionospheric parameters have traditionally been based on the rela-tionship between the predicted ionospheric parameters and the sunspot number R, or better 12-months running average R12. The reason for this is not a better
correlation of R with foF2 and other parameters, because a better correlation is not the case. The reason is that long-term prediction of R, provided by solar
physicists, is the only long-term solar parameter predic-tion. Some ionospheric prediction codes use ionospheric indices, which characterize solar activity eects on the F-region better than that by R, e.g. MF2 (Mikhailov and Mikhailov, 1995), IF2 (Minnis, 1955), T-index (Turner, 1968), or IG (Liu et al., 1983). However, their long-term prediction is again based on long-term prediction of R.
The dependence of foF2 on R is ``poisoned'' by the phenomenon of hysteresis. For a given station and a constant value of R, foF2 diers for the rising and the falling parts of the 11-year solar cycle. The variation of foF2 monthly medians with R12 over the solar cycle displays a curve likened to the hysteresis variation of a solid material magnetization cycle.
The phenomenon of ionospheric hysteresis has been known for a long time. Rao and Rao (1969) reported its dependence on latitude with the maximum at midlati-tudes and the minima near the equator and at high latitudes. Apostolov and Alberca (1995) analyzed monthly medians of noon foF2 for Slough (52°N, 1°W) over ®ve solar cycles for each month separately. They found negative hysteresis in general, with foF2 higher for the rising than the falling branches of solar cycle. This hysteresis was well pronounced for equato-rialmonths and very weak, if distinguishable, in other months. The strength of hysteresis and its detailed seasonal course diered signi®cantly from cycle to cycle. Apostolov and Alberca (1995) attributed the behaviour of hysteresis to the behaviour of geomagnetic activity throughout the solar cycle. Kouris (1995) found that hysteresis is not stable and not so important for predictions. Therefore the foF2 monthly median pre-diction code, developed by the European Union project COST251 which joined experts from 17 countries, does not include hysteresis (COST251 Final Report, 1999).
In previous investigations, noon monthly medians of foF2 have been used (e.g. Rao and Rao, 1969; Apostolov and Alberca, 1995). The hysteresis is the largest in equinoctialmonths and appears to be associated with geomagnetic activity, which is higher at the falling branch
Correspondence to: J. LasÏtovicÏka e-mail: [email protected]
of the solar cycle in relation to motion of solar activity (sunspots) from higher heliolatitudes towards the helio-equator. Therefore we can expect the most pronounced hysteresis when we compare the equinoctialmonths from late falling and early rising branches of the solar cycle.
Our objective is to investigate the hysteresis of foF2 for severalEuropean stations over the whole 24-hour diurnalintervalfor the equinoctialmonths of years just before and just after the solar cycle minimum for solar cycles 20 and 21. The main aim consists in extending the investigation of hysteresis from the noon throughout the whole 24-hour interval of the day.
2 Observed hysteresis
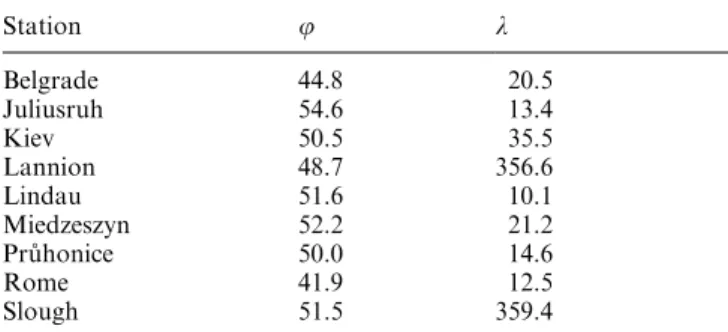
Data from nine European stations altogether have been used: Belgrade, Juliusruh, Kiev, Lannion, Lindau, Miedzeszyn, PruÊhonice, Rome, and Slough. Their geographic coordinates are given in Table 1. A variable number of stations has been used to analyze dierent pairs of years due to variable availability and quality of data. The request was that there would be no data gap in any of the months.
The data from years 1975 and 1985 (just before the solar cycle minimum) versus the data from years 1965 and 1977 (just after the solar cycle minimum) which belong to solar cycles 20 and 21 have been used. The analysis has been performed separately for March, April, September and October for monthly median values at each hour of the day. Solar and geomagnetic activity indices for these months of the given years are presented in Table 2. The solar activity was generally very low, R=3.9±20.1, except for autumn 1997, when it was moderate. The geomagnetic activity was clearly enhanced in March 1975 and April1985.
Three pairs of years have been analyzed in the form of dierences in foF2 for one month at the falling branch minus one month at the rising branch: 1975± 1965, 1975±1977, 1985±1977. The ®rst pair is from solar cycle 20, the third one from cycle 21, and the second pair describes the situation around the solar cycle minimum in 1976. The hysteresis in Slough at noon was weak in cycle 20 and strong in cycle 21 (Apostolov and Alberca, 1995). The results are shown in Figs. 1 and 2 separately for each pair of the years and spring versus autumn. The hysteresis is plotted as the dierence between foF2 for the falling and the rising branches of the solar cycle, which means that the hysteresis is positive if foF2 is higher at the falling branch of the solar cycle.
Figure 1 shows the hysteresis for March and April 1975 versus 1965, 1975 versus 1977, and 1985 versus 1977. For 1975±1965, the diurnalcourse of the hysteresis is very similar for Juliusruh and PruÊhonice and not principally dierent for Belgrade. The hysteresis is negative and quite strong for Apriland negative and less well-marked in March, with no pronounced diurnal variation in April, and the weakest hysteresis is near noon in March. The weaker hysteresis in March is probably caused by the high geomagnetic activity in March 1975 (Table 2), which lowered foF2 values and thus also the hysteresis. For 1975±1977, the hysteresis is negative in both months. In March, it is more negative during daytime that at night, while in April there is no pronounced seasonalvariation of hysteresis. The dier-ences in solar and geomagnetic activity levels are not large enough to substantially aect the hysteresis. For 1985±1977, the hysteresis is negative in March, very weak at night and strong during daytime. Aprilalso provides negative hysteresis but with a dierent diurnal course. The hysteresis is mild with a very strong and narrow peak in early night and a secondary peak in early daytime. The 1985±1977 dierence in solar and geo-magnetic activities cannot substantially aect the hys-teresis either in March or in April.
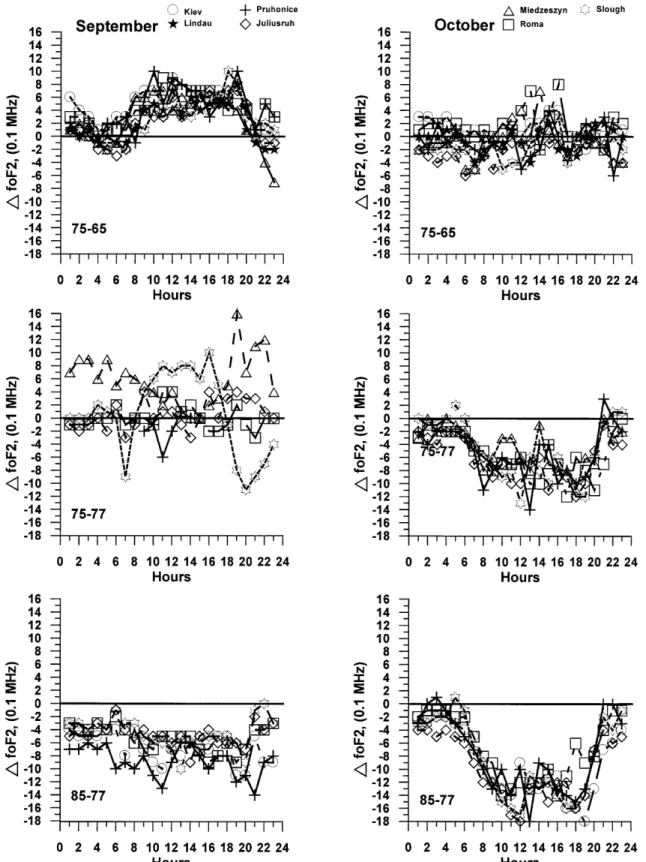
Figure 2 displays the hysteresis for September and October of 1975 versus 1965, 1975 versus 1977, and 1985 versus 1977. For 1975±1965, the hysteresis in September is positive and very strong in daytime but almost disappears at night. Solar and geomagnetic activities in September of 1975 and 1965 are almost identical (Table 2). October does not display any systematic hysteresis and the scatter caused by the dierences in the results of individual stations is rather large. The increase of geomagnetic activity and the decrease of solar activity from October 1965 to October 1975 (Table 2) decrease foF2 in 1975, i.e. they make the asymmetry more negative than for the equallevelof both activities. For 1975±1977, no systematic and persistent hysteresis was observed in September despite a substantially higher level of solar activity (Table 2) in 1977. Therefore, after a correction to the eect of solar activity we should have rather positive hysteresis. Miedzeszyn and Slough pro-vide a rather opposite diurnalcourse of hysteresis, while the three remaining stations agree reasonably well with each other and do not provide any signi®cant hysteresis. October gives negative hysteresis, which almost
Table 1. Geographic coordinates (latitude u, °N; longitude k, °E) of ionosonde stations Station u k Belgrade 44.8 20.5 Juliusruh 54.6 13.4 Kiev 50.5 35.5 Lannion 48.7 356.6 Lindau 51.6 10.1 Miedzeszyn 52.2 21.2 PruÊhonice 50.0 14.6 Rome 41.9 12.5 Slough 51.5 359.4
Table 2. Solar and geomagnetic activity monthly mean indices, R and Ap
R±Ap
Year March AprilSeptember October 1965 11.7±8 6.8±8 16.8±10 20.1±7 1975 11.5±20 5.1±16 13.9±10 9.1±12 1977 8.7±11 12.9±16 44.0±13 43.8±12 1985 17.2±11 16.2±21 3.9±13 18.6±14
Fig. 1. The hysteresis for March (left panels) and April (right panels) of 1975±1965 (top panels), 1975±1977 (middle panels), and 1985±1977 (bottom panels) for selected European stations, expressed as the
dierence between foF2 for falling and rising branches of the solar cycle, dfoF2=foF2 falling ) foF2 rising in 0.1 MHz. Time in UT
disappears in the middle of the night, is at its maximum near sunrise and sunset and well developed during daytime. Solar activity was enhanced in October 1977, as well, which is at least partly responsible for the negative daytime hysteresis. Slough diers again from other stations, mainly at night. For 1985±1977, both
months provide a similar pattern of hysteresis. The hysteresis is negative, rather mild at night and very strong during daytime. The considerably higher solar activity in 1977 made the hysteresis more negative than it should have been but it cannot account for the large daytime hysteresis, particularly in October.
Fig. 2. The same as Fig. 1 for September (left panels) and October (right panels)
3 Discussion
The spring months, March and April, display consis-tently negative hysteresis (Fig. 1). The diurnal course of hysteresis is rather weak, except for March 1985±1977, with pronounced daytime maximum. The typical/repre-sentative value of hysteresis is about 0.5 MHz.
Autumnalmonths provide quite a dierent and internally inconsistent pattern (Fig. 2). Taking into account corrections for dierences in solar and geomag-netic activities, the hysteresis is negative for 1985±1977, weak but rather positive, for 1975±1977, and positive for 1975±1965. The well-developed diurnal course with the maximum of hysteresis during daytime (irrespective of its sign) prevails in most of the months studied.
The noontime hysteresis appears to be suciently representative for most of the spring months studied, even if not for all; see March 1985±1977. However, this is not the case for autumn, when the hysteresis appears to be evidently weaker at night. Consequently, the results of the investigations of hysteresis based on noontime data may be applied to the whole day only qualitatively.
Comparable values of hysteresis at night and during daytime in spring mean that the relative hysteresis is much stronger at night, due to considerably lower foF2 at night. In other words, in spring the physical phenomenon of hysteresis seems to be stronger at night. In general, all European stations used provided similar a pattern of the behaviour of hysteresis with the exception of Miedzeszyn versus Slough in September 1975±1977. Thus the results shown may be considered representative for Europe, except for Northern Europe because its stations have not been included in the data set analyzed and that area is under strong in¯uence from auroralzone processes.
It is dicult to say why there is the dierence in the hysteresis pattern at autumn and in spring, and even whether such a substantial dierence is real. It should be mentioned that the only solar cycle out of the ®ve analyzed for Slough, which did not display negative hysteresis in autumn (September + October), was just the cycle 20 (Apostolov and Alberca, 1995), i.e. 1975± 1965. This is the cycle where we found positive hyster-esis. Thus an analysis of data for more solar cycles is necessary to resolve the question of the dominant sign of hysteresis at autumn. Based on the results of Apostolov and Alberca (1995) and their comparison with our results for solar cycles 20 and 21, the autumnal hysteresis may be expected to be negative.
4 Conclusions
The extension of the investigations of hysteresis to the whole 24-hour daily interval for a couple of
European stations and the equinoctialperiods, to-gether with the long-term investigations of hysteresis for Slough at noon by Apostolov and Alberca (1995), and the results of Kouris (1995), allow us to make the following conclusions for the European midlati-tudes:
1. The hysteresis is developed best in the near-equinoctialmonths; it is better in spring than in autumn. In solstice months it is quite undeveloped (e.g. Aposto-lov and Alberca, 1995).
2. The hysteresis is generally negative, i.e. higher foF2 for the rising branch compared to the falling branch of solar cycle. However, this is not the case in some individualmonths of some years.
3. The noontime hysteresis represents the hysteresis at other times of the day qualitatively (as to sign) but not quantitatively.
4. The hysteresis appears to be relatively persistent from one solar cycle to another solar cycle in spring but not in autumn.
5. The inclusion of the hysteresis into long-term ionospheric and radio wave propagation predictions remains questionable. The hysteresis seems to aect predictions only under lower to low solar activity conditions in near-equinoctialmonths, but at alltimes of day. Its magnitude for spring is estimated to be about 0.5 MHz, i.e. a typicalerror caused by neglecting it would be about 0.3 MHz in foF2. However, the hysteresis is remarkably irregular, particularly in au-tumn, which makes its use in predictions very question-able.
Acknowledgement. TopicalEditor M. Lester thanks L.R. Cander for her help in evaluating this paper.
References
Apostolov, E. M., and L. F. Alberca, foF2 hysteresis variations and the semi-annualgeomagnetic wave, J. Atmos. Terr. Phys., 57, 755±757, 1995.
COST251 Final Report, Ed. R. Hanbaba, 303 pp., Space Research Centre, Warsaw, 1999.
Kouris, S. S., On the hysteresis observed between ionospheric characteristics, Adv. Space Res., 15(2), 143±146, 1995. Liu, R. Y., P. A. Smith, and J. W. King, A new solar index which
leads to improved foF2 predictions using the CCIR Atlas, Telecomm. J., 50, 408±414, 1983.
Mikhailov, A. V., and V. V. Mikhailov, A new ionospheric index MF2, Adv. Space Res., 15(2), 93±97, 1995.
Minnis, C. M., A new index of solar activity based on ionospheric measurements, J. Atmos. Terr. Phys., 7, 310±321, 1955. Rao, M. S. V. G., and R. S. Rao, The hysteresis variation of
geomagnetic Kp indices, J. Atmos. Terr. Phys., 31, 1119±1125, 1969.
Turner, J. F., The development of the ionospheric index T, IPS Series R, Report R11, IPS, 1968.