HAL Id: insu-03132139
https://hal-insu.archives-ouvertes.fr/insu-03132139
Submitted on 5 Feb 2021
HAL is a multi-disciplinary open access
archive for the deposit and dissemination of
sci-entific research documents, whether they are
pub-lished or not. The documents may come from
teaching and research institutions in France or
abroad, or from public or private research centers.
L’archive ouverte pluridisciplinaire HAL, est
destinée au dépôt et à la diffusion de documents
scientifiques de niveau recherche, publiés ou non,
émanant des établissements d’enseignement et de
recherche français ou étrangers, des laboratoires
publics ou privés.
Mid-latitude noctilucent cloud observations by lidar
G. von Cossart, P. Hoffmann, U. von Zahn, Philippe Keckhut, Alain
Hauchecorne
To cite this version:
G. von Cossart, P. Hoffmann, U. von Zahn, Philippe Keckhut, Alain Hauchecorne. Mid-latitude
noctilucent cloud observations by lidar. Geophysical Research Letters, American Geophysical Union,
1996, 23 (21), pp.2919-2922. �10.1029/96GL02768�. �insu-03132139�
GEOPHYSICAL RESEARCH LETTERS, VOL. 23, NO. 21, PAGES 2919-2922, OCTOBER 15, 1996
Mid-latitude noctilucent cloud observations by lidar
G. yon Cossart, P. Hoffmann, U. yon Zahn,
Institut far Atrnosph'firenphysik an der Universit•it Rostock, Germany
P. Keckhut and A. Hauchecorne
Service d'Aeronomie du CNRS, Verderes, France
Abstract. Regular zenith-directed Rayleigh lidar soundings at Juliusruh (54.63øN, 13.38øE) in summer 1995 indicated the pres- ence of overhead noctilucent clouds (NLC) during three nights in June. For two of these nights, NLC were also sighted visually near the northern horizon. For one of the lidar-observed NLC events, temperature profiles were obtained immediately prior to the appearance of the NLC. These show at 81 km a strong cool- ing of about 30 K within two hours. The wind velocity and direc- tion during the NLC events were inferred from daytime com- mon-volume MF radar wind measurements. During the occur- rence of the NLCs the interpolated MF radar wind was
south-westwards directed with velocities between 9 - 32 m/s.
Different from high latitudes, NLCs can be observed by lidar at
mid-latitudes in total darkness. Therefore, mid-latitude observa-
tions hold the promise to allow a characterisation of NLC particle size distributions and particle densities even with comparatively simple, multi-color lidars.
Introduction
Noctilucent clouds (NLC) were first identified as a distinct
atmospheric phenomenon near the end of the nineteenth century by O. Jesse [1885]. This twilight phenomenon appears during the summertime at high to middle latitudes near 83 km. Today it is generally assumed that NLC are formed by water ice particles. This hypothesis is supported by observations of temperatures in the range of 130-150 K in the polar summer mesosphere [van Zahn and Meyer, 1989; van Zahn, 1990]. In the past 110 years, NLCs were observed by a great variety of ground based methods, by rocket experiments, and from satellites. With the first success- ful NLC sounding by a ground based lidar by Hansen et al. [1989], a new active remote sensing approach was available for NLC studies. Since 1991 an increasing number of NLC observa- tions by lidar has been reported from polar and high latitudes [Langer et al., 1995; Thayer and Nilsen, 1995; Labken et al.,
1996; Nussbaumer et al., 1996] and mid-latitudes [Thomas et al.,
1994] as well. Long-term observations of the NLC frequency and brightness by lidar should allow to record climatic changes of the summer mesopause region at mid-latitudes. Visual obser- vations at mid-latitudes of overhead NLC are rare so far. One example is Jesse [1890], who describes visual observations of NLC in the zenith above Berlin (52.5øN, 13.2øE) during the summers from 1885 to 1887. Here we report on lidar measure- ments of three NLC events during summer 1995 at mid-latitudes
near 55øN in connection with simultaneous visual observations of
NLCs near the northern horizon in two cases and with daytime common-volume MF radar wind measurements.
Copyright 1996 by the American Geophysical Union. Paper number 96GL02768
0094-8534/96/96GL-02768505.00
Instruments and data analysis
In November 1993 a Rayleigh lidar (nicknamed HERMES lidar) of the Service d'Aeronomie du CNRS was installed at the field station of the Institute of Atmospheric Physics (IAP) in Juliusrob (54.63øN, 13.38øE), where it is operated by IAP staff. The zenith-directed lidar system samples the elastic backscatter from molecules and aerosols over the altitude range i¾om 15 to 95 km at 75 m spatial resolution. From the elastic backscattering we can deduce the temperature and the backscatter ratio. The system consists of a Nd:YAG laser, transmitting at 532 nm with 500 mJ pulse energy at 30 Hz pulse repetition frequency, a re- ceiving telescope with 0.8 m 2 area, and a two-channel photon counter. The field of view of the telescope is set to 200 grad for the high altitude channel and to 400 grad for the low altitude
channel (for additional details, see Keckhut et al. [1993]).
Here we present the measured lidar backscatter signals after they have been corrected for background, range dependence, and counter saturation. For the description of aerosols we use the
backscatter ratio R(z). It is defined as the ratio of the total to the
molecular backscatter signal
R(z)=
tota•
sign.•(z)
_ g•(z)+
g•(z)
(1)
molecular signM( z) 13• z)
where z denotes the geometric altitude, 13 the volume backscatter coefficient and the subscripts A and M refer to aerosols and
molecules, respectively. Within the NLC layer, 13M is deduced
f¾om air densities taken from the COSPAR International Refer-
ence Atmosphere CIRA 86.
The visual observations of NLCs were done at Arkona, 7.8 km due North of Juliusruh. The observers estimated (a) the time of occurrence, (b) the lowest and highest elevation of the NLC-illuminated area and (c) the azimuth relative to the North of the left and right edges of the illuminated area.
At the Juliusruh field station the IAP also operates a MF
radar for wind observations at mesospheric and lower
thermospheric heights using the FM-CW technique at 3.18 MHz
[Singer et al., 1992]. Applying the spaced antenna method mean wind values are available in height steps of 1.5 km with a time resolution of 30 min. For our investigations, an 83-km-wind
vector was derived from measurements of the altitude range
80-86 km for the zonal and meridional wind directions. Unfortu-
nately, the MF radar wind measurements are limited to daytime
conditions, which in June are typically between 04:30 and 19:00
UT. For a zero-order description of the dynamical situation dur-
ing the (nighttime) NLC events, the wind results derived from
the evening hours before and the morning hours after the NLC
observations (12:00-19:00 UT and 04:30-12:00 UT, respectively)
were jointly analysed: The wind measurements were decomposed
mathematically into a steady wind plus a semidiurnal tide. The
latter is the dominating tide at mesopause heights at mid-lati-
2920 VON COSSART ET AL.' MID-LATITUDE NOCTILUCENT CLOUD OBSERVATIONS BY LIDAR
Table 1. NLC Observations at Juliusruh in June 1995
1995
Date Time [UT] h(• [o] Altitude [km] Signal Strength
Rmax 3/4 June 21:18 - 00:10 -9.7 - -11.8 84.5 - 86.0 2 8/19 June 21:03 - 01:57 -7.5 - -3.9 82.2 - 83.8 20 29/30 June 23:59 - 01:41 -11.5 - -5.7 81.0 - 82.8 18 Mean: 83.4 km
tudes. This decomposition was used to estimate the wind during the periods of NLC observations.
Observations
In the period from May to August, 1995 we had 40 nights with lidar observations. Only during three nights in June, the 3rd, 18th,, and 29th, were enhanced backscatter signals recorded from the altitude range 81-86 km. These enhanced backscatter signals are caused by NLCs overhead at Juliusruh. Table 1 quantifies the
chhracteristics of the detected NLCs: The first column gives the
date of observation; the second column gives the time period of the occurrence of NLCs in UT time and the third the sun eleva- tion (negative below the horizon); the fourth column indicates the altitude range of the aerosol layers; the fifth column quantifies the NLC signal strengths by giving the peak backscatter ratio Rmax. Figure 1 shows the backscatter ratio, R, versus altitude
for the three NLC events. The integration periods for the three
R-profiles are 172, 294, and 102 minutes. The dotted lines in the Figure 1 are the 1-o-statistical noise levels assuming a Poisson distribution for the counts. During the NLC observations, solar elevation angles ranged from-7.5 ø to -3.9 ø . The maximum backscatter ratio, obtained from integration over the entire NLC period, ranges from 2 to 20. For the events of June 03/04 and 18/19 the integration period is identical with the total period of measurements. However, for June 29/30 the observation period is longer than the NLC event.
NLC above Juliusruh in June 1995
88 ?,
.:;:,/04
18/19
86 E 84 •. 82 8o 78 1 r I , I r I , • 29/30 . '" ' i ' " i ' I ' I ' 2 3 5 10 15 20 5 10 15 20 Backscatter Ratio R 88 8682 •
8O 78Figure 1. Backscatter ratios versus altitude for the three NLC events observed at Juliusruh (54.63 ø N; 13.38 ø E) in June 1995. Integration periods for the three profiles are 172, 294, and 102 min, respectively. The dotted lines are the 1 -o-statistical noise levels.
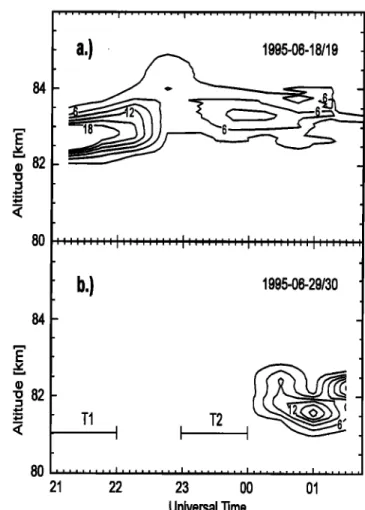
Figure 2 depicts the temporal evolution of the NLC layers on
June 18/19 and 29/30. The contours denote levels of constant
backscatter ratio with R = 3, 6, 9, 12, 15, 18. On June 18/19 the
aerosol layer maintains an almost constant altitude throughout the observation period. The start of the lidar measurements, at 21:18 UT, coincides with the strongest part of the NLC. After- wards the signal strength decreases until the end of measure- ments. The NLC of June 29/30 shows a distinct double layer structure. This NLC was recognized at 23:59 UT by the lidar. The contour plot shows two maxima: the first around 01:00 UT at 81.6 km and after that a second at 82.2 km.
In the case of the June 29/30 NLC it was possible to derive temperature profiles from the Rayleigh backscatter just before the
... I ... I ... ''1 ... I .... '''
a.)
1995-06-18/19
84-ß 82
-
,.= <80 = ', = ;', .... '. ', ', =: '.;: ' ' ', ' = ', ', I I ', ', ', '. = '. '. ', ',:: ', • '.;;;;; •
b.)
1995-06-29/30
84- - E82
•,
T1
I
I
T2
I
2' 22 23 O0 01 Universal TimeFigure 2. Contour plots of the backscatter ratio R, versus time and altitude for the NLC events of June 18/19 (panel a) and June 29/30, 1995 (panel b). Bars T1 and T2 mark the time periods of temperature determination. The contour lines represent levels
VON COSSART ET AL.' MID-LATITUDE NOCTILUCENT CLOUD OBSERVATIONS BY LIDAR 2921 90 <c
50
Jun
TI:•
20:50
- 21:59
UT /"'"'
40
... T2,
30 ,---,---,---,---,---,--- 160 180 200 220 240 260 280Temperature [K]
Figure 3. Temperature profiles with error bars for different time
periods of the night of June 29th, 1995 obtained from integration
of the lidar measured density profiles before the occurrence of the NLC event.
occurrence of the NLC layer. In Figure 2 the bars T1 and T2 mark the integration periods which were used to derive the two
temperature profiles. Figure 3 depicts these temperature profiles
and error bars at 74 and 80 km. The integration period for each
profile is about 1 hour. The solid line profile is centred at 21:24
UT and the dotted line profile at 23:27 UT. The profiles indicate
(a) a cooling at 81 km of about 30 K over two hours immedi-
ately before the formation of NLC and (b) a tendency for de-
creasing temperatures towards the NLC altitudes.
During the nights of June 18th, and 29th noctilucent clouds were also visually observed at the northern horizon from the nearby weather station Arkona between 21:30-00:15 UT and 21:15-01:00 UT, respectively. The slowly varying observation angles of the NLCs were within the azimuth of 330 ø to 60 ø and
330 ø to 70 ø and the elevation within 3 ø - 13 ø and 4 ø - 11 ø, respec-
tively.
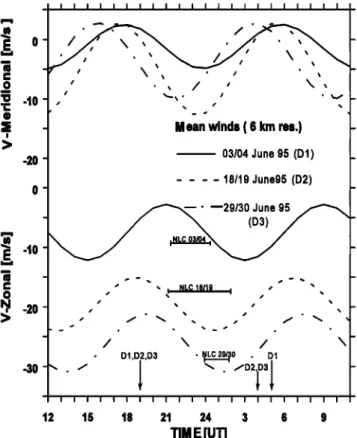
Figure 4 shows the variations of the zonal and meridional
wind components at 83 km derived from the MF radar daytime
measurements in the way described above. The bars in the lower
part of the figure mark the NLC observation periods and the
arrows the border between daytime measurements and interpo-
lated wind values. The occurrence of NLCs was coupled with
south-westwards directed wind values between 9-32 m/s.
Discussion
The observed three NLC events depicted in Figure 1 show a somewhat unexpected spread of their altitudes. Their mean alti- tude is 83.4 km, which is close to the climatological mean NLC
altitude of 82.9 km [Jesse, 1890; Gadsden and SchrOder, 1989]. However, the layer at June 3/4 is abnormal in the following ways: Its peak backscatter ratio R = 2 is exceedingly small in comparison to other lidar-observed NLC layers and its peak
altitude of 85.1 km is unusually high. Liibken et al. [1996] report
about a similar lidar NLC observation with a peak backscatter ratio R = 5 in an altitude of 87.5 km during the night of August 7/8, 1993. We suggest that these are cases of evolving NLCs which sediment downwards from the nucleation region (mesopause) while at the same time a few of the cloud particles grow to visible size. Consideration might be given to removing it from the altitude statistics because of its abnormality. The re- maining two layers would have a mean altitude of 82.45 km. The mean altitude of all NLC observations at mid-latitudes including two lidar measurements by Thomas et al. [1994] is 83.5 km. Since 1989 a total number of 20 NLC events at polar latitudes (mean: 68.5øN) were observed with lidar systems with a mean altitude of 82.8 km. Both values are close to the climatological
mean NLC altitude of 82.9 km. It seems that the mean altitude of
NLCs is independent of the latitude and the epoch.
The summer period of NLC events and, by implication, that of very low mesopause temperatures, appears to be shorter at mid-latitudes than that at high or polar latitudes. At mid-latitudes
we observed NLC between June 3 and June 30, while Thomas et
al. [1994] observed NLC at 52.4øN between June 21 and July 5.
These dates cluster much closer about summer solstices than
those of NLCs observed at high and polar latitudes. The latter period extends from the beginning of June until the middle of August. • -10 - • - ! > -20 - _ 1 • - o
..• -20
-
-30- I I I I I I I I I I I I I I I I I I I I I I / % _.,Mean winds ( $ krn res.)
03/04 June 95 (D1) 18/19 June95 (D2)
ß
• •1 NLC
18/1g
- ? \ • f • fD2 3 12 15 18 21 24 3 6 9 TIM E [u'rJFigure 4. Meridional and zonal wind components measured by the Juliusruh MF radar during daytime and interpolated over the nights. The altitude of the analysis is 83 km. The bars mark the periods of NLC observations and the arrows the borders between MF daytime measurements and interpolated nighttime values.
2922 VON COSSART ET AL.: MID-LATITUDE NOCTILUCENT CLOUD OBSERVATIONS BY LIDAR
In June of 1995 the weather station Arkona observed eight
NLC events, all close to the northern horizon. During five peri-
ods of visual NLC sightings, the zenith-directed lidar was in operation, but did not observe a NLC layer. One visual NLC was
obtained without simultaneous lidar measurements and one lidar
observation of NLC was without visually observed NLC. During
the occurrence of the three NLC events the interpolated MF radar
wind was typically south-westwards directed with velocities
between 9 - 32 m/s as shown in Figure 4 which agrees with
observations of Jesse [1890] and Nussbaumer et al. [1996].
There are some hints to a connection between the occurrence of
NLC and a distinct behaviour in the amplitudes of the semidiur-
nal tides, which are not shown here. These investigations require
a larger data set of simultaneous visual and lidar NLC observa-
tions combined with mesospheric wind measurements. We sug-
gest that we have observed NLC clouds drifting through our
measuring field of view. Particularly the course of the observa-
tion of the night of June 29th support this concept: at 21:15 UT
a NLC is visually observed at the northern horizon, the MF radar
derived south-westwards directed wind speed ranges between
10-26 m/s, the temperature at 80 km altitude is about 217 K, 2.5
hours before the occurrence of the distinct NLC layer in the lidar
signal. Within two hours the temperature in 80 km is cooled to
about 168 K and a half hour later an increased backscatter ap-
pears in the lidar signal. Liibken et al. [1996] 'have shown that the lower edge of polar NLCs always falls close to the 150 K
level. There is little reason to believe that this temperature is
much different at mid-latitudes. Hence, observation of NLC at
mid-latitudes indicates that even there in summer temperatures in
the upper mesosphere fall at times below 150 K. However, low temperatures may not be the only required ingredient tbr NLC events. Probably, the clouds are not formed at mid-latitudes, however, because this would need temperatures near 130 K for many hours. More likely, they are advected into the lidar field-of-view from higher latitudes. For this to happen, a required ingredient is a reasonably strong meridional (southward) wind just below the mesopause level.
Mid-latitude NLC observations offer interesting possibilities to study NLC-related phenomena. Some derive from the fact that, in contrast to polar latitudes, NLC can be observed in total dark- ness at mid-latitudes. This will permit to study the NLC particle density and size distribution with multi-color lidars, but without expensive spectral filtering for each color at the detector bench of the lidar. Further, even rather faint NLC can be observed, hope- fully improving our knowledge about the life-cycle of NLC parti- cles. The frequency and brightness of NLCs are strongly depen- dent on the thermal structure of the mesopause and the ambient water vapour mixing ratio. Hence, long-term NLC observations
will support searches for trends in upper mesosphere tempera- tures, humidity, and/or dynamics.
Acknowledgments: The authors wish to thank J. Weiss and J.
Mielich for the operation of the HERME S lidar at Juliusruh, D. Keuer for
the
operation
of the
MF
radar,
U. Feist•'for
NLC
data
taken
visually
at
the Arkona station of the German Weather Service (DWD) and A. Ebel
and J. Roettger for fruitful discussions. The HERMES lidar was devel- oped in collaboration between CNRS, CNES/ESA, and SESO. References
Gadsden, M. and W. Schr6der, Noctilucent Clouds, Springer-Verlag, Berlin, Heidelberg, New York 1989.
Hansen, G., M. Serwazi, and U. von Zahn, First detection of a noctilu-
cent cloud by lidar, Geophys. Res. Lett., 16, 1445-1448, 1989. Jesse, O., Auffallende Abenderscheinungen am Himmel, Meteorol. Z., 2,
311-312, 1885.
Jesse, O., Untersuchungen tiber die sogenannten leuchtenden Wolken, Sitzungsber. Preuss. Akad. Wiss., Phys.-Math. Kl. v. 31. Juli,
1031-1041, 1890.
Keckhut, P., A. Hauchecorne, and M.L. Chanin, A critical review of the
database acquired for the long-term surveillance of the middle atmo- sphere by the French Rayleigh lidars, J. Atmos.. Ocean. Techn., 10,
850-867, 1993.
Langer, M., K.P. Mtiller, and K.H. Fricke, Rayleigh lidar detection of
aerosol echoes from noctilucent cloud altitudes at Arctic circle, Geophys. Res. Lett., 22, 381-384, 1995.
Ltibken, F.-J., K.H. Fricke, and M. Langer, Noctilucent clouds and the thermal structure near the Arctic mesopause in summer, J. Geophys.
Res., 101, 9489-9508, 1996.
Nussbaumer, V., K.H. Fricke, M. Langer, W. Singer, and U. von Zahn,
First simultaneous and common-volume observations of NLC and
PMSE by lidar and radar, J. Geophys. Res., 101, August 27, 1996.
Singer, W., P. Hoffmann, D. Keuer, R. Schminder, and D. Kiirschner,
Wind in the middle atmosphere with partial reflection measurements during winter and spring in middle Europe, Adv. Space Res., 12, Vol.
10, 299-302, 1992.
Thayer, J.P., N.B. Nielsen, and J. Jakobson, Noctilucent cloud observa-
tions over Greenland by a Rayleigh lidar, Geophys. Res. Lett.. 22,
2961-2964, 1995.
Thomas, L., A.K.P. Marsh, D.P. Wareing, and M.A. Hassan, Lidar obser- vations of ice crystals associated with noctilucent clouds at middle latitudes, Geophys. Res. Lett., 21, 385-388, 1994.
von Zahn, U., and W. Meyer, Mesopause temperature in polar summer,
J. Geophys. Res., 94, 14647-14651, 1989.
von Zahn, U., Temperature and altitude of polar mesopause in summer, in "COSPAR International Re. ference Atmosphere: 1986; Part 2: Middle Atmosphere Models", edited by D. Rees, J.J. Barnett, and K. Labitzke, Pergamon Press, p. 223-231, 1990.
G. von Cossart, P. Hoffmann, and U. von Zahn, Institut far
Atmosphfirenphysik an der Universitfit Rostock, Schlogstr. 4-6, D-18225 Ktihlungsborn, Germany. (e-mail: [email protected])
P. Keckhut and A. Hauchecorne, Service d'A6ronomie du CNRS, BP
N ø 3, F-91371 Vem•res le Buisson Cedex, France.