HAL Id: hal-00303099
https://hal.archives-ouvertes.fr/hal-00303099
Submitted on 14 Sep 2007HAL is a multi-disciplinary open access
archive for the deposit and dissemination of sci-entific research documents, whether they are pub-lished or not. The documents may come from teaching and research institutions in France or abroad, or from public or private research centers.
L’archive ouverte pluridisciplinaire HAL, est destinée au dépôt et à la diffusion de documents scientifiques de niveau recherche, publiés ou non, émanant des établissements d’enseignement et de recherche français ou étrangers, des laboratoires publics ou privés.
Attenuation of global ultraviolet and visible irradiance
over Greece during the total solar eclipse of 29 March
2006
A. Kazantzidis, A. F. Bais, C. Emde, S. Kazadzis, C. S. Zerefos
To cite this version:
A. Kazantzidis, A. F. Bais, C. Emde, S. Kazadzis, C. S. Zerefos. Attenuation of global ultraviolet and visible irradiance over Greece during the total solar eclipse of 29 March 2006. Atmospheric Chemistry and Physics Discussions, European Geosciences Union, 2007, 7 (5), pp.13475-13501. �hal-00303099�
ACPD
7, 13475–13501, 2007 Attenuation of irradiance during solar eclipse A. Kazantzidis et al. Title Page Abstract Introduction Conclusions References Tables Figures ◭ ◮ ◭ ◮ Back CloseFull Screen / Esc
Printer-friendly Version Interactive Discussion
EGU
Atmos. Chem. Phys. Discuss., 7, 13475–13501, 2007 www.atmos-chem-phys-discuss.net/7/13475/2007/ © Author(s) 2007. This work is licensed
under a Creative Commons License.
Atmospheric Chemistry and Physics Discussions
Attenuation of global ultraviolet and
visible irradiance over Greece during the
total solar eclipse of 29 March 2006
A. Kazantzidis1, A. F. Bais1, C. Emde2, S. Kazadzis1, and C. S. Zerefos3 1
Laboratory of Atmospheric Physics, Aristotle University of Thessaloniki, Thessaloniki, Greece
2
Institut f ¨ur Physik der Atmosph ¨are, Deutsches Zentrum f ¨ur Luft- und Raumfahrt (DLR), Oberpfaffenhofen, 82234 Wessling, Germany
3
National Observatory of Athens, Athens, Greece
Received: 7 August 2007 – Accepted: 10 September 2007 – Published: 14 September 2007 Correspondence to: A. Kazantzidis ([email protected])
ACPD
7, 13475–13501, 2007 Attenuation of irradiance during solar eclipse A. Kazantzidis et al. Title Page Abstract Introduction Conclusions References Tables Figures ◭ ◮ ◭ ◮ Back CloseFull Screen / Esc
Printer-friendly Version Interactive Discussion
EGU Abstract
The variability of ultraviolet and photosynthetically active radiation during the total so-lar eclipse of 29 March 2006 was examined in this study. The measurements from NILU-UV multichannel actinometers at 7 stations of the Greek UV Network were used, where the maximum eclipse percentage ranged from 73.1% to 94.8%. In addition,
5
an extra instrument was established at a remote Greek island, Kastelorizo, which was within the Moon’s umbral shadow. The measured changes in UV and visible irradiance were compared with 1-D model calculations (accounting for the limb darkening effect) and differences up 30% were observed for the lower UV wavelengths at high eclipse percentages. The spectral ratios between wavelengths was generally reproduced by
10
the 1-D model, expect for 305 nm, where the irradiance at eclipse percentages of more than 85% decreased with slower rates than for longer wavelengths. As a result, the total ozone, derived from the 305/320 nm ratio, apparently decreased significantly for high eclipse percentages. Comparison results with 3-D model calculations approach-ing and durapproach-ing totality revealed an agreement with measurements in the UV-A region.
15
1 Introduction
The variability of surface solar irradiance during a solar eclipse due to the change in atmospheric conditions and the limb darkening effect has been extensively inves-tigated (e.g. Sharp et al., 1971; Silverman and Mullen, 1975; Fernadez et al., 1991; Mikhalev et., 1999; Zerefos et al., 2000 and 2001; Koepke et al., 2001). Sharp et
20
al. (1971) presented a selected group of sky brightness measurements during total solar eclipses. They reported that although the brightness could be represented with reasonable accuracy for solar eclipse percentages up to 99.8%, the effect of multiple scattering from outside the umbral region dominate the sky brightness during totality. Mikhalev et al. (1999) suggested that the variability of ultraviolet irradiance close to the
25
ACPD
7, 13475–13501, 2007 Attenuation of irradiance during solar eclipse A. Kazantzidis et al. Title Page Abstract Introduction Conclusions References Tables Figures ◭ ◮ ◭ ◮ Back CloseFull Screen / Esc
Printer-friendly Version Interactive Discussion
EGU
radiation. Zerefos et al. (2000) reported that the rate of decline in the diffuse irradi-ance is slower than in the direct irradiirradi-ance as the eclipse progresses. This effect is more pronounced at shorter wavelengths and could be explained by the contribution of multiple scattering radiation originating from surrounding areas that are shadowed less than the location where the measurements are conducted. Kazadzis et al. (2007),
5
concluded that global and direct irradiance measurements were spectrally affected by the limb darkening during the eclipse, leading to wavelength dependent changes in the measured solar spectra.
The spectral variability of solar irradiance stimulated the development of methods and algorithms in order to simulate this effect. Shaw et al. (1978) developed a
simpli-10
fied radiative transfer model for estimating the brightness, or the radiance, of the sky during a total solar eclipse and predicted quite well the major observed features of the sky under the eclipse. More recently, Koepke et al. (2001) modeled the spectral varia-tion of the extraterrestrial solar flux during a solar eclipse taking into account the limb darkening effect and concluded that this effect reaches a maximum of 30% at 1500 nm,
15
and of 60% at 310 nm. The modified extraterrestrial spectrum was used in a 1-D ra-diative transfer model and the results were in good agreement when compared with measured radiation quantities. Much more accurate results were reported by Emde and Mayer (2007). They used a backward 3-D Monte Carlo method in order to simu-late the effect of multiple scattering on irradiance and radiance in the umbral shadow.
20
They reported that, compared with 1-D model results, the irradiance is larger in the 3-D calculations because of more accurate treatment of multiple scattering. Using the atmospheric and eclipse conditions at the Kastelorizo, Greece, in the Eastern Mediter-ranean, they concluded that 10 min ahead and after the totality the relative difference between the two models is less than 1%.
25
The uncertainties associated with the characterization of the radiation field during a solar eclipse, especially in the shorter UV-B wavelengths, and those associated with changes in the atmospheric conditions, especially with respect to ozone, resulted in different and sometimes contradicting conclusions on the effects of the eclipse on the
ACPD
7, 13475–13501, 2007 Attenuation of irradiance during solar eclipse A. Kazantzidis et al. Title Page Abstract Introduction Conclusions References Tables Figures ◭ ◮ ◭ ◮ Back CloseFull Screen / Esc
Printer-friendly Version Interactive Discussion
EGU
ozone column (e.g. Bojkov, 1968; Mariolopoulos et al., 1977; Mim and Mims, 1993; Chakrabarty et al., 1997 and 2001; Zerefos et al., 2000; Winkler et al., 2001). Mea-surements with a Dobson spectrophotometer revealed either increase (e.g. Bojkov, 1966) or decrease (Chakrabarty et al., 1997) of total ozone during the eclipse. Zerefos et al. (2000) investigated the changes in the ozone column measurements with Brewer
5
and Dobson spectroradiometers from six European sites during the solar eclipse of 11 August 1999. In all cases, the observed increase in the measured total ozone by more than 10% close to the eclipse maximum was considered as artificial, attributed to the increasing contribution of the diffuse radiation during the course of the eclipse. Similar results were reported also Kazadzis et al. (2007). Winkler et al. (2001) reported
contra-10
dicting results from Brewer and Microtops ozone measurements at Hohenpeissenberg during the total solar eclipse of 11 August 1999. Chakrabarty et al. (2001) suggested that the observed ozone variability over India during the eclipse of 24 October 1995 could not be explained by the variations in the rates of conventional photochemical and dynamical processes or by the formation of gravity waves during the eclipse.
15
In this study measurements from multi channel radiometers comprising the Greek UV monitoring network were used to investigate the variability of the ultraviolet and the photosynthetically active radiation (PAR) during the total solar eclipse of 29 March 2006. These measurements were compared with 1-D model estimates for the duration of the eclipse except from the period close and during the totality, and with 3-D model
20
estimates during the totality. Finally, the variations in the ozone column derived from the multi channel radiometers during the eclipse are presented and discussed for the first time.
2 Instrumentation and data
The Greek UV monitoring network was designed to cover geographically Greece and
25
Cyprus, with nine stations distributed at locations with different environments. At the central station, located in Thessaloniki, a suite of spectral and broadband radiation and
ACPD
7, 13475–13501, 2007 Attenuation of irradiance during solar eclipse A. Kazantzidis et al. Title Page Abstract Introduction Conclusions References Tables Figures ◭ ◮ ◭ ◮ Back CloseFull Screen / Esc
Printer-friendly Version Interactive Discussion
EGU
other related measurements are also available. The network is equipped with NILU-UV multi-channel radiometers, providing UV irradiance measurements at five wavelength bands centered at 305, 312, 320, 340 and 380 nm, with full width at half maximum (FWHM) of approximately 10 nm. A sixth channel is used for the measurement of pho-tosynthetic active radiation between 400–700 nm. Technical details for these
instru-5
ments can be found in Hoiskar et al. (2001). Before the deployment of the instruments at the different sites, all channels were characterized as to their spectral response with a powerful 10 000 W xenon lamp and a double monochromator. Following the deconvo-lution procedure suggested by Bernhard et al. (2005), the calibration factors to convert the measured signals to spectral irradiance at the central wavelength of each channel
10
were calculated. The absolute calibration factors were determined by comparison to the spectral irradiance measurements from a double monochromator Brewer spectro-radiometer #086, operating at Thessaloniki, according to the methodology described in Dahlback (1996).
In March 2006, only seven of the stations were in operation. At these stations the
15
maximum of the eclipse percentage ranged from 73.1% to 94.8% (see Table 1). An extra station was established as part of a two-day experimental campaign at the Greek island of Kastelorizo, Kazadzis et al. (2007), which was located inside the track of the total eclipse of 29 March 2006. The geographical positions of all stations, as well as the path of the Moon’s umbral shadow, are shown in Fig. 1. All stations are located at
20
altitudes below 200 m except from Ioannina, which is located 500 m a.s.l.
During the day of the eclipse all instruments were sampled every second and the data were recorded at this frequency, while regularly their measurements are recorded as one-minute averages. The original, high frequency, measurements were used only in studying the effect of the eclipse during totality at Kastelorizo. One minute
aver-25
ages have been calculated and used in all other cases, for the purpose of comparison with measurements in previous days. The irradiance measurements at all sites during the period of the eclipse correspond to solar zenith angles ranging between 31◦ and
ACPD
7, 13475–13501, 2007 Attenuation of irradiance during solar eclipse A. Kazantzidis et al. Title Page Abstract Introduction Conclusions References Tables Figures ◭ ◮ ◭ ◮ Back CloseFull Screen / Esc
Printer-friendly Version Interactive Discussion
EGU
considered negligible (Kazantzidis et al., 2006).
Absolutely calibrated irradiance measurements at 305, 312 and 320 nm were used only for deriving total ozone, following the methodology described by Dahlback (1996), using one-minute averages of the irradiance ratios 305/320 and 312/320 nm. Irradiance measurements below 10 times the dark signal have not been used in order to minimize
5
the noise in the retrieved ozone columns. The calculated ozone column was found to range for all stations between 285 and 355 DU.
Clouds interfere with the irradiance measurements, as to a certain extend they mask the effects of the eclipse, and complicate the interpretation of the measurements. In Thessaloniki and Kastelorizo the cloud observations were conducted by the operators
10
of the instruments, while in all other stations the meteorological reports from the nearby airports were used. These reports are made every 30 or 60 min, thus they are not fully representative of the cloud conditions that may change between observations. In none of the sites the sky was clear during the eclipse. Few (1–2 octas) or scattered (3– 4 octas) cumulus clouds have been reported for most of the time, and occasionally,
15
especially during the second phase of the eclipse, scattered or broken (5–7 octas) cirrus clouds. An exception is Nicosia, Cyprus, where the sky was rather clear during the second phase. Table 2 summarizes for all sites the cloud conditions close to the eclipse maximum.
3 Narrowband irradiance measurements and model calculations
20
3.1 Irradiance measurements
The change in surface irradiance during the eclipse at different wavelengths is investi-gated using the irradiance data from the NILU-UV radiometers. To eliminate changes that have been introduced by the changing solar zenith angle during the eclipse, we normalized the irradiance measurements with measurements during the closest to the
25
ACPD
7, 13475–13501, 2007 Attenuation of irradiance during solar eclipse A. Kazantzidis et al. Title Page Abstract Introduction Conclusions References Tables Figures ◭ ◮ ◭ ◮ Back CloseFull Screen / Esc
Printer-friendly Version Interactive Discussion
EGU
27 March and 2 April, thus we matched the measurements in the two days with respect to the time of the measurements and not with respect to SZA. The change in the solar zenith angle for the same time between these consecutive days is very small, taking into account that the actual SZA at all stations was relatively small (between 31◦ and
44◦). Assuming that the instruments’ sensitivity remained stable during such a short
5
period the ratios were formed from the raw data, after removal of the dark signal. The ratios vary among stations by up to 9% at 380 nm, and up to 25% at 305 nm. These differences are attributable to changes in the aerosol abundance and, for the UV-B channels, in addition to changes in the ozone column. Measurements of the aerosol optical depth were available only at Thessaloniki and Kastelorizo, while total
10
ozone was available at all sites. Generally, the total ozone differences between the day of the eclipse and the corresponding cloud-free day for each site were less than 15%. Model calculations for a typical total ozone column (330 DU) and aerosol optical depth (0.4 at 340 nm) showed that the effect of a 15% difference in total ozone on the irradiance at 305, 312 and 320 nm is respectively 10%, 1% and 0%, for the range of
15
the solar zenith angles during the period of the eclipse (31◦to 44◦).
The ratios were then normalized with their corresponding average over the cloud-free 5 min period closest to the beginning of the eclipse. Thus all ratios are brought to the same scale, allowing direct comparisons between different channels. The normal-ization reduces partly the effect of the changes in total ozone between the two days;
20
therefore at the shorter wavelengths ozone variations during the day are still influencing the irradiance.
3.2 Model calculations
Irradiance calculations in the UV and visible part of the spectrum during the eclipse were performed with the UVSPEC radiative transfer model (Mayer and Kylling, 2005).
25
The radiative transfer equation is solved using the pseudo-spherical discrete ordinates algorithm (Dahlback and Stamnes, 1991) running with 16 streams and the spectral ir-radiance was calculated from 280 up to 700 nm with 1 nm steps and resolution. The
ACPD
7, 13475–13501, 2007 Attenuation of irradiance during solar eclipse A. Kazantzidis et al. Title Page Abstract Introduction Conclusions References Tables Figures ◭ ◮ ◭ ◮ Back CloseFull Screen / Esc
Printer-friendly Version Interactive Discussion
EGU
vertical profile of aerosols by Elterman (1979) was scaled to the aerosol optical depth of 0.4 at 340 nm, and an Angstrom exponent of 1.3 was used for its spectral depen-dence. While these values are typical for Thessaloniki (Kazadzis et al., 2006), they are realistic also for the sites where no aerosol measurements were available. The same aerosol optical depth was measured at Kastelorizo on the day of the eclipse (Kazadzis
5
et al., 2007). A doubling of the aerosol optical depth at 340 nm from 0.4 to 0.8 for the largest during the eclipse solar zenith angle (44◦) and the highest measured total ozone
(355 DU) would result in a decrease in the modeled irradiance by 15% at 305 nm, down to 6% for PAR. The corresponding effect on the spectral ratios would have been be-tween –4.5% (for the ratio 305/380 nm) and 5% (for the ratio of PAR/380 nm). Finally,
10
the effect on the calculation of total ozone from the irradiance would have been about 1.4%.
Typical values for the aerosol single scattering albedo (ω=0.95) and the asymmetry factor (g=0.7) were used for all wavelengths and were assumed constant with altitude. AFGL midlatitude winter vertical profiles for air density, ozone and temperature were
15
used (Anderson et al., 1986) and the surface albedo was set to 0.05, independent of wavelength. The Atlas-3 spectrum was chosen as the extraterrestrial solar flux. The modification of solar extraterrestrial irradiance due to the coverage of the solar disk was calculated by the formulas adapted from Koepke et al. (2001). These formulas provide the relative effect of the eclipse on each wavelength in the UV and visible regions for
20
Sun coverage up to 99%.
In order to compare model calculations with measurements, the calculated spec-tra were convoluted with a generic specspec-tral response for each channel. The effect of the differences among the spectral responses of the instruments was estimated to less than 1%. Then, the spectral irradiances were normalized with the calculated
ir-25
radiances for non-eclipse conditions. A sensitivity study on modeled convoluted spec-tra (using the real and not a generic response for each instrument) revealed that the normalized channel ratios were independent (less than 0.05% difference) for all so-lar zenith angles (31 to 44 degrees) and measured total ozone abundances (285 to
ACPD
7, 13475–13501, 2007 Attenuation of irradiance during solar eclipse A. Kazantzidis et al. Title Page Abstract Introduction Conclusions References Tables Figures ◭ ◮ ◭ ◮ Back CloseFull Screen / Esc
Printer-friendly Version Interactive Discussion
EGU
355 DU) during the eclipse of 29 March.
4 Effect of solar eclipse on surface solar irradiance
The decrease in spectral irradiance during the eclipse was examined for all NILU-UV channels. The data from sites 6 through 8 are presented together because of higher percentages of eclipse and better exposure conditions, due to reduced cloudiness. In
5
the following we present changes in the irradiance ratios as a function of the percentage of the visible part of the solar disk, according to the formulas described in Espenak and Anderson (2004). The value of 0 corresponds to the totality of the eclipse, while the values of –100 and +100 correspond to the beginning and the end of the eclipse respectively.
10
4.1 UV-B irradiance
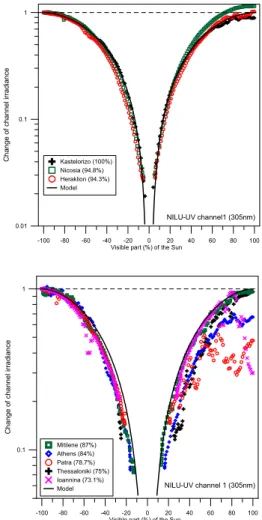
Figure 2 shows the change in spectral solar irradiance at 305 nm, which appears to vary non-linearly with the visible part of the sun. For high percentages of the visible fraction of the Sun irradiance decreases rather slowly. The rate of decrease becomes faster when approaching the totality. At Kastelorizo, Nicosia and Heraklion the solar
15
irradiance at 305 nm is almost 50 times weaker when the Sun coverage is about 94%, compared to the irradiance at non-eclipse conditions. For Kastelorizo the data for higher than 96% coverage were excluded, because of the low signal to noise ratio (less than 10).
The increased cloudiness close to the maximum and during the second phase of
20
the eclipse at sites 1–5 has evidently influenced the irradiance measurements (see Fig. 2, lower panel). This could be a reason for the larger differences in the measured changes with respect to the model estimates. Deviations in change of irradiance from unity at and after the end of the eclipse are attributed to changes in total ozone and in the aerosol properties relatively to the period before the start of the eclipse. This
ACPD
7, 13475–13501, 2007 Attenuation of irradiance during solar eclipse A. Kazantzidis et al. Title Page Abstract Introduction Conclusions References Tables Figures ◭ ◮ ◭ ◮ Back CloseFull Screen / Esc
Printer-friendly Version Interactive Discussion
EGU
effect is more evident at sites 6–8 (Fig. 2, upper panel), where there irradiance at 305 nm was measured 10% less in Kastelorizo and 15% higher in Nicosia. Part of this change in irradiance at both sites could be attributed, apart from possible cloudiness, to small changes in the ozone column during the eclipse (see Sect. 6). In addition, differences in total ozone by –5 DU and +8 DU at Kastelorizo and Nicosia respectively
5
were observed at the same time interval of the reference, cloud-free, day.
Being only marginally affected by cloudiness, the measurements at sites 6–8 suggest that the model calculations simulate quite well the decrease of global irradiance due to the eclipse. The differences are smaller than 10% for sun coverage of up to 40%, increasing by up to 30% for larger sun coverage. At Kastelorizo, the site with the highest
10
eclipse percentage, measurements agree better with the model. However, close to the totality the agreement becomes worse as both measurement and model uncertainties become more significant.
The effect of solar eclipse on the global irradiance at 312 and 320 nm has been investigated too. The relative decrease of irradiance (not shown here) is of the same
15
magnitude, while the variability of the measured data due to cloudiness is more evident, as expected from the larger contribution of direct radiation at these wavelengths. At the end of the eclipse, the deviations of the changes in solar irradiance at 312 nm from unity are –3% and 7% respectively for Kastelorizo and Nicosia. The decreasing signal to noise ratio at these wavelengths allows reliable measurements at Kastelorizo only
20
up to the start of the totality.
The modeled rapid decrease of solar irradiance and the use of one-minute aver-aged measurements lead to the reveal of significant and probably artificial differences between modeled and measured values. The attenuation of solar irradiance and the capability of models to estimate this effect during totality, will be extensively discussed
25
ACPD
7, 13475–13501, 2007 Attenuation of irradiance during solar eclipse A. Kazantzidis et al. Title Page Abstract Introduction Conclusions References Tables Figures ◭ ◮ ◭ ◮ Back CloseFull Screen / Esc
Printer-friendly Version Interactive Discussion
EGU
4.2 UV-A irradiance and PAR.
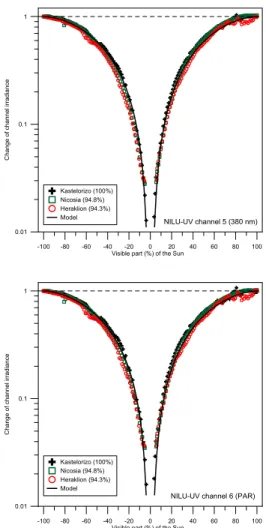
The relative change of solar irradiance at 380 nm and PAR is shown only at Kastelorizo, Nicosia and Heraklion (Fig. 3) and not for the other sites, due to the increased impact of cloudiness in UVA and PAR instrument channels. At these wavelength regions (and also at 340 nm which is not shown) the differences between modeled and measured
5
irradiance are smaller, compared to the UV-B. For high eclipse percentages, when the impact of cloudiness is minimum the differences are within the measurement uncer-tainties.
The results discussed in this section, as far as they concern the comparisons of model calculations with measurements are in accordance with those derived
10
from spectral direct irradiance measurements and model calculations in Kazadzis et al. (2007).
5 Spectral effect of the eclipse on surface global irradiance
In previous paragraphs, emphasis was given in the discussion of the global irradiance changes as a result of the Sun coverage. However, it is well known from previous
15
studies (e.g. Zerefos et al., 2000, Koepke et al., 2001), that during a solar eclipse the attenuation of global irradiance is wavelength dependent. In order to quantify this dependence, we calculated the change of the irradiance ratio at 305, 312, 340 nm and PAR relative to 380 nm during the eclipse. In this case the effect of the Sun coverage is diminished, since the ratios are formed from synchronous irradiances measurements.
20
In contrast, the effects of cloudiness become dominant, since the influence of clouds is also wavelength dependent (Mayer et al., 1998). For this reason, the discussion is restricted to stations 6–8.
ACPD
7, 13475–13501, 2007 Attenuation of irradiance during solar eclipse A. Kazantzidis et al. Title Page Abstract Introduction Conclusions References Tables Figures ◭ ◮ ◭ ◮ Back CloseFull Screen / Esc
Printer-friendly Version Interactive Discussion
EGU
5.1 UV-A irradiance and PAR
Figure 4 shows the ratios of measured and modeled irradiance of 340 nm and PAR with respect to the irradiance at 380 nm, as a function of the visible fraction of the Sun’s disk. For both wavelength regions the agreement between measurements and model calculations is good for percentages larger than about 50%, and worsens significantly
5
as the eclipse progresses. The model generally underestimates the spectral effect, up to 10% close to the totality. The agreement between measurements at different locations is much better than with the model calculations. The short-term variability in the measurements is mainly due to changing cloudiness. The irradiance at 340 nm decreases by about 10% more compared to 380 nm, while PAR is enhanced by about
10
30%. The ratios after the end of the eclipse do not deviate significantly, suggesting that atmospheric parameters that may influence the irradiance at these wavelengths (e.g. aerosols, NO2) have remained stable.
5.2 UV-B irradiance
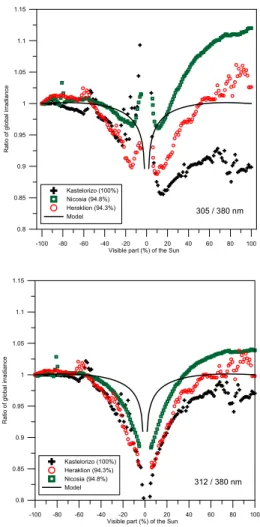
The spectral effect of the eclipse on the shorter wavelengths is shown in Fig. 5. The
15
effect at 312 nm (lower panel) is similar to that reported for 340 nm (Fig. 4) with the exception that the ratio after the end of the eclipse is significantly different from the ratio before the eclipse, and even of different sign. This change is attributable to differences in the diurnal variation of the total ozone column between the day of the eclipse and the day of the normalization, as discussed in Sect. 4.2. The same effect is more evident at
20
305 nm (upper panel) where the ozone absorption is much stronger.
The pattern for 305 nm is completely different compared to the other wavelengths, since the ratio inverses at about 85% of Sun coverage. It is not clear yet whether this behavior is caused by changes in total ozone or if it is a 3-D effect from the multiple scattering of radiation under these special conditions of low direct irradiance (Emde
25
and Mayer, 2007). It should be noted that this effect occurs only a few (less than 10) minutes before and after the totality. It is also worth noting that the same behavior is
ACPD
7, 13475–13501, 2007 Attenuation of irradiance during solar eclipse A. Kazantzidis et al. Title Page Abstract Introduction Conclusions References Tables Figures ◭ ◮ ◭ ◮ Back CloseFull Screen / Esc
Printer-friendly Version Interactive Discussion
EGU
found at all three stations, hence the effect is likely to be real and not an artifact of the measurements. However, the 1-D and 3-D model calculations fail to reproduce this effect. 3-D model calculations by Emde and Mayer (2007) revealed that under such at-mospheric conditions, the multiple scattering becomes important for wavelengths down to 311 nm. The shape of the ozone profile could also influence the global irradiance
5
at short wavelengths, since close to the totality the contribution of the direct irradiance becomes very small.
6 Total ozone from irradiance measurements
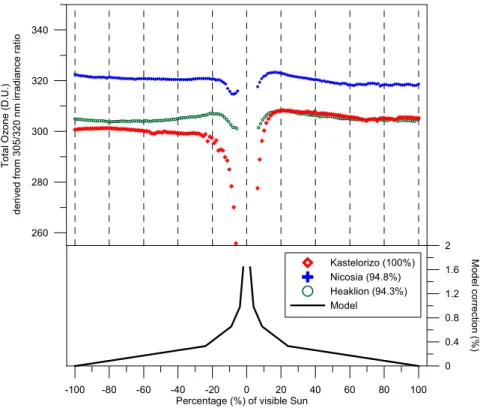
The total ozone column during the eclipse derived from the NILU-UV radiometers using the 305/320 nm irradiance ratio are shown in the upper panel of Fig. 6 for Kastelorizo,
10
Nicosia and Heraklion. The total ozone was derived for the other sites too, but they are not shown here. By the end of the eclipse the total ozone column in Patras, Athens, Mytilene and Kastelorizo has increased relative to the beginning of the eclipse respec-tively by about 9, 24, 7 and 5 DU, while it decreased by ∼4 DU in Nicosia and remained almost stable in Thessaloniki and Ioannina. Similar changes were found also in the
15
Brewer measurements at Kastellorizo and Thessaloniki (Kazadzis et al., 2007). The calculation of total ozone using the irradiance ratio of 312/320 nm has not been used here, since the change in irradiance at 312 nm is influenced strongly by the eclipse, while at 305 nm the dominant factor is ozone. As it appears from Fig. 6, the derived ozone columns even from the ratio 305/320 nm show a pronounced decrease
20
for Sun coverage greater than about 80%, which is likely an artifact of the irradiance measurements (e.g. Zerefos et al., 2001; Kazadzis et al., 2007). Only a very small fraction of this behavior may be caused by the limb darkening effect, as it appears from the correction factor for total ozone, which is shown for the different phases of the eclipse in the lower panel of Fig. 6. This correction factor is derived from 1-D model
25
calculations of spectral irradiances taking into account the effect of the limb darkening. Total ozone appears to increase with increasing sun coverage between ∼40% and
ACPD
7, 13475–13501, 2007 Attenuation of irradiance during solar eclipse A. Kazantzidis et al. Title Page Abstract Introduction Conclusions References Tables Figures ◭ ◮ ◭ ◮ Back CloseFull Screen / Esc
Printer-friendly Version Interactive Discussion
EGU
∼80% up to about 5 DU. This is evident at all sites mainly during the second phase of the eclipse and during the first phase in Heraklion. Although it could be reasonable to attribute this effect to the spectral influence of the eclipse on the ratio 305/320 nm, the correction for the total ozone can explain only about half of the measured differences. The remaining part of the changes could be attributed to various other reasons,
includ-5
ing the less accurate representation of the effect of the eclipse by the 1-D model, the increasing contribution of the diffuse irradiance when the sun coverage increases, and to changes in atmospheric conditions during the eclipse.
7 Irradiance measurements and 3-D model calculations during totality
The change in irradiance during totality, measured with the NILU-UV multi-channel
10
radiometer at Kastelorizo, is compared with theoretical calculations for cloud free skies with the MYSTIC 3-D model (Emde and Mayer, 2007). The modeled spectra in the spectral region 300–500 nm were weighted with the spectral responses of the NILU-UV channels, to simulate the actual irradiance measurements of the NILU-UV instrument. Then, the ratio of irradiance for eclipse and non-eclipse conditions was calculated for
15
every second during a period extending 5 min before and after the totality. All ratios were normalized with the value corresponding to the beginning of the period (i.e. 5 min before the eclipse maximum).
The measured and calculated reduction of irradiance at the 312 nm and 380 nm channels are presented in Fig. 7 as a function of the time difference relative to the
20
eclipse maximum. The vertical lines close to 100 s correspond to the beginning and the end of the totality. For the 380 nm channel, the model calculations and the mea-surements follow each other very closely throughout the period of concern. Similar results were obtained also for the 340 nm channel (not shown here). However, for the 312 nm channel the measurements are higher, most likely because of the increasing
25
noise in the measurements during the totality (the measured raw counts were only 30% higher than the dark current), but also because of the uncertainties in determining
ACPD
7, 13475–13501, 2007 Attenuation of irradiance during solar eclipse A. Kazantzidis et al. Title Page Abstract Introduction Conclusions References Tables Figures ◭ ◮ ◭ ◮ Back CloseFull Screen / Esc
Printer-friendly Version Interactive Discussion
EGU
the spectral response of this channel. The model uncertainty increases too at 312 nm mainly due to the impact the ozone profile. According to model sensitivity calculations, the solar irradiance at 312 nm, using the standard tropical ozone profile instead of the mid-latitude summer profile (Anderson et al., 1986) and scaling to 300 DU, is higher by a factor of 1.6 during totality. Finally, the hills extending above the horizon towards
5
south and east up to an elevation of about 20◦
could have also affected the global irra-diance measurements under such weak radiation conditions. The measured irrairra-diance at 305 nm has reached its minimum already a few seconds before the totality, thus no results are shown for this wavelength.
8 Conclusions
10
The effect of the total solar eclipse of 29 March 2006 on UV and visible irradiance measurements of the Greek UV Network have been examined.
At three network sites and for 94% eclipse percentage, the solar irradiance at 305 nm is 50 times weaker when compared with values at non-eclipse conditions. The irradi-ance at UVA and visible spectral regions was almost 30 times less for the same
condi-15
tions. The comparison of measured irradiance with 1-D model calculations (accounting for the limb darkening effect) reveals differences in UVB region of 10% for sun coverage up to 40%, while the differences rise to 30% for higher eclipse percentages. In UVA and visible regions the differences are within measurement and model uncertainties.
The effect of the eclipse on surface irradiance has spectral characteristics. Although
20
the shorter wavelengths are generally influenced more, at large eclipse percentages (sun coverage of more than ∼85%) the picture reverses for the shortest wavelength (305 nm) which decreases with slower rates compared to the longer wavelengths as the eclipse approaches its maximum.
Total ozone derived from irradiance measurements at 305 and 320 nm shows a
be-25
havior similar to that reported in the past for other eclipses. It decreases significantly at eclipse percentages higher than about 80% and shows a slight increase during the
ACPD
7, 13475–13501, 2007 Attenuation of irradiance during solar eclipse A. Kazantzidis et al. Title Page Abstract Introduction Conclusions References Tables Figures ◭ ◮ ◭ ◮ Back CloseFull Screen / Esc
Printer-friendly Version Interactive Discussion
EGU
eclipse for sun coverage of more than ∼40%.
The reduction of irradiance during the totality as predicted by a 3-D model agrees with the measurements in the UV-A. The agreement worsens in the UV-B.
Acknowledgements. The authors are indebted to scientists that help in maintaining the
instru-ments of the Greek UV monitoring network: C. Feidas and S. Kolios, University of Aegean,
5
Mytilene; I. Pnevmatikos, University of Ioannina; K. Eleftheratos, University of Athens; A. A. Ar-giriou and S. Lykoudis, University of Patras; N. Michalopoulos and M. Kanakidou, University of Crere, Heraklion; O. Poulida, Frederik Institute of Technology, Nicosia, Cyprus.
References
Anderson, G., Clough, S., Kneizys, F., Chetwynd, J., and Shettle, E.: AFGL Atmospheric
Con-10
stituent Profiles (0–120 km), Tech. Rep. AFGL-TR-86-0110, AFGL (OPI), Hanscom AFB, MA 01736, 1986.
Bernhard, G., Booth, C. R., and Ehramjian, J. C.: Real-time ultraviolet and column ozone from multichannel ultraviolet radiometers deployed in the National Science Foundation’s ultraviolet monitoring network, Opt. Eng., 44(4), 041011, 2005.
15
Bojkov, R. D: The ozone variations during the solar eclipse of May 20 1966, Tellus, 20, 417–421, 1968.
Chakrabarty, D. K, Shah, N. C., and Pandya, K. V.: Fluctuation in ozone column over Ahmed-abad during the solar eclipse of 24 October 1995, Geophys. Res. Lett., 24, 3001–3003, 1997.
20
Chakrabarty, D. K., Peshin, S. K., Srivastav, S. K., Shah, N. C., and Pandya, K. V.: Further evidence of total ozone variation during the solar eclipse of 1995, J. Geophys. Res., 106(D3), 3213–3218, 2001.
Dahlback, A.: Measurements of biologically effective UV doses, total ozone abundances, and cloud effects with multichannel, moderate bandwidth filter instruments, Appl. Opt., 35(33),
25
6514–6521, 1996.
Dahlback, A. and Stamnes, K.: A new spherical model for computing the radiation field available for photolysis and heating at twilight, Planet. Space Sci., 39, 671–683, 1991.
forra-ACPD
7, 13475–13501, 2007 Attenuation of irradiance during solar eclipse A. Kazantzidis et al. Title Page Abstract Introduction Conclusions References Tables Figures ◭ ◮ ◭ ◮ Back CloseFull Screen / Esc
Printer-friendly Version Interactive Discussion
EGU
diative transfer, Atmos. Chem. Phys., 7, 2259–2270, 2007,
http://www.atmos-chem-phys.net/7/2259/2007/.
Espenak, F. and Anderson, J.: Total solar eclipse of 2006 March 29, Tech. rep., Goddard Space Flight Centre, 2004.
Fernandez, W., Castro, V., Wright, J., Hidalgo, H., and Saenz, A.: Changes in solar irradiance
5
and atmospheric turbidity in Costa Rica during the total solar eclipse of July 11, 1991, Earth, Moon, Planets , 63, 119–132, 1993.
Høiskar, B., Haugen, R., Danielsen, T., Kylling, A., Edvardsen, K., Dahlback, A., Johnsen, B., Blumthaler, M., and Schreder, J.: Multichannel moderate-bandwidth filter instrument for measurement of the ozone-column amount, cloud transmittance, and ultraviolet dose rates,
10
Appl. Optics, 42(18), 3472–3479, 2003.
Kazadzis, S., Bais, A., Amiridis, V., Balis, D., Meleti, C., Kouremeti, N., Zerefos, C. S., Rapso-manikis, S., Petrakakis, M., Kelesis, A., Tzoumaka, P. and Kelektsoglou, K.: Nine years of UV aerosol optical depth measurements at Thessaloniki, Greece, Atmos. Chem. Phys., 7, 2091–2101, 2007,
15
http://www.atmos-chem-phys.net/7/2091/2007/.
Kazadzis, S., Bais, A., Blumthaler, M., Webb, A., Kouremeti, N., Kift, R., Schallhart, B., and Kazantzidis, A.: Effects of total solar eclipse of 29 March 2006 on surface radiation, Atmos. Chem. Phys. Discuss., 7, 9235–9258, 2007,
http://www.atmos-chem-phys-discuss.net/7/9235/2007/.
20
Kazantzidis, A., Bais, A. F., Balis, D. S., Kosmidis, E., and Zerefos, C. S.: Sensitivity of solar UV radiation to ozone and temperature profiles at Thessaloniki (40.5◦N, 23◦E), Greece, J.
Atmos. Solar-Terrestrial Phys., 67, 1321–1330, 2005.
Kazantzidis, A., Bais, A. F., Topaloglou, C., Garane, K., Zempila, M., Meleti, C., and Zerefos, C. S.: Quality assurance of the Greek UV Network: preliminary results from the pilot phase
25
operation, SPIE Europe Remote Sensing of Clouds and the Atmosphere XI, 6362-86, 2006. K ¨opke, P., Reuder, J. and Schween, J.: Spectral variation of the solar radiation during an
eclipse, Meteorol. Z., 10, 179-186, 2001.
Lapeta, B., Engelsen, O., Litynska, Z., Kois, B., and Kylling, A.: Sensitivity of surface UV radiation and ozone column retrieval to ozone and temperature profiles, J. Geophys. Res.,
30
105, 5001–5007, 2000.
Mariolopoulos, E., Zerefos, C. S., Bloutsos, A., and Repapis, C.: Ozone and temperature balloon measurements during the annular solar eclipse of 29 April 1976, Proc. Acad. Athens,
ACPD
7, 13475–13501, 2007 Attenuation of irradiance during solar eclipse A. Kazantzidis et al. Title Page Abstract Introduction Conclusions References Tables Figures ◭ ◮ ◭ ◮ Back CloseFull Screen / Esc
Printer-friendly Version Interactive Discussion
EGU
51, 636–645, 1977.
Mayer, B., Kylling, A., Madronich, S., and Seckmeyer, G.: Enhanced absorption of UV radiation due to multiple scattering in clouds: experimental evidence and theoretical explanation, J. Geophys. Res., 103(D23), 31 241–31 254, 1998.
Mayer, B. and Kylling, A.: Technical Note: The libRadtran software package for radiative transfer
5
calculations: Description and examples of use, Atmos. Chem. Phys., 5, 1855–1877, 2005,
http://www.atmos-chem-phys.net/5/1855/2005/.
Mikhalev, A. V., Chernigovskaya, M. A., Beletsky, A. B., Kazimirovsky, E. S., and Pirog, O. M.: Variations of the ground-measured solar ultraviolet radiation during the solar eclipse on March 9, Adv. Space Res., 1999, 24, 657–660, 1997.
10
Mims, F. M. and Mims, E. R.: Fluctuations in column ozone during the total solar eclipse of July 11, 1991, Geophys. Res. Lett., 20, 367–370, 1993.
Sharp, W. E., Silverman, S. M., and Lloyd, J. W. F.: Summary of sky brightness measurements during eclipses of the sun, Appl. Optics, 10, 1207–1210, 1971.
Shaw, G. E.: Sky radiance during a total solar eclipse: a theoretical model, Appl. Opt., 17,
15
272–278, 1978.
Shettle, E.: Models of aerosols, clouds and precipitation for atmospheric propagation studies, in: Atmospheric propagation in the uv, visible, ir and mm-region and related system aspects, no. 454 in AGARD Conference Proceedings, 1989.
Silverman, S. M. and Mullen, E. G.: Sky brightness during eclipses: a review, Appl. Optics, 14,
20
2838–2843, 1975.
Winkler, P., Kaminski, U., Koehler, U., Riedl, J., Schroers, H., and Anwender, D.: Develop-ment of meteorological parameters and total ozone during total eclipse of August 11, 1999, Meteorol. Z., 10, 193–199, 2000.
Zerefos, C. S., Balis, D. S., Meleti, C., Bais, A. F., Tourpali, K., Vanicek, K., Cappelani, F.,
25
Kohler, U., Tiziano, C., Stubi, R., Formenti, P., and Andreae, A.: Changes in environmental parameters during the solar eclipse of August 11, 1999, over Europe. Effects on Surface W Solar h-radiance and Total Ozone, J. Geophys. Res., 105, 26 463–26 473, 2000.
Zerefos, C. S., Balis, D. S, Zanis, P., Meleti, C., Bais, A. F., Tourpali, K., Melas, D., Ziomas, I., Galani, E., Kourtidis, K., Papayannis, A., and Gogosheva, Z.: Changes in surface UV solar
30
irradiance and ozone over the Balkans during the eclipse of August 11, 1999, Adv. Space Res., 27, 1955–1963, 2001.
ACPD
7, 13475–13501, 2007 Attenuation of irradiance during solar eclipse A. Kazantzidis et al. Title Page Abstract Introduction Conclusions References Tables Figures ◭ ◮ ◭ ◮ Back CloseFull Screen / Esc
Printer-friendly Version Interactive Discussion
EGU
Table 1. The geographical position, times of the beginning, maximum and end of the eclipse
and the maximum percentage coverage of the Sun at the stations of the Greek UV network.
Station Station Latitude Longitude Start of Maximum of End of Maximum number name (◦N) (◦E) eclipse eclipse eclipse obscuration of
solar disk (%) 1 Ioannina 39.62 20.85 09:30 10:45 12:00 73.1 2 Thessaloniki 40.63 22.96 09:34 10:49 12:04 75.1 3 Patra 38.29 21.79 09:28 10:45 12:01 78.7 4 Athens 37.99 23.77 09:30 10:47 12:04 84 5 Mytilene 39.11 26.55 09:35 10:53 12:09 87 6 Heraklion 35.31 25.08 09:27 10:46 12:10 94.3 7 Nicosia 35.18 33.38 09:37 10:58 12:15 94.8 8 Kastelorizo 36.15 29.60 09:34 10:53:28 12:11 100
ACPD
7, 13475–13501, 2007 Attenuation of irradiance during solar eclipse A. Kazantzidis et al. Title Page Abstract Introduction Conclusions References Tables Figures ◭ ◮ ◭ ◮ Back CloseFull Screen / Esc
Printer-friendly Version Interactive Discussion
EGU
Table 2. Cloud conditions at the ground-based stations, derived from observations at the sites
or at nearby meteorological stations, close to the maximum time of the solar eclipse. Station Station Cloud conditions close to the eclipse maximum time number name
1 Ioannina Scattered cumulus 2 Thessaloniki Few cumulus, broken cirrus 3 Patra Few cumulus 4 Athens Few cumulus, broken cirrus 5 Mytilene Few cumulus, broken cirrus 6 Heraklion Few cumulus, scattered cirrus 7 Nicosia Few cumulus
ACPD
7, 13475–13501, 2007 Attenuation of irradiance during solar eclipse A. Kazantzidis et al. Title Page Abstract Introduction Conclusions References Tables Figures ◭ ◮ ◭ ◮ Back CloseFull Screen / Esc
Printer-friendly Version Interactive Discussion
EGU
Fig. 1. Eclipse map and ground based stations (numbers 1–8, according to Table 1). The
eclipse map is provided by NASA, Goddard Space Flight Center (http://sunearth.gsfc.nasa. gov/eclipse/SEmono/TSE2006/TSE2006.html).
ACPD
7, 13475–13501, 2007 Attenuation of irradiance during solar eclipse A. Kazantzidis et al. Title Page Abstract Introduction Conclusions References Tables Figures ◭ ◮ ◭ ◮ Back CloseFull Screen / Esc
Printer-friendly Version Interactive Discussion
EGU
-100 -80 -60 -40 -20 0 20 40 60 80 100
Visible part (%) of the Sun 0.01 0.1 1 C h a n g e o f c h a n n e l ir ra d ia n c e Kastelorizo (100%) Nicosia (94.8%) Heraklion (94.3%) Model NILU-UV channel1 (305nm) -100 -80 -60 -40 -20 0 20 40 60 80 100
Visible part (%) of the Sun 0.1 1 C h a n g e o f c h a n n e l ir ra d ia n c e Mitilene (87%) Athens (84%) Patra (78.7%) Thessaloniki (75%) Ioannina (73.1%)
Model NILU-UV channel 1 (305nm)
Fig. 2. Change of solar irradiance for NILU-UV channel 1 (305 nm) for sites 1–5 (upper panel)
ACPD
7, 13475–13501, 2007 Attenuation of irradiance during solar eclipse A. Kazantzidis et al. Title Page Abstract Introduction Conclusions References Tables Figures ◭ ◮ ◭ ◮ Back CloseFull Screen / Esc
Printer-friendly Version Interactive Discussion
EGU
-100 -80 -60 -40 -20 0 20 40 60 80 100
Visible part (%) of the Sun 0.01 0.1 1 C h a n g e o f c h a n n e l ir ra d ia n c e Kastelorizo (100%) Nicosia (94.8%) Heraklion (94.3%) Model NILU-UV channel 5 (380 nm) -100 -80 -60 -40 -20 0 20 40 60 80 100
Visible part (%) of the Sun 0.01 0.1 1 C h a n g e o f c h a n n e l ir ra d ia n c e Kastelorizo (100%) Nicosia (94.8%) Heraklion (94.3%) Model
NILU-UV channel 6 (PAR)
Fig. 3. Change of solar irradiance for NILU-UV channels 5 (380 nm, upper panel) and 6 (PAR,
ACPD
7, 13475–13501, 2007 Attenuation of irradiance during solar eclipse A. Kazantzidis et al. Title Page Abstract Introduction Conclusions References Tables Figures ◭ ◮ ◭ ◮ Back CloseFull Screen / Esc
Printer-friendly Version Interactive Discussion
EGU
-100 -80 -60 -40 -20 0 20 40 60 80 100
Visible part (%) of the Sun 0.85 0.9 0.95 1 1.05 R a ti o o f g lo b a l ir ra d ia n ce Kastelorizo (100%) Nicosia (94.8%) Heraklion (94.3%) Model 340 / 380 nm -100 -80 -60 -40 -20 0 20 40 60 80 100
Visible part (%) of the Sun 0.9 1 1.1 1.2 1.3 1.4 R a ti o o f g lo b a l ir ra d ia n ce Kastelorizo (100%) Nicosia (94.8%) Heraklion (94.3%) Model PAR / 380 nm
Fig. 4. The spectral difference of global irradiance attenuation at 340 nm (upper panel) and
PAR (lower panel) relatively to measured irradiance values at 380 nm, as derived from NILU-UV measurements and model calculations.
ACPD
7, 13475–13501, 2007 Attenuation of irradiance during solar eclipse A. Kazantzidis et al. Title Page Abstract Introduction Conclusions References Tables Figures ◭ ◮ ◭ ◮ Back CloseFull Screen / Esc
Printer-friendly Version Interactive Discussion
EGU
-100 -80 -60 -40 -20 0 20 40 60 80 100
Visible part (%) of the Sun 0.8 0.85 0.9 0.95 1 1.05 1.1 1.15 R a ti o o f g lo b a l ir ra d ia n ce Kastelorizo (100%) Nicosia (94.8%) Heraklion (94.3%) Model 305 / 380 nm -100 -80 -60 -40 -20 0 20 40 60 80 100
Visible part (%) of the Sun 0.8 0.85 0.9 0.95 1 1.05 1.1 1.15 R a ti o o f g lo b a l ir ra d ia n ce Kastelorizo (100%) Heraklion (94.3%) Nicosia (94.8%) Model 312 / 380 nm
ACPD
7, 13475–13501, 2007 Attenuation of irradiance during solar eclipse A. Kazantzidis et al. Title Page Abstract Introduction Conclusions References Tables Figures ◭ ◮ ◭ ◮ Back CloseFull Screen / Esc
Printer-friendly Version Interactive Discussion
EGU
-100 -80 -60 -40 -20 0 20 40 60 80 100
Percentage (%) of visible Sun 260 280 300 320 340 T o ta l O z o n e ( D .U .) d e ri v e d f ro m 3 0 5 /3 2 0 n m i rr a d ia n ce r a ti o Kastelorizo (100%) Nicosia (94.8%) Heaklion (94.3%) Model 0 0.4 0.8 1.2 1.6 2 Mo d e l co rr e ct io n (% )
Fig. 6. Total ozone column measured by NILU-UV instruments at sites 6–8 derived from
305/320 nm irradiance ratios. Limb darkening effect on ozone calculations, derived from 1-D model results, is also presented.
ACPD
7, 13475–13501, 2007 Attenuation of irradiance during solar eclipse A. Kazantzidis et al. Title Page Abstract Introduction Conclusions References Tables Figures ◭ ◮ ◭ ◮ Back CloseFull Screen / Esc
Printer-friendly Version Interactive Discussion
EGU
-300 -250 -200 -150 -100 -50 0 50 100 150 200 250 300
Relative time to eclipse maximum (s) 0.0001 0.001 0.01 0.1 1 e c lip s e / n o n -e c lip s e g lo b a l ir ra d ia n ce 312 nm (modelled) 380 nm (modelled) 312 nm (measured) 380 nm (measured)
Fig. 7. The ratio of global solar irradiance between the NILU-UV instrument and MYSTIC 3-D
model calculations during the eclipse at Kastelorizo. The time t=0 denotes the maximum of the eclipse and the grey lines correspond to the beginning and the end of the totality.