HAL Id: hal-00302699
https://hal.archives-ouvertes.fr/hal-00302699
Submitted on 3 Apr 2007HAL is a multi-disciplinary open access
archive for the deposit and dissemination of sci-entific research documents, whether they are pub-lished or not. The documents may come from teaching and research institutions in France or abroad, or from public or private research centers.
L’archive ouverte pluridisciplinaire HAL, est destinée au dépôt et à la diffusion de documents scientifiques de niveau recherche, publiés ou non, émanant des établissements d’enseignement et de recherche français ou étrangers, des laboratoires publics ou privés.
Long range transport and fate of a stratospheric volcanic
cloud from Soufriere Hills volcano, Montserrat
A. J. Prata, S. A. Carn, A. Stohl, J. Kerkmann
To cite this version:
A. J. Prata, S. A. Carn, A. Stohl, J. Kerkmann. Long range transport and fate of a stratospheric vol-canic cloud from Soufriere Hills volcano, Montserrat. Atmospheric Chemistry and Physics Discussions, European Geosciences Union, 2007, 7 (2), pp.4657-4672. �hal-00302699�
ACPD
7, 4657–4672, 2007 Stratospheric volcanic cloud A. J. Prata et al. Title Page Abstract Introduction Conclusions References Tables Figures ◭ ◮ ◭ ◮ Back CloseFull Screen / Esc
Printer-friendly Version Interactive Discussion
EGU
Atmos. Chem. Phys. Discuss., 7, 4657–4672, 2007 www.atmos-chem-phys-discuss.net/7/4657/2007/ © Author(s) 2007. This work is licensed
under a Creative Commons License.
Atmospheric Chemistry and Physics Discussions
Long range transport and fate of a
stratospheric volcanic cloud from
Soufriere Hills volcano, Montserrat
A. J. Prata1, S. A. Carn2, A. Stohl1, and J. Kerkmann3 1
Norwegian Institute for Air Research (NILU), P.O. Box 100, 2027 Kjeller, Norway
2
Joint Center for Earth Systems Technology (JCET), University of Maryland Baltimore County, Baltimore, MD 21250, USA
3
European Organisation for the Exploitation of Meteorological Satellites (EUMETSAT), Am Kavalleriesand 31, 64295 Darmstadt, Germany
Received: 31 January 2007 – Accepted: 9 March 2007 – Published: 3 April 2007 Correspondence to: A. J. Prata (fred.prata@nilu.no)
ACPD
7, 4657–4672, 2007 Stratospheric volcanic cloud A. J. Prata et al. Title Page Abstract Introduction Conclusions References Tables Figures ◭ ◮ ◭ ◮ Back CloseFull Screen / Esc
Printer-friendly Version Interactive Discussion
EGU
Abstract
Volcanic eruptions emit gases, ash particles and hydrometeors into the atmosphere, occasionally reaching great heights to reside in the stratospheric overworld where they affect the radiative balance of the atmosphere and the earth’s climate. Here we use satellite measurements and a Lagrangian particle dispersion model to determine the
5
mass loadings, vertical penetration, horizontal extent, dispersion and transport of vol-canic gases and particles in the stratosphere from the volvol-canic cloud emitted during the 20 May 2006 eruption of Soufriere Hills volcano, Montserrat, West Indies. Infrared, ultraviolet and microwave radiation measurements from two polar orbiters are used to quantify the gases and particles, and track the movement of the cloud for 23 days,
10
over a distance of ∼18 000 km. Approximately, 0.1±0.01 Tg(S) was injected into the stratosphere in the form of SO2: the largest single sulfur input to the stratosphere in
2006. Microwave Limb Sounder measurements indicate an enhanced mass of HCl of ∼0.003–0.01 Tg. Geosynchronous satellite data reveal the rapid nature of the strato-spheric injection and indicate that the eruption cloud contained ∼2 Tg of ice, with very
15
little ash reaching the stratosphere. These new satellite measurements of volcanic gases and particles can be used to test the sensitivity of climate to volcanic forcing and assess the impact of stratospheric sulfates on climate cooling.
1 Introduction
The current low sulfate content of the stratosphere is largely due to the recent absence
20
of significant stratospheric injections of volcanic SO2. The last major injections
oc-curred during the eruptions of El Chichon, March/April 1982 (∼4 Tg S), Pinatubo from 12–15 June 1991 (∼10 Tg S), followed soon after by the eruption of Cerro Hudson, in August 1991 (∼2 Tg S), and trend estimates using mostly longterm balloon mea-surements (Deshler et al., 2006), suggest that there is no detectable change in the
25
ACPD
7, 4657–4672, 2007 Stratospheric volcanic cloud A. J. Prata et al. Title Page Abstract Introduction Conclusions References Tables Figures ◭ ◮ ◭ ◮ Back CloseFull Screen / Esc
Printer-friendly Version Interactive Discussion
EGU
into the stratosphere could be employed as a strategy to reduce global warming due to increasing CO2levels (Crutzen, 2006; Wigley, 2006). Stratospheric sulfate causes sur-face cooling and stratospheric warming (Robock, 2000). The average injection required is about 1–2 Tg(S) per year, but this assumes average stratospheric sulfur loading from volcanoes. On average volcanoes are believed to inject 0.5–1.5 Tg (S) per year into
5
the stratosphere (Halmer et al., 2002); with a large portion of this due to fewer than 2–3 events each year. Measurements of total S injected into the atmosphere from vol-canoes are based on low accuracy, largely intermittent and incomplete ground-based correlation spectrometer (COSPEC) and differential optical absorption spectroscopy measurements (McGonigle et al., 2002), while since 1979 the NASA Total Ozone
Map-10
ping Spectrometer – TOMS has provided (also with limited accuracy) global estimates of volcanic SO2emissions to the upper troposphere and stratosphere (Krueger et al.,
1995), leading to a best estimate of 7.5–10.5 Tg(S) for volcanic sulfur (Halmer et al., 2002). Our knowledge of the stratospheric sulfate content has been greatly improved through the use of satellite-borne instruments capable of providing global data on a
15
continuous basis (e.g. TOMS) that have been used to determine volcanic SO2burdens
(Bluth et al., 1993). While there is no single satellite instrument dedicated to this task, several instruments with alternate primary objectives can be exploited to determine SO2concentrations.
The Atmospheric Infrared Sounder – AIRS on board the polar-orbiting EOS-Aqua
20
platform is designed to measure atmospheric profiles of temperature, moisture and trace gases for climate and weather prediction applications. AIRS covers the infrared spectrum from ∼600 cm−1 to ∼3000 cm−1 which includes SO2 absorption features at
2500, 1265, and 1373 cm−1. The Meteosat Second Generation (MSG), Spin Enhanced
Visible and InfraRed Imager (SEVIRI) provides data at 15 min intervals in 8 discrete
25
spectral bands over a 70◦ field of view centred at the Greenwich Meridian and the equator. This sensor is specifically designed to provide data for the European weather services and is an operational satellite. SEVIRI has channels at 4, 7.3 and 8.6 µm which, like AIRS, cover SO2absorption features, albeit at much reduced spectral
res-ACPD
7, 4657–4672, 2007 Stratospheric volcanic cloud A. J. Prata et al. Title Page Abstract Introduction Conclusions References Tables Figures ◭ ◮ ◭ ◮ Back CloseFull Screen / Esc
Printer-friendly Version Interactive Discussion
EGU
olution. The Microwave Limb Sounder – MLS measures microwave emission from the atmospheric limb to determine concentration profiles and total columns of a variety of chemical species including HCl and SO2 (Waters et al., 2006). Details of the SO2
ultra-violet measurements from the Ozone Monitoring Instrument (OMI) for this vol-canic gas cloud, with a focus on the volcanology are described elsewhere (Carn et al.,
5
2007), while our focus is on the use of infrared measurements and a dispersion model to study the chemistry and transport. The combined use of these four instruments for studying the atmospheric chemistry of volcanic emissions is new, and allows much greater confidence in assessing the dynamics and structure of volcanic gas clouds. The infrared instruments provide total column SO2 measurements, while the MLS
re-10
trieves HCl profiles.
2 Soufriere Hills eruption, 20 May 2006
Soufriere Hills volcano, on the island of Montserrat (16.7◦N, 62.2◦W, 915 m) has been in a state of eruption since 18 July 1995. On the morning of 20 May 2006 after several months of lava dome building, the eastern flank of the volcano suffered a major collapse
15
involving an estimated volume of 90×106m3 of lava, much of it entering the ocean. During or immediately following this event, a highly buoyant eruption column of ash and gases rose to heights of at least 17 km, and as we will show, the gases penetrated the tropopause and entered the stratosphere reaching as high as 20 km. There was also a large quantity of ice in the eruption cloud. A MODIS-Terra image obtained about
20
6 h after the eruption shows a large and high cloud moving westwards away from the volcano on Montserrat (Fig. 1a). The “whiteness” of the eruption cloud suggests a high ice content of the cloud; the slight yellowish discoloration on the eastern flank of the eruption cloud is due to a higher proportion of volcanic ash there. The cloud also contained copious amounts of SO2and some HCl.
ACPD
7, 4657–4672, 2007 Stratospheric volcanic cloud A. J. Prata et al. Title Page Abstract Introduction Conclusions References Tables Figures ◭ ◮ ◭ ◮ Back CloseFull Screen / Esc
Printer-friendly Version Interactive Discussion
EGU
3 Long range transport of the volcanic cloud
Figure 1 shows a collage of data derived from five different satellite sensors. The initial phase of the eruption was not captured well by the afternoon polar orbiting satellite instruments due to timing with the eruption onset. However, sensors on board two geosynchronous satellites (GOES-W and MSG-SEVIRI) and the MODIS
5
sensor on board the morning EOS-Terra satellite were able to image the eruption cloud within the first few hours of the eruption. A sequence of 97 SEVIRI re-trievals of SO2 total column and ice mass for the time period 11:00 UT, 20 May to
11:00 UT, 21 May (Movie S1;http://www.atmos-chem-phys-discuss.net/7/4657/2007/
acpd-7-4657-2007-supplement.zip) shows the rapid movement of the SO2and the
re-10
markable changes in the mass of ice and SO2as the cloud evolves.
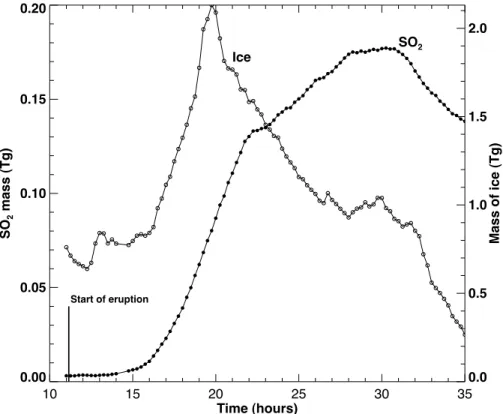
There is strong evidence of ice particles in the cloud implied by large positive tem-perature differences between the SEVIRI 11 and 12 µm channels. The effective ice cloud particle radii may have been reduced by ash pollution (Rosenfeld, 2000), and the abundance of ice in the cloud supports previous work on the ubiquity of ice in eruption
15
clouds (Rose et al., 1995; Tupper et al., 2004), especially at tropical latitudes. The ice must also have penetrated the tropopause and moistened the stratosphere, with potential radiative impacts and consequences for the stratospheric water vapour bud-get. The temporal development of the eruption cloud suggest (Fig. 2) that in the early phase, the ice masked the SO2signature, probably because much of the SO2gas was
20
sequestered by the ice particles, only to sublimate at a later stage as the ice evapo-rated. Approximately 2 Tg of ice is evident ∼20 h after the initial eruption (Fig. 2). The ice may also have played a role in depleting the cloud of HCl.
Minimum temperatures at the centre of the eruption cloud were 200 K, while there is evidence of warmer temperatures (218 K) near the cold core suggesting overshooting
25
and penetration into the stratosphere. Based on a radiosonde ascent from Guade-loupe (16.218◦N, 61.517◦W) at 12:00 UT on 20 May, the cloud-top temperatures imply geopotential heights of 17.5 km (200 K) and 20.6 km (218 K). A tropopause can be
ACPD
7, 4657–4672, 2007 Stratospheric volcanic cloud A. J. Prata et al. Title Page Abstract Introduction Conclusions References Tables Figures ◭ ◮ ◭ ◮ Back CloseFull Screen / Esc
Printer-friendly Version Interactive Discussion
EGU
identified between 16.3 and 17.2 km in this profile.
The development of the eruption column and subsequent injection of SO2 into the atmosphere occurred within the relatively short time frame of 15 min. The eruption cloud appears to have penetrated the stratosphere in the first 15 min and then suffered rapid transport towards the WSW at speeds of 15 ms−1 at a likely maximum altitude of
5
20 km. Some parts of the cloud travel further south, reaching Venezuela and further inland towards Colombia. This more southerly branch of the cloud was lower in the atmosphere, below the tropopause, causing some disruption to aviation across the Caribbean. By 18:00 UT on 20 May the SO2 content of the cloud is fully revealed by
the SEVIRI data. A maximum loading of 0.177±0.04 Tg (SO2) is estimated by SEVIRI
10
at 06:15 UT, 21 May (Fig. 1b). We caution that the SEVIRI algorithm has yet to be validated and interference from clouds may produce errors as large as 30% in certain circumstances. The SO2cloud reached 72◦W by 11:00 UT, 21 May and subsequently
moved out of the field-of-view of the SEVIRI instrument.
Beyond the first day, the A-train polar-orbiters Aqua and Aura were able to
cap-15
ture and detail the movement of the SO2 cloud as it rapidly moved westwards in the
stratospheric winds. Algorithms for determining SO2 from AIRS (Carn et al., 2005) exploit the strong SO2anti-symmetric stretch absorption feature centred near 7.3 µm
(1363 cm−1). This band is difficult to use to detect SO2because water vapour absorbs
strongly across the band, however, accurate retrievals (Prata and Bernardo, 20071)
20
can be made provided the SO2 is above about ∼3 km (Prata et al., 2003). Further-more, the masking of lower tropospheric SO2 by water vapour in this band provides
a natural filter for estimating upper troposphere/lower stratosphere (UTLS)-only SO2,
the component that has highest impact on climate. Figure 1c shows AIRS SO2column amounts (in DU) for a sequence of 6 days after the eruption. Overlaid onto this figure
25
are 6 trajectories determined from the HYSPLIT model (Draxler and Rolph, 2003). The trajectories were initialised at 11:00 UT on 20 May and plotted at 6 h intervals. The
1
Prata, A. J. and Bernardo, C.: Retrieval of Volcanic SO2Total Column from AIRS data, J. Geophys. Res., in review, 2007.
ACPD
7, 4657–4672, 2007 Stratospheric volcanic cloud A. J. Prata et al. Title Page Abstract Introduction Conclusions References Tables Figures ◭ ◮ ◭ ◮ Back CloseFull Screen / Esc
Printer-friendly Version Interactive Discussion
EGU
best correspondence between the location of the cloud on 26 May and HYSPLIT is for the trajectory at 20 km. Lower trajectories either move the cloud too slowly, too far north or too far south. AIRS and OMI tracked a part of the SO2 cloud southwards or
SSW across Venezuela and Colombia. This portion fits a trajectory at 15 km. The best estimate of the stratospheric SO2burden from AIRS data is 0.178±0.02 Tg(SO2). The
5
abruptness of the eastern edge of the SO2cloud noticeable in the sequence is due to
the narrowness of the AIRS swath.
The Soufriere Hills SO2 cloud was analysed using an updated OMI SO2 algorithm
optimized for large SO2column amounts (Krotkov et al., 2006). OMI detected the SO2
cloud on 20 May and continued to track the cloud until 11 June, when it was located
10
over the Indian Ocean (Movie S2; http://www.atmos-chem-phys-discuss.net/7/4657/
2007/acpd-7-4657-2007-supplement.zip). OMI uses UV reflected sunlight to deter-mine SO2 column amount and therefore cannot detect at night; however the greater
swath width and superior accuracy of OMI complement retrievals from AIRS and SE-VIRI. The peak burden measured by OMI was ∼0.22 Tg(SO2) (see Carn et al., 2007);
15
this difference from the AIRS result may reflect the contiguous spatial coverage of OMI that permitted mapping of the entire cloud. Figure 1d shows the OMI SO2volume mix-ing ratio (vmr) determined by assummix-ing that the cloud was centred at ∼20 km and had a vertical extent of 2 km, which is in accord with CALIPSO lidar estimates (see Carn et al., 2007) and with FLEXPART modelling (see next section). SO2 vmrs at 20 km vary
20
from ∼0.5 ppm to ∼5 ppm.
HCl was detected in the plume using retrievals from the Microwave Limb Sounder– MLS (Waters et al., 2006; Froidevaux et al., 2006). The MLS field-of-view of ∼30 km across-track and ∼150 km along-track and the sparse sampling of the moving gas cloud make accurate estimates of the erupted HCl mass difficult. Thus we have accumulated
25
the HCl retrievals at 68.13 hPa (∼20 km) over the period 1–31 May and within the geo-graphic region bounded by 180◦W to 60◦W and 0◦ to 20◦N and illustrated the result in Fig. 1e. The maximum HCl vmr occurs later than the maximum SO2vmr and gas ratios
ACPD
7, 4657–4672, 2007 Stratospheric volcanic cloud A. J. Prata et al. Title Page Abstract Introduction Conclusions References Tables Figures ◭ ◮ ◭ ◮ Back CloseFull Screen / Esc
Printer-friendly Version Interactive Discussion
EGU
El Chichon of ∼0.2–0.25 (Westrich and Gerlach, 1992), but similar to that found for the stratospheric portion from Pinatubo of ∼0.1 (Mankin et al., 1992) and for the Hekla 2000 volcanic plume of ∼0.07 (Rose et al., 2006). Assuming that the HCl is coincident with the SO2 cloud, the mass of HCl erupted is ∼3–10 kt, which is much smaller than might be expected based on petrologic arguments (Gerlach et al., 1996) or from
ob-5
servations in the Soufriere Hills volcano tropospheric plume (Edmonds et al., 2002). The small mass of HCl, particularly at the early stages of the cloud’s evolution suggest that “scrubbing” of HCl is occurring, either through scavenging by ice or by removal in condensed supercooled water (Tabazedeh and Turco, 1993).
4 Modelling the dispersion of the cloud
10
To simulate the dispersion of the SO2 cloud, calculations with the
La-grangian particle dispersion model FLEXPART (Stohl et al., 1998; Stohl et al., 2005) were made (Movie S3; http://www.atmos-chem-phys-discuss.net/7/4657/2007/
acpd-7-4657-2007-supplement.zip). FLEXPART was originally developed to simulate the dispersion of dangerous substances from point sources and was validated for such
15
applications with data from continental-scale tracer experiments (Stohl et al., 2005) . Since then it has been applied in a large number of studies on atmospheric transport, for instance intercontinental pollution transport or stratosphere-troposphere exchange. FLEXPART is a pure transport model and no removal processes were considered here. FLEXPART was driven with operational analyses from the European Centre for
20
Medium-Range Weather Forecasts with 1◦×1◦ resolution (derived from T319 spectral truncation) and a nest with 0.36◦×0.36◦resolution (derived from T799 spectral trunca-tion) in the region (108–27◦W, 9–54◦N). The resolution of the 91-level ECMWF data in
the altitude range of interest here, 17–20 km, is about 500 m. In addition to the analy-ses at 00:00, 06:00, 12:00 and 18:00 UTC, 3-h forecasts at intermediate times (03:00,
25
09:00, 15:00, 21:00 UTC) were used. Since the altitude of the SO2 injection was not well known beforehand, FLEXPART scenarios with injections at different 500 m
alti-ACPD
7, 4657–4672, 2007 Stratospheric volcanic cloud A. J. Prata et al. Title Page Abstract Introduction Conclusions References Tables Figures ◭ ◮ ◭ ◮ Back CloseFull Screen / Esc
Printer-friendly Version Interactive Discussion
EGU
tude intervals were made and the model results were compared with the satellite SO2 retrievals. Finally, a simulation injecting 0.027, 0.044, 0.108∼Tg (SO2) into altitude
bins of 17.5–18, 18–18.5, and 18.5–19.5 km was made, which most closely matched the observed plume. The simulation confirms that the SO2 observed by the satellite instruments was indeed stratospheric, located at potential temperatures >380 K, or
al-5
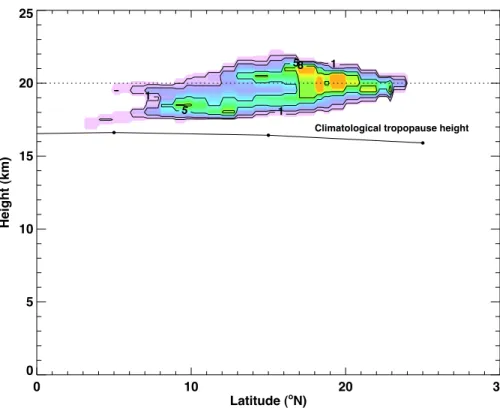
titudes >17 km. A vertical section through the cloud on 7 June 2006, as it neared the Philippines (∼127◦E) is shown in Fig. 3. The full-width at half-maximum of the layer is ∼2 km, the height of the maximum concentration is 20 km and it is located between 17–21◦N. This is further north than OMI retrievals suggest (∼10◦N), but the height and layer depth agree well with CALIPSO first-light data. The section also suggests a
10
double-layer structure and a slight tilt with latitude. Since the material was initially in-jected below 19.5 km, there must have been substantial uplift in the ascending branch of the Brewer-Dobson circulation, indicating future global redistribution of the SO2 in
the stratospheric overworld. The fate of the SO2will likely be complete conversion to aqueous sulfuric acid in the stratosphere where it will remain for 1–2 years.
15
5 Discussion
The combined use of three different satellite-based measurements of the total column of SO2 provide a high degree of confidence that 0.1±0.01 Tg(S) was injected into the
stratosphere from the 20 May 2006 eruption of Soufriere Hills volcano. A Lagrangian model confirms that the SO2 layer travelled rapidly westwards at a height of ∼20 km.
20
The layer thickness (∼2 km, full width half-maximum) and height agree with first-light observations from the CALIPSO lidar. The typical time constant for conversion of SO2
to H2SO4 is ∼3 weeks, so much of this layer is likely to be sulfate. The ability of OMI/AIRS to track the clouds for 23 days and over more than 18 000 km suggests these instruments will be very useful for providing better estimates of volcanic emissions and
25
assist Volcanic Ash Advisory Centres (VAACs) to locate these hazardous clouds. It is worth noting that as the cloud approached the busy Australian/Japan flight routes,
ACPD
7, 4657–4672, 2007 Stratospheric volcanic cloud A. J. Prata et al. Title Page Abstract Introduction Conclusions References Tables Figures ◭ ◮ ◭ ◮ Back CloseFull Screen / Esc
Printer-friendly Version Interactive Discussion
EGU
advisories were issued to the Meteorological Watch Offices and airlines based on these satellite SO2 retrievals. The airline industry chose to fly underneath the cloud, rather
than divert flights and incur extra fuel costs. No encounters were reported.
The AIRS 7.3 µm band is most sensitive to UTLS SO2, where interference from wa-ter vapour effects is minimised and thus the AIRS SO2 is indicative of SO2 likely to
5
have an impact on global climate. Climate models use Aerosol Optical Depth (AOD) or indices of volcanic eruption magnitude, as measures of the radiative effect of strato-spheric aerosols. AOD is linearly related to the total column sulfate (Kiel and Briegleb, 1993), and the radiative forcing is linearly related to AOD (Douglass and Knox, 2005). These new satellite estimates of SO2total column can be used directly in climate
mod-10
els to assess the impact on atmospheric radiation. Serious concern over the warming effects of increasing CO2levels in the atmosphere has led to a proposal to inject S into
the tropical stratosphere as a geo-engineering tool for cooling the climate (Crutzen, 2006; Wigley, 2006). An approach like this will rely on knowledge of the current sulfate loading of the stratosphere and means for estimating the loading due to volcanic
erup-15
tions, some in very remote locations and with little infrastructure to make reliable SO2
measurements. Applying linear scaling arguments based on the impact of Pinatubo on surface temperatures, viz. 10 Tg(S) produced ∼0.6 K surface cooling, the Soufriere Hills SO2 cloud would cause <0.01 K of global surface cooling and is unlikely to have
any noticeable affect. Less than 10 kt of HCl was detected in the cloud suggesting that
20
HCl is efficiently removed and reduces the likelihood of serious ozone depletion from this stratospheric injection. The long-range transport and dispersion also suggests there would be negligible local effects due to this cloud.
Acknowledgements. The AIRS Science Team are thanked for providing the AIRS level 1b
ge-olocated radiance data and the MLS Science Team are thanked for supplying the v5.2 HCl
25
ACPD
7, 4657–4672, 2007 Stratospheric volcanic cloud A. J. Prata et al. Title Page Abstract Introduction Conclusions References Tables Figures ◭ ◮ ◭ ◮ Back CloseFull Screen / Esc
Printer-friendly Version Interactive Discussion
EGU
References
Bluth, G. J. S., Schnetzler, C. C., Krueger, A. J., and Walter, L. S.: The contribution of explo-sive volcanism to global atmospheric sulphur dioxide concentrations, Nature, 366, 327–329, 1993.
Carn, S. A., Strow, L. L., de Souza-Machado, S., Edmonds, Y., and Hannon, S.: Quantifying
5
tropospheric volcanic emissions with AIRS: the 2002 eruption of Mt. Etna (Italy), Geophys. Res. Lett., 32(2), L02301, doi:10.1029/2004GL021034, 2005.
Carn, S. A., Krotkov, N. A., Yang, K., Hoff, R. M., Prata, A. J., Krueger, A. J., and Levelt, P. F.: Extended observations of volcanic SO2 and sulfate aerosol in the stratosphere, Atmos. Chem. Phys. Discuss., 7, 2857–2871, 2007,
10
http://www.atmos-chem-phys-discuss.net/7/2857/2007/.
Crutzen, P.: Albedo enhancement by stratospheric sulfur injections: A contribution to resolve a policy dilemma?, Clim. Change, 77, 211–219, doi:10.1007/s10584-006-9101-y, 2006. Deshler, T., Andersen-Sprecher, R., Jager, H., Barnes, J., Hofmann, D. J., Clemensha, B.,
Simonich, D., Osborn, M., Grainger, R. G., and Godin-Beekmann, S.: Trends in the
non-15
volcanic component of stratospheric aerosol over the period 1971–2004, J. Geophys. Res., 111, D10201, doi:10.1029/2005JD006089, 2006.
Douglass, D. H. and Knox, R. S.: Climate forcing by the volcanic eruption of Mount Pinatubo, Geophys. Res. Lett., 32, L05710, doi:10.1029/2004GL022119, 2005.
Draxler, R. R. and Rolph, G. D.: HYSPLIT (Hybrid Single-Particle Lagrangian Integrated
Trajec-20
tory) Model access via NOAA ARL READY Website (http://www.arl.noaa.gov/ready/hysplit4.
html), NOAA Air Resources Laboratory, Silver Spring, MD, USA, 2003.
Edmonds, M., Pyle, D., and Oppenheimer, C.: HCl emissions at Soufri `ere Hills Volcano, Montserrat, West Indies, during a second phase of dome building: November 1999 to Octo-ber 2000, Bull. Volcanol., 64, 21–30, 2002.
25
Froidevaux, L., Livesey, N. J., Read, W. G., et al.: Early Validation Analyses of Atmospheric Profiles From EOS MLS on the Aura Satellite, IEEE Trans. Geosci. Remote Sens., 44(5), 1106–1121, 2006.
Gerlach, T. M., Westrich, H. R., and Symonds, R. B.: Pre-eruption vapour in magma of the climactic Mt Pinatubo eruption: Source of the giant stratospheric sulfur dioxide cloud, in:
30
Fire and Mud, Eruptions and Lahars of Mount Pinatubo, Philippines, edited by: Newhall, C. G. and Punongbayan, R. S., University of Washington Press, Seattle, 415–433, 1996.
ACPD
7, 4657–4672, 2007 Stratospheric volcanic cloud A. J. Prata et al. Title Page Abstract Introduction Conclusions References Tables Figures ◭ ◮ ◭ ◮ Back CloseFull Screen / Esc
Printer-friendly Version Interactive Discussion
EGU
Halmer, M. M., Schmincke, H.-U., and Graf, H.-F.: The annual volcanic gas input into the atmosphere, in particular into the stratosphere: a global data set for the past 100 years, J. Volcanol. Geotherm. Res., 115, 511–528, 2002.
Kiehl, J. T. and Briegleb, B. P.: The relative roles of sulfate aerosols and greenhouse gases in climate forcing, Science, 260, 311–314, 1993.
5
Krotkov, N. A., Carn, S. A., Krueger, A. J., Bhartia, P. K., and Yang, K.: Band Residual Difference algorithm for retrieval of SO2from the Aura Ozone Monitoring Instrument (OMI), IEEE Trans. Geosci. Rem. Sens., 44(5), 1259–1266, doi:10.1109/TGRS.2005.861932, 2006.
Krueger, A. J., Walter, L. S., Bhartia, P. K., Schnetzler, C. C., Krotkov, N. A., Sprod, I., and Bluth, G. J. S.: Volcanic sulphur dioxide measurements from the total ozone mapping spectrometer
10
instruments, J. Geophys. Res., 100, 14 057–14 076, 1995.
Mankin, W. G., Coffey, M. T., and Goldman, A.: Airborne observations of SO2, HCl, and O3
in the stratospheric plume of the Pinatubo volcano in July 1991, Geophys. Res. Lett., 19(2), 179–182, 1992.
McGonigle, A. J. S., Oppenheimer, C., Galle, B., Mather, T. A., and Pyle, D. M.: Walking
15
traverse and scanning DOAS measurements of volcanic gas emission rates, Geophys. Res. Lett., 20(19), 1985–1989, doi:10.1029/2002GL015827, 2002.
Prata, A. J., O’Brien, D. M., Rose, W. I., and Self, S.: Global, long-term sulphur diox-ide measurements from TOVS data: A new tool for studying explosive volcanism and climate, Volcanism and the Earth’s Atmosphere, Geophysical Monograph, 139, 75–92,
20
doi:10.1029/139GM05, 2003.
Robock, A.: Volcanoes and Climate, Rev. Geophys., 38(2), 191–219, 2000.
Rosenfeld, D.: Suppression of rain and snow by urban and industrial air pollution, Science, 287, 1793–1796, 2000.
Rose, W. I., Delene, D. J., Schneider, D. J., Bluth, G. J. S., Krueger, A. J., Sprod, I., McKee,
25
C., Davies, H. L., and Ernst, G. G. J.: Ice in the 1994 Rabaul eruption cloud: Implications for volcano hazard and atmospheric effects, Nature, 375, 477–479, 1995.
Tupper, A., Carn, S. A., Davey, J., Kamada, Y., Potts, R. J., Prata, A. J., and Tokuno, M.: An evaluation of volcanic cloud detection techniques during recent significant eruptions in the western ‘Ring of Fire’, Rem. Sens. Environ., 91, 27–46, 2004.
30
Rose, W. I., Millard, G. A., Mather, T. A., et al.: The atmospheric chemistry of a 33–34 hour old volcanic cloud from Hekla Volcano (Iceland): Insights from direct sampling and the applica-tion of chemical box modeling, J. Geophys. Res., 111, D20206, doi:10.1029/2005JD006872,
ACPD
7, 4657–4672, 2007 Stratospheric volcanic cloud A. J. Prata et al. Title Page Abstract Introduction Conclusions References Tables Figures ◭ ◮ ◭ ◮ Back CloseFull Screen / Esc
Printer-friendly Version Interactive Discussion
EGU
2006.
Stohl, A., Hittenberger, M., and Wotawa, G.: Validation of the Lagrangian particle dispersion model FLEXPART against large scale tracer experiment data, Atmos. Environ., 32, 4245– 4264, 1998.
Stohl, A., Forster, C., Frank, A., Seibert, P., and Wotawa, G.: Technical note: The Lagrangian
5
particle dispersion model FLEXPART version 6.2, Atmos. Chem. Phys., 5, 2461–2474, 2005,
http://www.atmos-chem-phys.net/5/2461/2005/.
Tabazedeh, A. and Turco, R. P.: Stratospheric chlorine injection by volcanic eruptions: HCl scavenging and implications for ozone, Science, 260, 1082–1086, 1993.
Waters, J. W., Froidevaux, L., Harwood, R. S., et al.: The Earth Observing System Microwave
10
Limb Sounder (EOS MLS) on the Aura satellite, IEEE Trans. Geosci. Remote Sens., 44(5), 1075–1092, 2006.
Westrich, H. R. and Gerlach, T. M.: Magmatic gas source for the stratospheric SO2cloud from the June 15, 1991 eruption of Mount Pinatubo, Geology, 20(10), 867–870, doi:10.1130/0091-7613, 1992.
15
Wigley, T. M. L.: A combined mitigation/geoengineering approach to climate stabilization, Sci-ence, 314, 452–454, 2006.
ACPD
7, 4657–4672, 2007 Stratospheric volcanic cloud A. J. Prata et al. Title Page Abstract Introduction Conclusions References Tables Figures ◭ ◮ ◭ ◮ Back CloseFull Screen / Esc
Printer-friendly Version Interactive Discussion
EGU
Fig. 1. (a) MODIS-Terra false-colour image of the Soufriere Hills eruption cloud acquired at 15:15 UT on 20 May 2006. (b) Total column SO2 from MSG-SEVIRI at 06:15 UT on 21 May 2006; grey coloured areas are regions of the cloud where SO2 cannot be retrieved because the cloud is too opaque. (c) AIRS SO2 total column retrievals for 21–26 May 2006. Also shown are HYSPLIT trajectories at six different altitudes. The trajectory at 20 km matches the AIRS ob-servations best. (d) OMI SO2 volume mixing ratio calculated for a plume at 20 km with a width of 2 km for the period 20 May to 6 June. (e) MLS HCl vol-ume mixing ratios at ∼68 hPa (∼20 km) for the period 20–31 May.
ACPD
7, 4657–4672, 2007 Stratospheric volcanic cloud A. J. Prata et al. Title Page Abstract Introduction Conclusions References Tables Figures ◭ ◮ ◭ ◮ Back CloseFull Screen / Esc
Printer-friendly Version Interactive Discussion EGU 10 15 20 25 30 35 Time (hours) 0.00 0.05 0.10 0.15 0.20 SO 2 m a s s (T g ) Ice SO2 Start of eruption 0.0 0.5 1.0 1.5 2.0 Ma s s o f ic e (T g )
ACPD
7, 4657–4672, 2007 Stratospheric volcanic cloud A. J. Prata et al. Title Page Abstract Introduction Conclusions References Tables Figures ◭ ◮ ◭ ◮ Back CloseFull Screen / Esc
Printer-friendly Version Interactive Discussion EGU 0 10 20 30 Latitude (oN) 0 5 10 15 20 25 H e ig h t (k m ) 1 1 1 5 58
Climatological tropopause height
Fig. 3. Vertical section through the model simulation near 127◦E showing SO
2concentrations