HAL Id: hal-00296572
https://hal.archives-ouvertes.fr/hal-00296572
Submitted on 17 Jun 2008
HAL is a multi-disciplinary open access
archive for the deposit and dissemination of
sci-entific research documents, whether they are
pub-lished or not. The documents may come from
teaching and research institutions in France or
abroad, or from public or private research centers.
L’archive ouverte pluridisciplinaire HAL, est
destinée au dépôt et à la diffusion de documents
scientifiques de niveau recherche, publiés ou non,
émanant des établissements d’enseignement et de
recherche français ou étrangers, des laboratoires
publics ou privés.
Boundary Layer: impact of BrO on MSA production
K. A. Read, A. C. Lewis, S. Bauguitte, A. M. Rankin, R. A. Salmon, E. W.
Wolff, A. Saiz-Lopez, W. J. Bloss, D. E. Heard, J. D. Lee, et al.
To cite this version:
K. A. Read, A. C. Lewis, S. Bauguitte, A. M. Rankin, R. A. Salmon, et al.. DMS and MSA
measure-ments in the Antarctic Boundary Layer: impact of BrO on MSA production. Atmospheric Chemistry
and Physics, European Geosciences Union, 2008, 8 (11), pp.2985-2997. �hal-00296572�
www.atmos-chem-phys.net/8/2985/2008/ © Author(s) 2008. This work is distributed under the Creative Commons Attribution 3.0 License.
Chemistry
and Physics
DMS and MSA measurements in the Antarctic Boundary Layer:
impact of BrO on MSA production
K. A. Read1, A. C. Lewis1, S. Bauguitte2, A. M. Rankin2, R. A. Salmon2, E. W. Wolff2, A. Saiz-Lopez3, W. J. Bloss4, D. E. Heard5, J. D. Lee1, and J. M. C. Plane5
1Department of Chemistry, University of York, Heslington, York, YO19 4RR, UK 2British Antarctic Survey, High Cross, Madingley Road, CB3 0ET, Cambridge, UK
3Earth and Space Science Division, Jet Propulsion Laboratory, California Institute of Technology, Pasadena, California
91109, USA
4Department of Geography, Earth and Environmental Sciences, University of Birmingham, Birmingham, B15 2TT, UK 5Department of Chemistry, University of Leeds, Leeds LS2 9JT, UK
Received: 10 December 2007 – Published in Atmos. Chem. Phys. Discuss.: 8 February 2008 Revised: 7 May 2008 – Accepted: 16 May 2008 – Published: 17 June 2008
Abstract. In situ measurements of dimethyl sulphide (DMS)
and methane sulphonic acid (MSA) were made at Halley Station, Antarctica (75◦35′S, 26◦19′W) during February 2004–February 2005 as part of the CHABLIS (Chemistry of the Antarctic Boundary Layer and the Interface with Snow) project. DMS was present in the atmosphere at Halley all year (average 38.1±43 pptV) with a maximum monthly av-erage value of 113.6±52 pptV in February 2004 coinciding temporally with a minimum in sea extent. Whilst seasonal variability and interannual variability can be attributed to a number of factors, short term variability appeared strongly dependent on air mass origin and trajectory pressure height. The MSA and derived non-sea salt sulphate (nss-SO2−4 )
mea-surements showed no correlation with those of DMS (re-gression R2=0.039, and R2=0.001 respectively) in-line with the complexity of DMS fluxes, alternative oxidation routes, transport of air masses and variable spatial coverage of both sea-ice and phytoplankton. MSA was generally low throughout the year, with an annual average of 42 ng m−3 (9.8±13.2 pptV), however MSA: nss-SO2−4 ratios were high implying a dominance of the addition oxidation route for DMS. Including BrO measurements into MSA production calculations demonstrated the significance of BrO on DMS oxidation within this region of the atmosphere in austral sum-mer. Assuming an 80% yield of DMSO from the reaction of DMS+BrO, an atmospheric concentration of BrO equal to 3 pptV increased the calculated MSA production from DMS by a factor of 9 above that obtained when considering only
Correspondence to: K. A. Read
reaction with the hydroxyl radical. These findings have sig-nificant atmospheric implications, but may also impact on the interpretation of ice cores which previously relied on the understanding of MSA and nss-SO2−4 chemistry to provide information on environmental conditions such as sea ice ex-tent and the origins of sulphur within the ice.
1 Introduction
The presence of sulphur in the global troposphere is from a combination of sources which include sulphate from sea salt, long-range transport of anthropogenic SO2, via
DMS from the breakdown of dimethylsulphoniopropionate (DMSP) present in phytoplankton, in addition to intermit-tent injections from volcanic emissions, land biosphere and biomass burning. As SO2 is rapidly oxidised and either
rained out or deposited to particles its impact on the sul-phur budget is largely regional rather than global; there-fore dimethyl sulphide (DMS), mainly dominated by the smaller biogenic inputs (Liss et al., 1997), is the major source of oxidised sulphur compounds at high southern lati-tudes away from direct continental source emissions of SO2
(Gondwe et al., 2003). Once in the troposphere the non-sea salt sulphate particles (nss-SO2−4 ) and methane sulphonic
acid (MSA), resulting from the oxidation of DMS, are the main sources of cloud condensation nuclei (CCN) which is believed to alter the radiation budget of the earth affecting the surface temperature and climate (Charlson et al., 1987).
As well as their importance for CCN formation, a partic-ular relevance of MSA and nss-SO2−4 in Antarctica comes from their use as environmental proxies in ice cores. MSA
in near-coastal ice cores has been proposed as an indicator of past sea ice conditions (Curran et al., 2003), although it has to be used with care (Abram et al., 2007). The interpreta-tion relies on the ice core concentrainterpreta-tion (hence the airborne concentration) being determined mainly by production, and to a lesser extent by transport. If the chemical transformation of DMS to MSA was affected by changing conditions, this would further modify the interpretation of this proxy, so this provides another motivation for understanding the processes in this oxidation.
The longest record of specifically DMS measurements in the Southern Hemisphere (S.H.) is from Cape Grim, Tasmania and dates back to 1976 (Ayers et al., 1995a, 1997). Although a great deal of information has been gained from these measurements the complexity of the oxidation pro-cesses is such that the fate of DMS is some way from being fully understood. In the Antarctic there have been various measurement campaigns for DMS on ships in the Weddell sea (Davison et al., 1995; Staubes and Georgii, 1993) and comprehensive sulphur studies such as ISCAT 1998/2000 (Investigation of Sulfur chemistry in the Antarctic Troposphere) and SCATE (Sulphur Chemistry in the Antarctic Troposphere Experiment)(Mauldin-III et al., 2001; Berresheim et al., 1998a) have taken place at Amundsen-Scott (South Pole, 90◦0′0′′S, 139◦16′0′′W)(Davis et al., 2004), Dumont d’Urville (66◦40′S, 140◦1′E) (Legrand et al. 2001), and Palmer Station (64◦46′S, 64◦03′W) (Berresheim et al., 1998b), but have focussed mainly on austral summer. Main outcomes of these large campaigns have shown that those coastal stations such as Palmer Station (Antarctic Peninsula) typically see highly variable DMS mixing ratios which are influenced strongly by meteorological conditions and specifically by intensive low pressure storms which provide a means for strong vertical exchange between ocean and atmosphere for this species (Berresheim et al., 1998b). More recently however, a study of five years (1999–2003) of year-round DMS data collected at the Antarctic island site of Dumont d’Urville (66◦40′S, 140◦1′E), found that the variability in levels was strongly controlled by the marine biota and therefore by the oceanic DMS concentrations rather than by the meteorological parameters which affect the transfer velocity coefficient (kw), or by changes in atmospheric oxidants (Preunkert et al., 2007). Studies away from the coast, for example at the South Pole, show much lower mixing ratios of DMS and its oxidation products, consistent with the above conclusions (Davis et al., 2004). Although Halley appears to be in a coastal position it is still 15 km away from the Weddell Sea which for the most part is not considered open ocean; due to the location of Halley DMS mixing ratios could be expected to display features of both types of sites.
Sulphur containing compounds in aerosol, such as sul-phate and methane sulphonate (MSA) have been measured year-round since 1983 at Neumayer (Minikin et al., 1998), at
Mawson since 1987 (Savoie et al., 1993), and began at DDU in 1991 as part of the CAASC (Coastal Antarctic Aerosol and Snowfall Chemistry) project (Wolff et al., 1998). These studies find that although MSA concentrations are low dur-ing sea ice periods, relatively high values have been seen throughout the year indicating potential origins from either DMS oxidation or as by-products from long-range transport of DMS (Ayers et al., 1997; Minikin et al., 1998). There is still however very little literature on long-term measurements of atmospheric DMS for the Antarctic region.
In recent years the reaction of DMS + BrO has been explored and found to be 60% faster than previously re-ported by Barnes et al. (1991) leading to a rate which is one order of magnitude slower than that for DMS+OH (In-gham et al., 1999). Considering BrO is often present in sig-nificantly higher atmospheric mixing ratios than OH this has an important impact on the rate of production of DMSO and hence also of MSA via the DMS+BrO route. Measurements of BrO at pptV levels alongside measurements of OH and DMS made during NAMBLEX on the West Coast of Ire-land, led Saiz-Lopez et al. (2004) to calculate the relative ox-idation rates of DMS using these laboratory study data and found that, at the levels of BrO and OH present there, the oxidation of DMS by BrO was an order of magnitude faster than that of DMS by OH.
Due to the seasonal inaccessibility of Antarctica long-term trends of BrO in this region have mainly been studied using integrated measurements obtained from satellites in space (Hegels et al., 1998). These measurements clearly show that BrO is present in the Antarctic spring all around the tic coastline. In situ measurements of BrO in the Antarc-tic are more limited and have been generally of a short-term nature however are also significant in their findings. Kre-her et al. (1997) used a zenith sky DOAS instrument to iden-tify sudden large BrO column enhancement during spring 1995 and during four successive austral springs (1999–2002) at Neumeyer. Friess et al. (2004, 2005) used a similar instru-ment to find that BrO was present in almost all air masses which had previously been in contact with sea-ice surfaces. In addition, recent shipbourne measurements made over the Antarctic sea ice by Wagner et al. (2007) show the presence of BrO in late winter, about a month earlier than the satel-lite measurements. Recent improvements in measurement techniques such as atomic resonance fluorescence and differ-ential absorption spectroscopy (DOAS) have since led to the possibility of more intense long-term studies in this region and during CHABLIS in situ measurements of tropospheric BrO were made for the first time in the Antarctic boundary layer using a LP-DOAS instrument (Saiz-Lopez et al., 2007). Most previous work on DMS and its oxidation products in Antarctica has focussed on the reactions with the OH radi-cal (Berresheim et al., 1998b; Jourdain and Legrand, 2001; Legrand et al., 2001) but this work aims to include the impact of varying BrO mixing ratios on this species’ oxidation and particularly on the production of MSA.
2 Site
Halley is situated at 75◦35′S, 26◦19′W on the Brunt Ice shelf in the southeast Weddell Sea, Coastal Antarctica. Mea-surements were made at the newly commissioned Clean Air
Sector Laboratory (CASLab) positioned 1 km south east of
the main station in the Clean Air Sector. Prevailing winds to Halley are from the east and so air often approaches the measurement site from across the ice shelf and eventually the inland plateau. This means that the CASLab is rarely influenced by the station (north of site) and any generators. Aircraft avoided the Clean Air Sector according to protocol and routine access to the CASLab is by foot or by ski. Ex-cept for a small amount produced by the base there are no local sources of anthropogenic pollution and therefore mea-surements are dominated by long-range transport processes and oceanic emissions (Jones et al., 2008).
3 Experimental
DMS was measured every hour using a gas chromatograph with flame ionisation detection (Read et al., 2007). The de-tection limit for this species was 5 pptV and the uncertainty on the measurement <5 pptV. DMS was calibrated on the basis determined in the laboratory that its response is 0.65 times that of propane. Propane was calibrated using a com-mercial 28 hydrocarbon component in nitrogen calibration cylinder (NPL, UK) at the ppbV level, in addition to a diluted pptV NMHC standard. The relationship between DMS and propane was verified in laboratory experiments both before and after the CHABLIS campaign. Main precision errors in the measurement of DMS and propane arise from peak inte-gration (Read et al., 2007).
Size-segregated aerosol samples were collected on a 7-stage Sierra Instruments high-volume cascade impactor mounted on the roof of the CASlab. Filters were usually changed at fortnightly intervals, and were stored frozen un-til they could be transported to the UK for analysis. Ma-jor anions (chloride, MSA, sulphate and nitrate) and cations (sodium, calcium, magnesium and potassium) were anal-ysed using Dionex ion chromatographs in a clean room at the British Antarctic Survey laboratories in Cambridge. Rankin and Wolff (2003) describe the cascade impactor set-up and the analysis techniques in more detail.
The Differential Optical Absorption Spectroscopy (DOAS) instrument was located in the Clean Air Sector Laboratory (CASLab). An effective light path of 8 km at a height of 5 m above the snowpack was set up between the CASLab and a retro-reflector array positioned 4 km to the east. Further information on the instrumental design and spectral de-convolution procedures can be found in Plane and Saiz-Lopez (2006).
OH and HO2 were measured from a 5m high inlet
on the roof of a containerised laboratory adjacent north
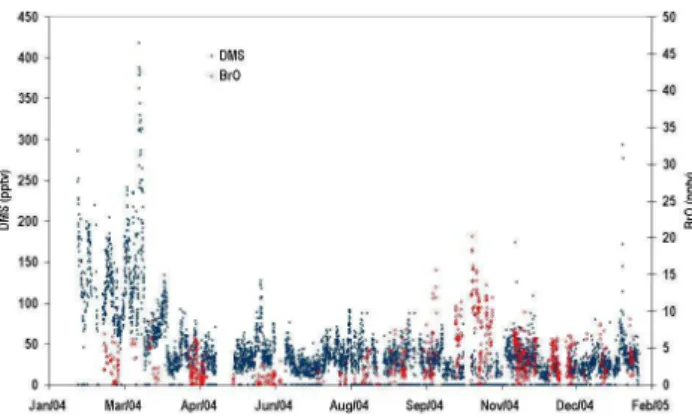
Fig. 1. Time-series of dimethyl sulphide (DMS), and bromine oxide (BrO) for February 2004-February 2005.
of the CASLab. The technique of on-resonance laser-induced fluorescence was used to detect OH, with HO2
measured following chemical conversion through addition of NO. Calibrations were carried out using photolysis of water vapour at 185 nm and yielded detection limits of 4.8×10⁻³molecules cm−3and 0.068 pptV for HO and HO2
respectively. Overall uncertainty for the measurements was calculated to be ±27%. Bloss et al. (2007) describe the ex-perimental set-up in more detail.
4 Results and discussion
4.1 Dimethyl sulphide (DMS)
DMS measurements from February 2004–February 2005 are illustrated in Fig. 1 along with measurements of BrO from the Long Path DOAS.
Higher mixing ratios of DMS were expected and ob-served in the summer associated with both a decrease in sea ice cover and with highest biogenic emissions (Ayers et al., 1995b; Read et al., 2007). The sum-mer (December–February) average seen in this study of 46±50 pptV (<5–286 pptV) was lower than measurements made by Berresheim et al. (1998b) at Palmer Station who reported an average of 94 pptV (6–595 pptV) during 1994, and also lower than the January-February average of 170 pptV±180 pptV measured during five summers at DDU between 1999–2003. At DDU the summer concentrations ranged between 60 pptV in 2003, which is more in-line with this study; and 244 pptV in 2002, although the latter excluded two days of extremely elevated mixing ratios of 5000 pptV which would increase the average by a factor of two (Pre-unkert et al., 2007). Between the studies a major differ-ence was seen in the occurrdiffer-ence of the annual maximum of the measurements which at Halley (418.1 pptV) was in early March rather than in late January like at DDU. Halley is situated further “inland” than most other Antarctic sites; for example, 4◦(500 km) further south than the site at
Neu-Table 1. Mean Atmospheric concentrations of Na+, Cl−, SO2−4 , and MSA over the 2001 (Rankin and Wolff, 2003) and 2004-2005 sampling
Ion Mean Concentration Mean Concentration ng m−3Jan–Dec 2001 ng m−3Feb 2004–Feb 2005
Na+ 145 94
Cl− 272 225
SO2−4 156 99
MSA 84 42
mayer (Minikin et al., 1998); and so the effect of the ice re-treat occurs later and the later peak levels in DMS at Halley appear to reflect this. A temporally comparable study in-volving a cruise in the Drake passage and around Antarctica in March–April 1986 reported an average value of 106 pptV (4.4 nmol m−3) for DMS (Berresheim, 1987) in-line with the
average of 73.7±63.7 pptV observed during those months in this study. The results from Berresheim et al., also showed high scatter similar to this study with data varying between 16.8 pptV (0.7 nmol m−3) and 235.2 pptV (9.8 nmol m−3),
which they attribute to changes in wind speed and wind di-rection.
Although sea ice cover is vast around the continent for most of the year, even in winter, polynyas (areas of open water) are kept open by the prevailing easterly wind to Halley providing a local region for sea-air transfer of such species and a source of water vapour throughout the year (Wolff et al., 1998). The DMS levels measured at Hal-ley throughout winter (June–August, 28.7±20.1 pptV) and the rest of the year are thought to be due to a combi-nation of small emissions from these polynas and from long-range transport from more northern temperate latitudes (DMS has a lifetime of ∼6 days based on a 24 h [OH] of 1×10⁵molecules cm−3 at 260 K). The measurements made by Preunkert et al., 2007 at DDU report constant average values of between 13 pptV in 2001 and 16 pptV in 2002 for June–October which are lower than those observed at Hal-ley. Peaks in October and late November of up to 175 pptV are harder to attribute to exact sources, however at these times the wind speed around the continent reached 20 m/s (Jones et al., 2008), which is expected to enhance sea-air flux of this species from local areas of open water in addition to increasing the rate of transport from further north.
4.2 Ions
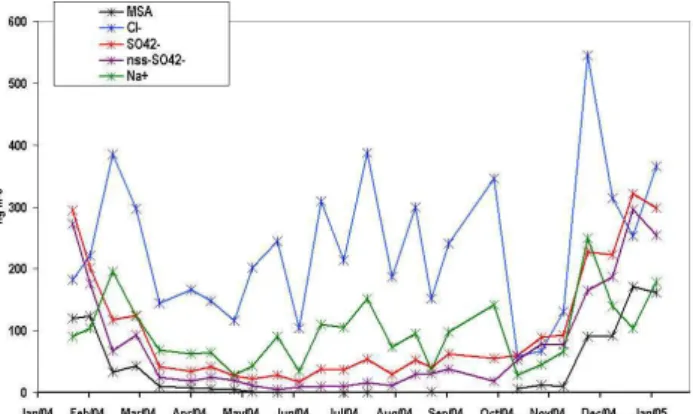
The seasonal variations of the ions are shown in Fig. 2 and mean concentrations for the ions from this experiment are detailed within Table 1 which also shows averages for the same ions in 2001 (Rankin and Wolff, 2003).
Sodium (Na+, a measure of sea salt) concentrations mea-sured during CHABLIS were much more in-line with values
Fig. 2. Time-series of dimethyl sulphide (DMS), and bromine oxide (BrO) for February 2004–February 2005
reported for Halley between the years 1991–1993 by Wagen-bach et al. (1998) (62 ng m−3 Na+, 200 ng m−3 total salt) rather than with the 2001 study which saw a mean value of over a factor of two higher. As stated within the 2001 study, aerosol concentrations are highly variable which leads to large interannual variability in the measurements and it was thought that the 2001 study was characterised by an iso-lated air mass depositing an unusually high loading of these species onto only one set of filters (Rankin and Wolff, 2003). MSA was generally low throughout the year, showing an average of 42 ng m−3 (9.8±13.2 pptV), significantly lower than the 84 ng m−3measured by Rankin and Wolff in 2001 but similar to a study by Minikin in 1998 in which three Antarctic sites (Neumayer, Dumont d’Urville, Halley) were compared and Halley (data from 1991–1992) was shown to display the lowest values for this species of 3.5 pptV (15 ng m−3)(Minikin et al., 1998).
Cl−was present in similar average concentrations during
both the 2001 and 2004/2005 experiments but also showed some interannual variability between January–February 2004 and January–February 2005 averaging 161 ng m−3 and 311 ng m−3, respectively. It showed a high variabil-ity throughout the year peaking in spring and then again in early summer with total fraction values rarely dropping below 100 ng m−3 (Fig. 2). Along with Na+, the Cl− ion was most dominant on the larger size fractions whereas ions such as MSA and SO2−4 , formed from gas phase species such as DMS were observed within the submicron frac-tion (Fig. 3). This was typical behaviour for these lat-ter species although in contrast to previous studies the ma-jority of the MSA and SO2−4 was found in the <0.25 µm mode rather than in the 0.3 µm (Jourdain and Legrand, 2002; Rankin and Wolff, 2003).
Sulphate (SO2−4 ) was also present from sea salt.
Equa-tion (1) below can be used to provide a derived quantity non-sea-salt sulphate as an indicator of biogenic activity.
Here k is equal to 0.252, the weight ratio between sulphate and sodium in seawater (Wagenbach et al., 1998). There has been discussion as to whether a lower ratio should be used to account for the finding that sea ice surfaces, with a lower sulfate/Na ratio, act as a source of sea salt (Wagen-bach et al., 1998); however, the difference does not affect the main results of this paper. The calculated nss-SO2−4 is also plotted on Fig. 2.
4.3 DMS, BrO, MSA and nss-SO42−seasonal variation
During the CHABLIS experiment MSA particulate and the derived nss-SO42− concentrations peak in late January
un-til early February and then drop off very sharply when the DMS mixing ratios peak in late February-early March (Figs. 1 and 2). This rapid decrease in mixing ratios at the end of austral summer was also observed in a study by Prospero et al. (1991) and implies perhaps that the pro-cess responsible for converting DMS into MSA is less ef-ficient at this time. Regression analysis highlights no cor-relation between DMS and the two particulates (R2=0.039, and R2=0.001 for MSA and derived nss-SO42−respectively)
throughout the year. The background mixing ratios in DMS throughout winter were also not mirrored by the MSA con-centrations, a finding similar to that of Jourdain et al. (2001), who attributed the winter DMS to either small emissions from open water present in sea ice located offshore and/or advection from further north in conjunction with a longer lifetime of DMS (Jourdain and Legrand, 2001). Davi-son et al. (1996), on a cruise between the UK and the Antarc-tic, observed poor regression (R2=0.3) between DMS and MSA measurements even though in that study measurements appeared to coincide. In this study the poor correlation is thought to be a consequence of either that a) the DMS ob-served at Halley is emitted from the Weddell Sea region but the MSA is a result of processing of DMS emitted from ar-eas substantially further north or b) that emissions vary little throughout the summer months (December–March). Levels of oxidants such as OH and BrO measured at the site show little month to month variation with respect to the 1 sigma standard deviations on the average measurements (January, 0.018±0.013 pptV and 1.9±3.0 pptV respectively compared to February, 0.015±0.009 pptV and 2.7±2.2 pptV respec-tively), however these are local measurements and may not be representative of the oxidant levels along the back trajec-tory of the air mass. BrO measurements show a seasonal cycle which peaks in austral Spring coinciding with the on-set of sunlight and the lowest DMS measurements. Refer to Saiz Lopez et al. (2007) for more discussion of the BrO measurements including their seasonal variation.
Both DMS and MSA show some interannual variabil-ity between the summer months. DMS mixing ratios col-lected from 1 to 8 February 2005 averaged 31±10 pptV, significantly lower than the average for the same pe-riod in 2004 of 136±59 pptV. Measurements were
fin-Fig. 3. Distribution of ions between stages.
ished on 8 February 2005 and so it remains unknown as to whether the levels would increase throughout the month and into March as in the previous year. MSA also shows some interannual variability between the two sum-mers averaging 19.4±15.6 pptV (83.2 ng m−3) in January–
February 2004 and 33.0±10.2 pptV (141.3 ng m−3) in
January–February 2005. Interannual variability has been observed many times before with these types of measure-ments and in experimeasure-ments which span two summers, for example Minikin et al. (1998) observed MSA concentra-tions of 1.3±1.7 pptV (5.5±7.2 ng m−3) and 5.1±6.3 pptV
(21.9±26.9 ng m−3) for December 1991 and December
1992 respectively and 3.0±2.1 pptV (13.0±8.9 ng m−3) and
12.5±9.6 pptV (53.6±41.3 ng m−3) for the subsequent
Jan-uary 1992 and 1993.
5 Factors affecting DMS and MSA measurements and their interannual variability
Although Halley is ideally situated on the ice shelf in close proximity to the Weddell Sea, a number of conditions ex-ist which will affect the DMS mixing ratios measured at the CASLab. These will include physical, meteorological, and chemical factors. A consequence of the varying conditions is that it is difficult to compare measurements from different sites and/or from ships; and interannual variability also arises as a result of these factors.
Extensive ice cover during most of the year minimises gas exchange between seawater and the overlying atmosphere. Variability in the extent of cover spatially, affects both local mixing ratios for these species and accounts for a large ma-jority of the year to year interannual variability of DMS ob-served in this region of the atmosphere (Cosme et al., 2005). During February 2004–February 2005 the sea ice cover was at a minimum during March 2004 in-line with the highest measured DMS mixing ratios. In agreement with the Pros-pero et al. (1991) study the particulate MSA and derived nss-SO42−measurements from CHABLIS are less strongly
(a)
(b) Fig. 4. (a) Spatial distribution of chlorophyll for winter 2004 above and winter 2005 below from http://seawifs.gsfc.nasa.gov/ and (b). 8-day air mass back trajectories for winter 2004 (left) and winter 2005 (right).
correlated with the sea ice cover showing sharply decreasing concentrations during this time of the year.
If the sea-ice conditions are favourable for DMS emis-sions, there still has to be a sufficient distribution and quan-tity of phytoplankton present in the sea water within the ex-posed areas. Studies have shown that phytoplankton blooms are often associated with sea ice retreat, shallow waters, with areas of strong upwelling and regions of high eddy ki-netic energy; conditions prevalent in the Weddell Sea region (Comisco et al., 1993). Figure 4a shows chlorophyll data, (an indicator of phytoplankton blooms) from seawifs satellite data (http://seawifs.gsfc.nasa.gov/) for austral winter 2004 and 2005 which highlights variability in both the chlorophyll and the sea ice cover from year to year. It is impossible to identify whether these variations are the reason for the
in-terannual variability in the DMS mixing ratios without ad-ditionally considering the air mass origins. Additional com-plications arise from the fact that different species of phyto-plankton have different abilities to produce DMS. Following from this Fig. 4b shows that there were far fewer directly ad-vected air masses from ocean sectors which had passed over highly-concentrated-chlorophyll regions during the second year. Southwest of the site is Precious Bay, an area which often has open water even in winter, and during winter peaks in DMS corresponded to these air masses or occurred during small low pressure storms in which there were higher temper-atures experienced at the site. During the SCATE campaign low pressure storm systems were also shown to be a transport mechanism for DMS within the free troposphere influenc-ing the concentrations of its oxidation products by downward mixing (Berresheim and Eisele, 1998). Unfortunately due to technical difficulties DMS data was not obtained during the major low pressure storm which occurred in May 2004 dur-ing this campaign (Jones et al., 2007).
Finally en route to the site there must also be the right chemical conditions to a) allow DMS to be transported with-out oxidation in order to measure DMS and/or to b) allow oxidation to DMSO and then to MSA for MSA to be mea-sured on the filters. These conditions include the various ox-idant concentrations and distribution and will impact on the lifetime and concentration of both DMS and therefore its ox-idation products.
5.1 Oxidation of DMS by OH
Much focus has in the past been on the reaction of DMS+OH as the primary oxidation route for this species (Berresheim et al., 1998b; Jourdain and Legrand, 2001; Legrand et al., 2001), particularly with respect to the pro-duction of DMSO. The DMSO can then be oxidised further to produce either MSA or nss-SO2−4 , and it is these oxidised products which can be found in ice cores and used as indica-tors of air origin.
The reaction of DMS+OH proceeds via two independent channels (Hynes et al., 1986).
OH + CH3SCH3→CH3SCH2+H2O (abstraction) (R1)
k1(265 K)=4.50 × 10⁻¹²cm3molecule−1s−1
OH + CH3SCH3→CH3S(OH)CH3 (addition) (R2)
k2(265 K)=2.21 × 10⁻¹¹cm3molecule−1s−1
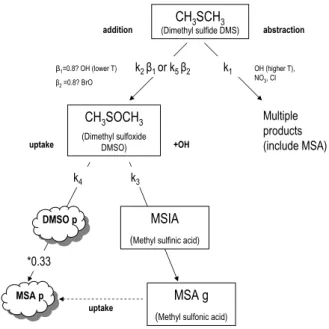
The addition channel leads to CH3S(OH)CH3 or DMSO
and subsequently to a greater relative production of MSA rather than nss-SO42−, as compared to the abstraction
channel (Fig. 5). An alternative route for the produc-tion of MSA exists via the abstracproduc-tion channel but it
CH3SCH3
(Dimethyl sulfide DMS) abstraction addition β1=0.8? OH (lower T) β2=0.8? BrO CH3SOCH3 (Dimethyl sulfoxide DMSO) k1 k2 β1 or k5 β2 uptake k3 Multiple products (include MSA) DMSO p MSA p *0.33 MSIA
(Methyl sulfinic acid)
MSA g
(Methyl sulfonic acid)
+OH
OH (higher T), NO3, Cl
uptake
k4
Fig. 5. Simplified schematic of DMS oxidation chemistry. is a much more complex route involving NO2 chemistry
(Von Glasow et al., 2004) which considering that in the Antarctic environment NO2 mixing ratios are typically
<15 pptV, this is considered a negligible source of MSA.
The MSA:nss-SO42−ratio, R (Legrand and Pasteur, 1998)
can provide much information as to the oxidation pathways of DMS, although care must be taken to interpret the vari-ous contributions to the nss-SO42−concentrations from
non-DMS sources such as sulphate from continental areas and downward transport from the stratosphere. Using210Pb lev-els Minikin et al. (1998) reported values for the FT non-DMS sulphate for coastal Antarctica of 15 (±5) ng m−3for March–
September, and 27 (±13) ng m−3 for October–February,
which can be subtracted from the nss-SO42−concentration
before calculation of the ratio. This gives Rbwhich can
sub-sequently be compared to literature and interpreted with re-spect to DMS oxidation. MSA:nss-SO42−ratios are shown
in Fig. 6 along with Rb. During January–February 2004
and 2005 the average Rb of 0.65±0.13 was higher than
the peak value for Halley of 0.49 ±0.05 reported for Jan-uary 1992 and also substantially higher than the annual peak values of 0.46±0.17 (Neumeyer, January 1983–1995) and of 0.28±0.05 (Dumont d’Urville, March 1983–1995) (Legrand and Pasteur, 1998), implying a dominance in the addition pathway for these measurements of DMS at Halley. In addition it is commonly thought that the addition channel is faster at low temperatures (<285 K)(Arsene et al., 1999) which could explain the higher ratios observed in this study. If we want to investigate the MSA production from DMS then we must consider the addition route to DMSO. If we first assume that the concentration of DMSO in the atmo-sphere is controlled by a) production via the DMS/OH path-way, b) reaction with OH in the gas phase (k3=1×10⁻¹⁰s−1
Fig. 6. MSA: nss-SO42− ratios R and Rb which includes an
adjustment to the nss-SO42− for a non-DMS contribution of
15±5 ng m−3 in winter and 27±13 ng m−3 in summer, (see text) calculated from cascade impactor filter measurements during CHABLIS. Error bars for Rbare also marked.
Hynes and Wine, 1996), and c) loss onto aerosols, we can calculate [DMSO] by knowing the yield (β1) of the
DMS+OH reaction, together with k4, the heterogeneous loss
rate of DMSO.
For this analysis we are focussing on the summer (December–March) measurements of DMS and MSA and the apparent interannual variability between 2004 and 2005. We have used a yield (β1) of DMSO from the DMS+OH
reaction of 0.8 (Legrand et al., 2001) and the value for het-erogeneous loss of DMSO was taken from a kinetic study by Bardouki et al. (2002) (k4=2.25×10⁻⁴s−1). DMSO is
not thought to be directly emitted from the oceans and no consideration has so far been given to the impact of other ox-idants such as Cl, and NO3on the concentration of DMSO,
because the reaction with these species is at least 2 orders of magnitude slower than with OH (Falbe-Hansen, 2000).
The following equation Eq. (2) can be used to obtain a time dependent level of DMSO using the measured DMS mixing ratios in this study. OH measurements only began in December 2004–February 2005 and so the average mea-sured 24 h value of 3.9×10⁵molecules cm−3 (0.012 pptV) (Bloss et al., 2007) was used for the analysis of both summers. Previous measurements made eleven years ear-lier show values in good agreement for February (Jeffer-son et al., 1998). Calculations were initiated applying an initial level of DMSO of 3 pptV (average measured concen-tration Legrand et al., 2001) and actual DMS mixing ratios were inputted when they were available, usually every hour.
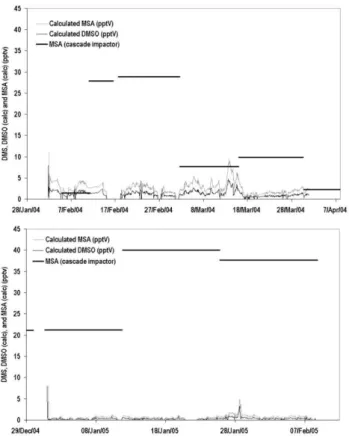
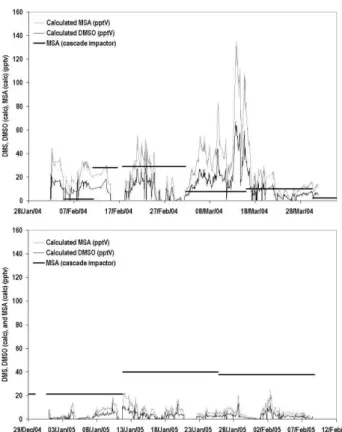
Fig. 7. Measured MSA and calculated MSA and DMSO mixing ratios for Feb–Mar 2004 (above) and Jan–Feb 2005 (below).
Roughly one third of the DMSO (DMSOp) produced is thought to be rapidly oxidised into MSA aerosol via MSIA (Legrand et al., 2001), as in Eq. (3).
[MSA]=0.33k4[DMSOp]1t (3)
1t had to be assumed and so 4 h was used based on
calcu-lations from Jourdain and Legrand (2001). This assumption obviously leads to potential errors in the calculation of abso-lute MSA however the importance of this work is to demon-strate the impact of the additional oxidation routes not solely to reproduce the absolute concentrations of MSA.
The calculated MSA mixing ratios are plotted on Fig. 7 together with the measured cascade impactor sample mixing ratios of MSA.
Looking first at the 2004 data, there is reasonable agree-ment in mid-February but there is an underestimation in the calculated [MSA] during early and late February. The DMS and MSA show different trends through this period implying that the DMS measured at the site is not wholly responsible for the measured [MSA]. The DMS is likely to have orig-inated from fresh emissions rather than having been trans-ported, whilst the MSA may have been transported from further afield. This is in line with the air mass trajectories for this time which show much of the air has travelled over the Weddell Sea region (Fig. 4b). Note: the calculation of
Table 2. The reaction rate coefficients of DMS with OH, Cl, BrO, IO, O3and NO3. DMS+. . . T =260 K Estimated lifetime (cm3molecule−1s−1) (days) OH 2×10⁻¹¹ 1.5a Cl 3.3×10⁻¹⁰ 3.5b BrO 3.94×10⁻¹³ 0.4c IO 1.3×10⁻¹⁴ 12.03d O3 <1×10⁻¹⁸ >31e NO3 f1.5–7×10⁻¹² –g
Kinetic data from Atkinson et al., 2004.
aOH assuming a 24h average of 3.9×10⁵molecule cm−3measured
during January–February 2005 (Bloss et al., 2007).
bMaximum concentration of 104 atom cm−3during August (Read
et al., 2007).
c average concentration of 3 pptV during January–March
(Saiz-Lopez et al., 2007).
d average concentration of 3 pptV during January–March
(Saiz-Lopez et al., 2007).
e24 h average ozone 15 ppbV.
fAb initio data from Jee and Tao, 2006.
gNO
3<2 pptV detection limit (Jones et al., 2007).
[DMSO] and [MSA] is based on the varying concentration of DMS measured at Halley, not its value at the point of emis-sion.
During January–February 2005 DMS mixing ratios were much lower and there is substantial underestimation by the calculated [MSA] when compared to the measured [MSA]. The air mass trajectories show more air has travelled over the continent in 2005 rather than from the northern sea regions (Fig. 4b) implying that the site received more aged air and had fewer fresh emission injections; so the DMS mixing ra-tios measured at the site may not be representative of those at the source. Underestimation of the calculated MSA im-plies either that the OH and/or DMS mixing ratios we have used in our calculations are too low, that additional oxidation routes other than that of OH+DMS are responsible for the MSA production, or that the 1t we have used is too low. 5.2 Impact of BrO mixing ratios on the oxidation of DMS Reaction rate coefficients for DMS with species other than OH are detailed in Table 2. The obvious competitor to OH is NO3but during the whole of CHABLIS it was not seen
to be above the instrumental detection limit of the LP-DOAS instrument (2 pptV). BrO however was measurable in mix-ing ratios up to 8 pptV in summer which, when considered in context with a rapid rate of DMS+BrO, represents a sig-nificant sink for DMS. IO measurements were also made and found to be present in the atmosphere in similar mix-ing ratios as those of BrO, however IO reacts more slowly
Table 3. Factor increase in calculated MSA compared to the BrO=0 pptV case whilst assuming constant yields of 0.8 and con-stant OH=0.012 pptV but changing BrO.
Concentration Factor increase in calculated MSA (pptV) (Assuming constant yield of β1
and β2=0.8 and constant OH of 0.012 pptV.
The base case is BrO=0 pptV reaction.)
0 1 1 3.68 2 6.36 3 9.02 4 11.7 5 14.4 6 17.1 7 19.8
than BrO with DMS (Table 2). Cl atoms were not mea-sured directly but inferred from non-methane hydrocarbons and found to be at a maximum of 3.4×10⁴atom cm−3during
spring (Read et al., 2007). Cl is likely to be at least a factor of 5 lower during summer, and therefore the loss of DMS through reaction with Cl is likely to be less than 20% of that through reaction with BrO during summer.
Von Glasow et al. (2004) showed that including halogen chemistry and specifically BrO into atmospheric chemistry transport models, led to an increase of 63% DMSO globally. Barnes et al. (1991) found that BrO also adds to DMS which has a major impact on our OH dominated calculations for MSA and could account for the high MSA:nss-SO42−ratios
(Fig. 6). It could also explain the underestimation in the cal-culated [MSA] versus measured [MSA] and, assuming vari-able levels, the lack of correlation between our atmospheric DMS and particulate MSA. A study by Gondwe et al. (2004) which compares modelled MSA:nss-SO42−ratios with
mea-sured, underestimates the ratio for measurements made in the Southern Ocean and Drake Passage. Although this mod-elling study was fairly crude, higher measured ratios com-pared to model predictions such as these which neglect to include BrO, may also imply an influence from this source.
We can include the reaction of BrO+DMS into our time dependent DMSO equation to give the following:
d[DMSO]/dt=(β1k2[DMS][OH] + β2k5[DMS][BrO])
−(k3[OH] + k4)[DMSO], (4)
We have used measured BrO mixing ratios for the two summer periods (Saiz-Lopez et al., 2007) whilst the OH concentration is as we treated before, set at 3.9×10⁵molecules cm−3 (Bloss et al., 2007) as this was the average of measurements throughout the 2005 summer months. Using an estimated yield (β2) of 0.8, the exact yield
not yet having been determined (Toumi, 1994), the DMSO and resultant MSA concentration increase on average by a factor of 9 (Table 3).
Fig. 8. Measured MSA and calculated MSA and DMSO mixing ra-tios for February–March 2004 (above) and January–February 2005 (below) including the contribution from BrO reactions.
Although measurements of BrO were used for this study, they are locally measured levels and so may not be represen-tative of the mixing ratios of this species at the time of DMS oxidation. Due to the nature of its sources and sinks the at-mospheric BrO concentration is likely to be more variable than that of the OH and so the sensitivity of the analysis to changing BrO has also been calculated and is also detailed in Table 3.
With the inclusion of the DMS+BrO reaction, the calcu-lated MSA during most of February–March 2004 are now in better agreement with the measured (Fig. 8). As expected the calculated MSA in early March now overestimates the mea-sured MSA, in-line with the assumption that the DMS and MSA measurements are not directly related at this time and this period is influenced by fresh emissions. During January– February 2005 however, there is still some underestimation. This implies that the DMS mixing ratios measured at the site are not representative of the emissions at source or that the time allowed for the build-up of the DMSO on the aerosol is too short. The measured MSA mixing ratios are relatively high (∼40 pptV) however which is consistent with assump-tions that the DMS has had time to oxidise en route and it is clear from this analysis that the DMS+BrO reaction is im-portant in its oxidation.
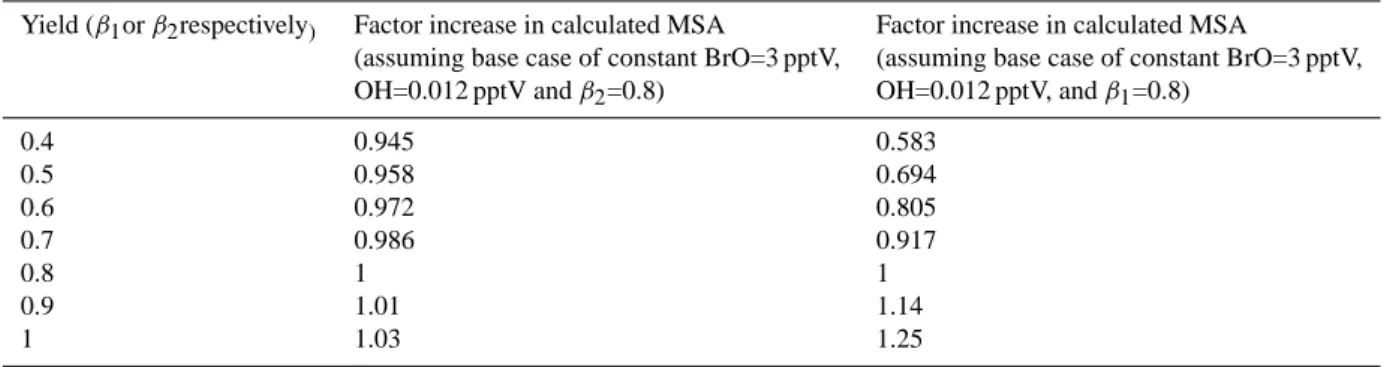
Table 4. Factor increase in calculated MSA whilst assuming a constant BrO and OH but changing yields.
Yield (β1or β2respectively) Factor increase in calculated MSA Factor increase in calculated MSA
(assuming base case of constant BrO=3 pptV, (assuming base case of constant BrO=3 pptV, OH=0.012 pptV and β2=0.8) OH=0.012 pptV, and β1=0.8)
0.4 0.945 0.583 0.5 0.958 0.694 0.6 0.972 0.805 0.7 0.986 0.917 0.8 1 1 0.9 1.01 1.14 1 1.03 1.25
Fig. 9. Rate of production of DMSO from the reaction of DMS with OH and BrO.
For the Summer 2005 period the relative rate of oxidation of DMS by OH and BrO is calculated using the measure-ments of DMS, BrO and OH when all three were measured simultaneously and this is shown in Fig. 9. The rate of oxi-dation of DMS by BrO dominates the DMS oxioxi-dation by on average a factor of 7 throughout the summer.
A change in the yield of either the DMS+BrO reaction or the DMS+OH reaction changes the factor increase in the DMSO and therefore in the MSA mixing ratios and so knowledge of the yields of these reactions is crucial to this analysis. Table 4 details the factor increase in MSA assum-ing BrO and OH at constant levels of 3 pptV and 0.012 pptV respectively with changing yields.
Assuming that the MSA from the abstraction route is neg-ligible then this analysis shows that the MSA concentration is far more sensitive to the yield of BrO+DMS rather than to the yield of OH+DMS.
6 Implications of these findings
Although low temperatures such as those experienced in the Antarctic can lead to a favoured addition route for the
oxida-tion of DMS, it is more likely that the increased MSA pro-duction observed at Halley is a result of the presence of BrO. BrO strongly increases the importance of the addition branch and indeed the oxidation rate even at low atmospheric mixing ratios. There is therefore a likely underestimation of the total oxidation rates of DMS in studies which do not incorporate halogen chemistry.
As highlighted in the work of Von Glasow et al. (2002), this finding also impacts on flux calculations as DMS from the ocean is often calculated based on atmospheric DMS mixing ratios and the assumption that reaction with OH is the only chemical loss. If BrO is a significant sink for DMS, the resulting DMS fluxes must be higher to yield the same atmospheric DMS mixing ratios.
6.1 Ice core implications
Both MSA and nss-SO42−, as well as their ratio, have been
used in ice core studies to try to diagnose environmental conditions in the past. In particular, MSA has been pro-posed as an indicator of sea ice extent (Curran et al., 2003; Abram et al., 2007), while there have been hopes that the ratio, if largely controlled by temperature, might yield in-formation about the latitude and temperature history of sul-phur emissions recorded in ice cores. If the presence of BrO can also play a substantial role in the relative and absolute production of MSA, then this raises a potential new compli-cation in interpreting the ice core records of these species. In particular, we know that BrO is strongly associated with the presence of sea ice, although possibly strongly concen-trated in the very lowest layers of the atmosphere (Simp-son et al., 2007). If DMS remained in the volume of atmo-sphere strongly influenced by BrO for a substantial fraction of its lifetime, then this could provide a further mechanism for an influence of sea ice on MSA mixing ratios recorded in ice cores. Modelling studies (Cosme et al., 2005) for S com-pounds have not yet included a realistic assessment of BrO, or its spatial and vertical distribution, which will be needed to determine whether BrO is really a major influence.
7 Conclusions
A year-long (February 2004–February 2005) time-series of DMS measurements in the Antarctic troposphere has been presented along with aerosol filter measurements of its oxi-dation product MSA and also with derived nss-SO42−. DMS
shows a strong seasonal variation with an austral winter min-imum and summer maxmin-imum which follows that of the sea-ice cover; but DMS was also observed to be present through-out the year due to its transport from biogenically active re-gions further north in association with an extended lifetime of 6 days under Antarctic conditions (assuming a 24 h av-erage OH winter concentration of 1×10⁵molecules cm−3).
The shorter-term variability in the DMS was found to be strongly due to air mass origin and trajectory pressure height. The biweekly SO2−4 , MSA and derived nss-SO42−filter data
appears to correlate with the DMS data in that they show maximum values in summer and minimum in winter but in reality the data show very low regression values with DMS due to the infrequency and differences in sampling rates of the filter data, in addition to the various complexities in the rate of oxidation of DMS to form these products.
Using the DMS mixing ratios measured at the site in conjunction with recent kinetic data MSA mixing ratios were calculated and found at times to differ from the fil-ter measurements. This was postulated to be due to a number of factors including the strong possibility of differ-ent DMS values at source (which may be 3.4 days away (OH=3.9×10⁵molecules cm−3), and the influence of locally produced DMS on the site measurements. Chemical influ-ences were also discussed including the additional effect of BrO on the production of DMSO and hence of MSA. Al-though the yield of the BrO+DMS reaction is still undeter-mined the impact of up to 7 pptV of BrO on the calculated MSA atmospheric concentration was found to be highly sig-nificant, and will have a significant impact on model calcula-tions for this region of the atmosphere.
Acknowledgements. The authors wish to thank NERC AFI for the
CHABLIS funding under grant number NER/G/S/2001/00558 and to S. Arnold for the calculation of the back trajectories.
Edited by: A. Jones
References
Abram, N. J., Mulvaney, R., Wolff, E. W., and Mudelsee, M.: Ice core records of sea ice variability in the Weddell Sea region of Antarctica, J. Geophys. Res., 112, D15101, doi:10.1029/2006JD008139, 2007.
Arsene, C., Barnes, I., and Becker, K. H.: FT-IR product study of the photo-oxidation of dimethyl sulfide: Temperature and O2
partial pressure dependence, Phys. Chem. Chem. Phys., 1, 5463– 5470, 1999.
Atkinson, R., Baulch, D. L., Cox, R. A., Crowley, J. N., Hampson, R. F., Hynes., R. G., Jenkin, M. E., Rossi, M. J., and Troe, J.:
Evaluated kinetic and photochemical data for atmospheric chem-istry: Volume 1 – gas phase reactions of Ox, HOx, NOx, and SOx species, Atmos. Chem. Phys., 4, 1461–1738, 2004,
http://www.atmos-chem-phys.net/4/1461/2004/.
Ayers, G. P., Bentley, J. P., Ivey, J. P., and Forgan, B. W.: Dimethyl-sulphide in marine air at Cape Grim, 41◦S, J. Geophys. Res., 102, 21 013–21 021, 1995a.
Ayers, G. P., Cainey, J. M., Gillett, R. W., and Ivey, J. P.: Atmo-spheric sulphur and cloud condensation nuclei in marine air in the Southern Hemisphere, Phil. Trans. R. Soc. Lond. B, 352, 203–211, 1997.
Ayers, G. P., Gillett, R. W., Ivey, J. P., Schafer, B., and Gabric, A.: Short-term variability in marine atmospheric dimethyl sulphide concentration, Geophys. Res. Lett., 22, 2513–2516, 1995b. Bardouki, H., Barcellos da Rosa, M., Mihalopoulous, N., Palm,
W.-U., and Zetzsch, C.: Kinetics and mechanism of the oxidation of dimethylsulfoxide (DMSO) and methanesulfinate (MSI-) by OH radicals in aqueous medium, Atmos. Environ., 36, 4627–4634, 2002.
Barnes, I., Bastian, V., Becker, K. H., and Overath, R. D.: Kinetic studies of the reactions of IO, BrO, and ClO with DMS, Int. J. Chem. Kinet., 23, 579–591, 1991.
Berresheim, H.: Biogenic sulfur emissions from the Subantarc-tic and AntarcSubantarc-tic Oceans, J. Geophys. Res., 92, 13 245–13 262, 1987.
Berresheim, H. and Eisele, F. L.: Sulfur Chemistry in the Antarc-tic Troposphere Experiment: An overview of project SCATE, J. Geophy. Res., 103, 1619–1627, 1998a.
Berresheim, H., Huey, J. W., Thorn, R. P., Eisele, F. L., Tan-ner, D. J., and Jefferson, A.: Measurements of dimethyl sulfide, dimethyl sulfoxide, dimethyl sulfone and aerosol ions at Palmer Station, Antarctica, J. Geophys. Res., 103, 1629–1637, 1998b. Bloss, W. J., Lee, J. D., Heard, D. E., Salmon, R. A., Bauguitte,
S. J.-B., Roscoe, H. K., and Jones, A. E.: Observations of OH and HO2 radicals in coastal Antarctica, Atmos. Chem. Phys. Dis-cuss., 7, 2893–2935, 2007,
http://www.atmos-chem-phys-discuss.net/7/2893/2007/. Charlson, R. J., Lovelock, J. E., Andreae, M. O., and Warren, S. G.:
Oceanic phytoplankton, atmospheric sulphur, cloud albedo and climate, Nature, 326, 655–661, 1987.
Comisco, J. C., McClain, R. C., Sullivan, C. W., Ryan, J. P., and Leonard, C. L.: Coastal Zone Color Scanner pigment concen-trations in the Southern Ocean and relationships to geophysical surface features, J. Geophys. Res., 98, 2419–2451, 1993. Cosme, E., Hourdin, F., Genthon, C., and Martinerie, P.:
Ori-gin of dimethyl sulfide, non-sea-salt sulfate, and methanesul-fonic acid in eastern Antarctica, J. Geophys. Res., 110, D03302, doi:10.1029/2004JD004881, 2005.
Curran, M. A. J., van Ommen, T. D., Morgan, V. I., Phillips, K. L., and Palmer, A. S.: Ice core evidence for Antarctic sea ice decline since the 1950s, Science, 302, 1203–1206, 2003.
Davis, D. D., Eisele, F., Chen, G., Crawford, J., Huey, G., Tanner, D., Slusher, D., Mauldin, D., Oncley, S., Lenschow, D., Semmer, S., Shetter, R., Lefer, B., Arimoto, R., Hogan, A., Grube, P., Laz-zara, M., Bandy, A., Thornton, D., Berresheim, H., Bingemer, H., Hutterli, M., McConnell, J., Bales, R., Dibb, J., Buhr, M., Park, J., McMurry, P., Swanson, A., Meinardi, S., and Blake, D.: An overview of ISCAT 2000, Atmos. Environ., 38, 5363–5373, 2004.
Davison, B., Hewitt, C. N., O’Dowd, C. D., Lowe, J. A., Smith, M. H., Schwikowski, M., Baltensperger, U., and Harrison, R. M.: Dimethyl sulfide, methane sulfonic acid and physiochemical aerosol properties in Atlantic air from the United Kingdom to Halley Bay, J. Geophys. Res., 101, 22 855–22 867, 1996. Davison, B., O’Dowd, C., Hewitt, C. N., Smith, M. H., Harrison, R.
M., Peel, D. A., Wolff, E., Mulvaney, R., Schwikowski, M., and Baltensperger U.: Dimethyl sulfide and its oxidation products in the atmosphere of the Atlantic and Southern Oceans, Atmos. Environ., 30, 1895–1906, 1995.
Falbe Hansen, H., Sørensen, S., Jensen, N. R., Pedersen, T., Hjorth, J.: Atmospheric gas-phase reactions of diemthyl sulphoxide and dimethylsulphone with OH and NO3radicals Cl atoms and
ozone, Atmos. Environ., 34, 1543–1551, 2000.
Frieß, U., Hollwedel, J., Konig-Langlo, G., Wagner, T., and Platt, U.: Dynamics and chemistry of troposphieric bromine explosion events in the Antarctic coastal region, J. Geophys. Res., 109, D06305, doi:10.1029/2003JD004133, 2004.
Frieß, U., Kreher, K., Johston, P. V., and Platt, U.: Ground-based DOAS measurements of stratospheric trace gases at two Antarc-tic stations during the 2002 ozone hole period, J. Atmos. Sci., 63(3), 765–777, 2005.
Gondwe, M., Krol, M., Gieskes, W., Klaasen, W., and De Baar, H.: The contribution of ocean-leaving DMS to the global atmo-spheric burdens of DMS, MSA, SO2, and NSS SO=4, Global
Bio-geochem. Cy., 17, 2, 1056, doi:10.1029/2002GB001937, 2003. Gondwe, M., Krol, M., Klassen, W., Gieskes, W., and De Baar,
H.: Comparison of modeled versus measured MSA:nss SO42-ratios: A global analysis, Global Biogeochem. Cy., 18, GB2006, doi:10.1029/2003GB002144, 2004.
Hegels, E., Crutzen, P. J., Klupfel, T., Perner, D., and Burrows, J. P.: Global distribution of atmospheric bromine-monoxide from GOME on earth observing satellite ERS-2, Geophys. Res. Lett., 25, 3127–3130, 1998.
Hynes, A. J., Wine, P. J., and Semmes, D. H.: Kinetics and mecha-nism of OH reactions with organic sulfides, J. Phys. Chem., 90, 4148–4156, 1986.
Hynes, A. J. and Wine, P. J.: The atmospheric chemistry of dimethyl sulfoxide (DMSO) kinetics and mechanism of the OH + DMSO reaction, J. Atmos. Chem., 24, 23–27, 1996.
Ingham, T., Bauer, D., Sander, R., Crutzen, P. J., and Crowley, J. N.: Kinetics and products of the reactions BrO + DMS and Br + DMS at 298K, J. Phys. Chem., 103, 7199–7209, 1999.
Jee J. and Tao, F. M.: Reaction mechanism and kinetics for the oxidation of dimethyl sufide by nitrate radical, Chem. Phys. Lett., 420, 336–339, 2006.
Jefferson, A., Tanner, D. J., Eisele, F. L., Davis, D. D., Chen, G., Crawford, J., Huey, J. W., Torres, A. L., and Berresheim, H.: OH photochemistry and methane sulfonic acid formation in the coastal Antarctic boundary layer, J. Geophys. Res., 103, 1647– 1656, 1998.
Jones, A. E., Wolff, E. W., Salmon, R. A., Bauguitte, S. J.-B., Roscoe, H. K., Anderson, P. S., Ames, D., Clemitshaw, K. C., Fleming, Z. L., Bloss, W. J., Heard, D. E., Lee, J. D., Read, K. A., Hamer, P., Shallcross, D. E., Jackson, A., Walker, S., Lewis, A. C., Mills, G. P., Plane, J. M. C., Saiz-Lopez, A., Sturges, W. T., and Worton, D. R.: Chemistry of the antarctic boundary layer and the interface with snow: an overview of the CHABLIS cam-paign, Atmos. Chem. Phys. Discuss., 8, 5137–5181, 2008,
http://www.atmos-chem-phys-discuss.net/8/5137/2008/. Jourdain, B. and Legrand, M.: Seasonal variations of atmospheric
dimethylsulfide, dimethylsulfoxide, sulfur dioxide, methanesul-fonate, and non-sea-salt sulfate aerosols at Dumont d’Urville (coastal Antarctica) (December 1998 to July 1999), J. Geophys. Res., 106, 14 391–14 408, 2001.
Jourdain, B. and Legrand, M.: Year-round records of bulk and size-segregated aerosol composition and HCl and HNO3levels in the
Dumont d’Urville (coastal Antarctica) atmosphere: Implications for sea-salt aerosol fractionation in the winter and summer, J. Geophys. Res., 107, 4645, 2002.
Kreher, K., Johnston, P. V., and Wood, S. W.: Ground-based measurements of tropospheric and stratospheric BrO at Arrival Heights, Antarctica, Geophys. Res. Lett., 24, 23, 3021–3024, 1997.
Legrand, M. and Pasteur, E. C.: Methane sulfonic acid to non sea-salt sulfate ratio in coastal Antarctic aerosol and surface snow, J. Geophys. Res., 103(D9), 10 991–11 006, 1998.
Legrand, M., Sciare, J., Jourdain, B., and Genthon, C.: Subdaily variations of atmospheric dimethylsulfide, dimethylsulfoxide, methanesulfonate, and non-sea-salt sulfate aerosols in the atmo-spheric boundary layer at Dumont d’Urville (coastal Antarctica) during summer, J. Geophys. Res., 106, 14 409–14 422, 2001. Liss, P. S., Hatton, A. D., Malin, G., Nightingale, P. D., and Turner,
S. M.: Marine sulphur emissions, Philos. T. Roy. Soc. B, 352, 159–168, 1997.
Mauldin-III, R. L., Eisele, F. L., Tanner, D. J., Kosciuch, E., Shet-ter, R., Lefer, B., Hall, S. R., Nowak, J. B., Buhr, M., Chen, G., Wang, P., and Davis, D.: Measurements of OH, H2SO4, and
MSA at the South Pole during ISCAT, Geophys. Res. Lett., 28, 3629–3632, 2001.
Minikin,A., Legrand, M., Hall, J., Wagenbach, D., Kleefeld, C., Wolff, E., Pasteur, E. C., and Ducroz, F.: Sulfur contain-ing species (sulfate and methanesulfonate) in coastal Antarctic aerosol and precipitation, J. Geophys. Res., 103, 10 975–10 990, 1998.
Plane, J. M. C. and Saiz-Lopez, A.: UV-Visible differential optical absorption spectroscopy (DOAS), in: Analytical techniques for atmospheric measurement, edited by: Heard, D. E., Blackwell Publishing, Oxford, 2006.
Preunkert, S., Legrand, M., Jourdain, B., Moulin, C., Belviso, S., Kasamatsu, N., Fukuchi, M., and Hirawake, T.: Interannual variability of dimethylsulfide in air and seawater and its atmo-spheric oxidation by-products (methanesulfonate and sulfate) at Dumont d’Urville, coastal Antarctica (1999–2003), J. Geophys. Res., 112, D06306, doi:10.1029/2006JD007585, 2007.
Prospero, J. M., Savoie, D. L., Saltzman, E. S., and Larsen, R.: Im-pact of oceanic sources of biogenic sulphur on sulphate aerosol concentrations at Mawson, Antarctica, Nature, 350, 221–223, 1991.
Rankin, A. M. and Wolff, E. W.: A year-long record of size-segregated aerosol composition at Halley, Antarctica, J. Geo-phys. Res., 108(D24), 4775, doi:10.1029/2003JD003993, 2003. Read, K. A., Lewis, A. C., Salmon, R. A., Jones, A. E., and
Bau-guitte, S.: OH and halogen influence on the variability of non-methane hydrocarbons in the Antarctic Boundary Layer, Tellus B., 59, 22–38, 2007.
Saiz-Lopez, A., Plane, J. M. C., and Shillito, J. A., Bromine oxide in the mid-latitude marine boundary layer, Geophys. Res. Lett.,
31, L03111, doi:10.1029/2003GL018956, 2004.
Saiz-Lopez, A, Mahajan, A. S., Salmon, R. A., Bauguitte, S. J.-B., Jones, A. E., Roscoe, H. K., and Plane, J. M. C.: Boundary Layer Halogens in Coastal Antarctica, Science, 317. 5836, 348–351, doi:10.1126/science.1141408, 2007.
Savoie, D. L., Prospero, J. M., Larsen, R. J., Huang, F., Izaguirre, M. A., Huang, T., Snowdon, T.H., Custals, L., and Sanderson, C. G.: Nitrogen and sulfur species in Antarctic aerosols at Maw-son, Palmer Station and Marsh (King George Island), J. Atmos. Chem., 95–122, 1993.
Simpson, W. R., von Glasow, R., Riedel, K., Anderson, P., Ariya, P., Bottenheim, J., Burrows, J., Carpenter, L. J., Frieß, U., Goodsite, M. E., Heard, D. E., Hutterli, M., Jacobi, H.-W., Kaleschke, L., Neff, B., Plane, J., Platt, U., Richter, A., Roscoe, H., Sander, R., Shepson, P., Sodeau, J., Steffen, A., Wagner, T., and Wolff, E.: Halogens and their role in polar boundary-layer ozone depletion, Atmos. Chem. Phys., 7, 4375–4418, 2007,
http://www.atmos-chem-phys.net/7/4375/2007/.
Staubes, R. and Georgii H. W.: Biogenic sulfur compunds in sea-water and the atmosphere of the Antarctic region, Tellus, 45B, 127–137, 1993.
Toumi, R.: BrO as a sink for dimethylsulphide in the marine atmo-sphere, Geophys. Res. Lett., 21, 117–120, 1994.
Von Glasow, R., Sander, R., Bott, A., and Crutzen, P. J.: Mod-elling halogen chemistry in the marine boundary layer, 2, Inter-actions with sulfur and cloud-covered MBL, J. Geophys. Res., 107(D17), 4323, doi:10.1029/2001JD000943, 2002.
Von Glasow, R. and Crutzen, P. J.: Model study of multiphase DMS oxidation with a focus on halogens, Atmos. Chem. Phys., 4, 589– 608, 2004,
http://www.atmos-chem-phys.net/4/589/2004/.
Wagenbach, D., Ducroz, F., Mulvaney, R., Keck, L., Minikin, A., Legrand, M., Hall, J. S., and Wolff, E. W.: Sea-salt aerosol in coastal Antarctic regions, J. Geophys. Res., 103, 10 961–10 974, 1998.
Wolff, E. W., Legrand, M. R., and Wagenbach, D.: Coastal Antarctic aerosol and snowfall chemistry, J. Geophys. Res., 103, 10 927–10 934, 1998.