HAL Id: hal-03049295
https://hal.archives-ouvertes.fr/hal-03049295
Submitted on 9 Dec 2020HAL is a multi-disciplinary open access
archive for the deposit and dissemination of sci-entific research documents, whether they are pub-lished or not. The documents may come from teaching and research institutions in France or abroad, or from public or private research centers.
L’archive ouverte pluridisciplinaire HAL, est destinée au dépôt et à la diffusion de documents scientifiques de niveau recherche, publiés ou non, émanant des établissements d’enseignement et de recherche français ou étrangers, des laboratoires publics ou privés.
CO 2 electroreduction to fuels on mesoporous
carbon-embedded copper nanoparticles
Nihat Sahin, Wanderson Silva, Mariana Camilo, Edson Ticianelli, Fabio Lima,
Julien Parmentier, Clément Comminges, Teko Napporn, K. Boniface Kokoh
To cite this version:
Nihat Sahin, Wanderson Silva, Mariana Camilo, Edson Ticianelli, Fabio Lima, et al.. CO 2 electrore-duction to fuels on mesoporous carbon-embedded copper nanoparticles. Sustainable Energy & Fuels, Royal Society of Chemistry, 2020, 4 (12), pp.6045-6053. �10.1039/d0se01025a�. �hal-03049295�
CO
2electroreduction to fuels on mesoporous
carbon-embedded copper nanoparticles
Nihat Sahin,a,b Wanderson O. Silva,b Mariana R. Camilo,b Edson A. Ticianelli,b Fabio H. B.
Lima,b Julien Parmentier,c Clément Comminges,a Teko W. Napporn,a and Kouakou B. Kokoha,*
Abstract: Electrochemical carbon dioxide reduction reaction (CO
2RR) process can
allow the production of chemicals under ambient conditions on nanostructured copper
materials. However, reaction selectivity is still main drawback due to the strong
competition reactions at close electrode potentials. Herein, we introduced a novel
three-dimensional electrode composed of mesoporous carbon-embedded copper
nanoparticles that are capable of selectively producing formic acid and short-chain
hydrocarbons at low overpotentials. The mesoporous electrocatalyst was synthesized
from a facile and one-pot green chemistry process using bio-sourced Tannin mimosa
(polymeric flavonoids) acting as both reducing agent and carbon precursor. The role
of the different electrode potentials on the product selectivity (methane and ethylene)
was probed by on-line differential electrochemical mass spectrometry (DEMS). During
the CO
2electrolysis, chronoamperometry experiments allowed the evaluation of the
electrocatalytic performance towards CO2RR with a distinguishable production of
formic acid and hydrocarbons. It should be noted that methane was firstly detected at
the potential of -0.52 V, while ethylene was shown up at -0.72 V vs. RHE. Moreover,
the thin-layer Cu/C ex-Tannin porous electrode surface exhibited current densities
ranging from 5.9 to 42.1 mA cm
-2, which are higher than those previously reported on
copper-based electrodes. This suggests that the Cu/C ex-Tannin electrocatalyst
surface facilitates the charge and mass transfers towards accessible active sites
through the mesostructured carbon paths, boosting the performace for CO
2RR. The
Cu/C ex-Tannin electrode described here may provide a promising lead for the
development of effective electrocatalyst structures for scalable electrochemical CO
2reduction electrolyzers
a. Universite de Poitiers, Institut de Chimie des Milieux et Materiaux de Poitiers 4 rue Michel Brunet, B27, TSA 51106, 86073 Poitiers cedex 09, France.
b. Institute of Chemistry of Sao Carlos, University of de Sao Paulo, Av. Trab. Sao-carlense 400, CP 780, CEP 13560-970, Sao Carlos, SP, Brazil.
c.Universite de Haute-Alsace, Institut de Science des Materiaux de Mulhouse, CNRS UMR 7361 15 rue Jean Starcky – BP 2488-68057 cedex, Mulhouse, France.
Introduction
The current global emission rate of carbon dioxide (CO2) is getting up to metric
giga-tonnes that brings along adversely environmental consequences causing climate changes. It is admitted that using CO2 as a sustainable carbon source in energy
conversion systems has been received much attention, as it would mitigate a large amount of CO2 emission per year 1, 2. There are variety processes in which CO2 can be
converted into value-added chemicals and fuels such as syngas 3, methanol 4, methane 5, ethanol 6, formic acid/formate 7, ethylene 8, and oxalic acid/oxalate 9. Of the various
CO2 valorisation approaches, electrochemical devices are the most promising and
compatible devices due to their ability of adapting to renewable energy sources, and possible higher conversion efficiency. In past two decades, various electrode materials were prepared and studied to assess the poor selectivity, this being the major limitation to the development of industrial CO2 reduction 10-12. However, the electrochemical
processes have been hampered by the poor selectivity and the large overpotential in CO2 electrocatalysis, causing the decreasing energy efficiency. In addition,
development of effective nanostructured copper materials for especially tuning the structure and composition is still the main drawback. Considerable efforts have therefore devoted to developing effective Cu-based catalysts with the goal of controlling structure and composition for improving reaction selectivity 13-16. The product selectivity
of CO2 reduction strongly depends on nature of the electrode 17, 18 and composition of
the electrolyte 19. In particular, metal-based electrodes such as lead, mercury, bismuth,
zinc, cadmium, and iridium that possess electron rich orbitals are capable of reducing the molecular CO2 at high overpotential (> 0.80 V). A variety of valuable chemicals (C1
-C3) were reported from CO2RR on copper based-metal nanoparticles 14, 20-22 and on
copper particles derived from different Cu2O morphologies 23 at -1.10 V vs. RHE in 0.1
mol L-1 KHCO
3 and/or CsHCO3 20, 22, and 0.3 mol L-1 KHCO3 23 solutions. The binding
energy features of copper for CO2 and reaction intermediates make it a unique electrode
material for the production of hydrocarbons. The mechanism may also include steps of readsorption of reaction intermediates (such as formic acid and CO) for hydrocarbon generation 24. Among the wide variety of CO
2 electroreduction products, short-chain
hydrocarbons (methane and ethylene) are more desirable for chemical industries, mainly for using as feedstocks or for producing synthetic fuels 25. So, this has leading
studies on electrochemical production of methane and ethylene on copper -based electrodes. Recently reported studies have also been demonstrated that three -dimensional porous electrode materials 18, 26 that favour easy diffusion of electrolyte,
fast kinetics of electrochemical reactions, and steps of readsorption of reaction intermediates are highly desirable for constructing high performance electrode materials in electrocatalysis. In particular, the influence of the interconnected porous channels as transport paths on electrolyte transportation and ion diffusion have been demonstrated 27-29. In addition to catalyst morphology, the presence of cation species
in the electrolyte is another crucial key factor in achieving desired selectivity and catalytic performance on metallic catalyst 30, 31. Similarly, the influence of the alkali
cation nature on activity of an electrocatalyst has been reported 32. It was argued in the
literature that the presence of a larger cation such as K+ instead of Na+ promotes an
increase in the local concentration of dissolved CO2, which results in improving the
electrode performance 33. Moreover, significant improvements towards the CO 2RR
have been achieved in the electrode performance and reaction selectivity, as investigated by on-line mass spectroscopy on CO2 electroreduction 34. In addition to
electrolyte nature, the correlation of the electrocatalyst composition and reaction product distribution using on-line differential electrochemical mass spectrometry (DEMS) were extensively investigated 35, 36.
Inspired by these studies, we present a novel copper-based electrocatalyst with a mesoporous carbon network, carving the path for efficient CO2 electrocatalysis. The
synthesis was based on the one pot soft-template process which has shown the lead easily to accessible nanostructured metal-based phase well dispersed in a mesoporous carbon structure.26 We further discuss the role of the electrode potential on product
selectivity of short-chain hydrocarbons determined by on-line differential electrochemical mass spectroscopy and chromatographic analysis.
Results and discussion Physicochemical Characterization
The N2 adsorption/desorption isotherm at 77 K (Fig. 1a) and the corresponding pore
size distribution calculated by the BJH method (Fig. 1b) were determined from the adsorption branches of the isotherms. According to IUPAC classifications, the Cu/C ex-Tannin material isotherm represents type IV isotherm with a capillary condensation step and a hysteresis, which is indicative of the presence of broadly distributed mesopore size. The capillary condensation step occurs at a relative pressure of about 0.6, in agreement with previously reported results 37. In terms of textural properties, Cu/C
ex-Tannin shows a BET surface area of 417 m2 g-1 and a pore volume of 0.41 cm3 g-1 (at
P/P°=0.98) with a maximum pore diameter distribution around of 7 nm.
In order to confirm the presence of copper nanoparticles, thermal gravimetric analysis was conducted. Fig. 2 displays differential thermal and thermo-gravimetric (DT/TG) analysis curves for Cu/C ex-Tannin material heat-treated in air. This Cu/C ex-Tannin shows a total weight loss (87.8 wt.%) in two distinct temperature regions. The first region from 25 to 220 °C with a low weight loss (3.52 wt.%), which may be attributed to desorption of physically adsorbed impurities and water molecules at the surface of the substrate material. Then, the second region from 220 to 450 °C shows a conspicuous weight loss of 78.9 wt.%, accompanied by an exothermic peak at about 335 °C on the DT pattern, which corresponds to the concomitant oxidation of the carbon substrate and the copper phase. The accurate metal loading for the Cu/C ex-Tannin material is found to be 12.2 wt.% after subtracting of adsorbed water content and considering CuO formation 38 during DT/TG analysis in air as confirmed by XRD (Figure S1).
Fig. 1 a) N2 physisorption isotherms and b) corresponding pore size distributions from the BJH
analysis of adsorption branches of the prepared copper-free mesoporous carbon (■) and Cu/C ex-Tannin (▼) materials.
Fig. 2 Differential thermal and thermogravimetric analysis (DTA/TGA) of the prepared Cu/C ex-Tannin material, recorded at the temperature rate of 5 °C min-1 under air (flow rate of 100 mL min-1).
X-ray diffraction analysis was used to examine the structure of the Cu/C ex-Tannin material and this result is shown in Fig. 3a. All the diffraction phases were identified by referring to the Joint Committee on Powder Diffraction Data (JCPDS-ICDD) database. The diffraction lines at 43.25°, 50.44°, 74.10°, 89.91° and 95.13° correspond, respectively to the (111), (200), (220), and (222) planes of face-centered cubic (fcc) copper with a lattice constant of a=b=c=3.6150 Å. Diffraction patterns display sharp and narrow peaks, suggesting the high degree of crystallinity. Moreover, the additional peaks observed at around 28.40° and 36.32° correspond, respectively to the reflection planes of (110) and (111) of the cubic Cu2O phases with a lattice constant of
a=b=c=4.2670 Å. The Debye-Scherrer`s relation was used to determine the average crystallite size measured in a direction perpendicular to the diffracting planes (hkl) of the material according to Eq. (1).
𝐿𝑣 = 𝑘𝜆 𝛽⁄ ℎ𝑘𝑙𝑐𝑜𝑠𝜃 Eq. 1
where Lv is the average crystallite size, β is the full width at half maximum (FWHM) of
the peak corresponding to plane (hkl; in radian), and k is a shape factor. Based on the assumption of Gaussian line profiles and small cubic crystals of uniform size, k is 0.94. The calculated average crystallite size of the Cu (111) diffraction plane is determined as 190 nm in the [111] direction. In addition, the Williamson-Hall (W-H) procedure allows to explore the lattice micro-strain (db) influence lied behind the lattice mismatch in the presence of nanoparticles 39. Fig. 3b shows the lattice micro-strain effect (db) in the
copper particles for Cu (111) plane in the light of the W-H plot. This indicates the growth of the Cu nanoparticles in the porous network occurred without deformation in agreement with the formation of a perfect truncated octahedron copper crystallite, as evidenced by our previously reported study 26.
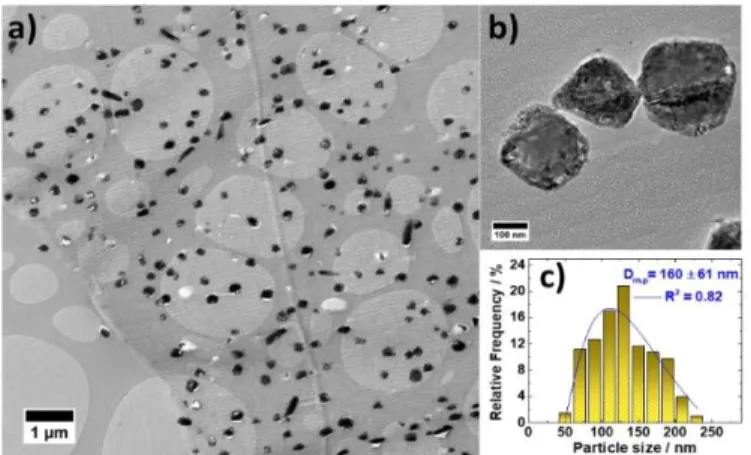
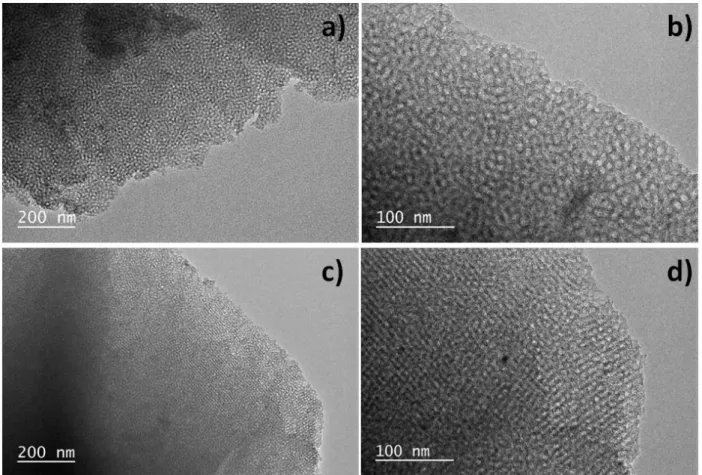
To acquire further insights into nanoparticle distribution, cross-sectional TEM analysis was conducted, as presented in Fig. 4a. The CS-TEM image evidently displays that the C ex-Tannin support material presents mesoporous structure (Fig. S2) with highly dispersed copper nanoparticles as seen as black spots. The mean particle size of 160 nm is estimated from the histogram illustrated in Fig. 4c. XRD and TEM analyses provide characteristic information on the size of the prepared material. Basically, calculation from XRD diffraction patterns, based on the Scherrer’s formula (see in Eq.1), gives an average size of the crystallite in the direction perpendicular to the considered (hkl) plane (herein, (111)). The similarity of the two values (in the ±60 uncertaint y range) suggests a monocrystalline nature of the Cu nanoparticles. Further, the white spots on the CS-TEM image correspond to the holes of the copper nanoparticles which were removed from the surface of the support during the CS-TEM sample preparation. The high magnification image shown in Fig. 4b evidences the growth of copper nanoparticles and the presence of mesoporosity throughout the copper particles.
Therefore, the material can be described as a mesoporous carbon matrix embedding well dispersed mesostructured copper nanoparticles (12.2 wt.%). As shown in the electrochemical part, these particles behave as electrocatalyst and are greatly accessible to CO2 through the diffusion path of the mesoporous network. Moreover,
high resolution TEM analysis shows that synthesized copper nanoparticles exhibit oxide structure using bright field (Fig. S3a) and dark field (Fig. S3b) measurements with the selected area electron diffraction (SAED) patterns at zone axis [011] (Fig. S2c). In the bright field TEM micrograph (Fig. S3a), copper nanoparticles obviously appear, while in dark one (Fig. S3b) Cu2O (111) structure appear as white patterns around the copper
surface confirming by the SAED pattern. The SAED pattern in Fig. S3c corresponds to the [011] zone axis of a face centered cubic unit cell, corresponding to (111) crystal planes of Cu2O phase, which could be ascribed to a lattice spacing of 0.221, 0.254,
0.256 nm for the indexed spots. The presence of copper oxide, which has electron -donor property, tends to increase the carbon dioxide adsorption capacity due to its electron-acceptor features 40.
Fig. 4 a) Cross-section transmission electron microscopy (CS-TEM) micrograph of Cu/C ex-Tannin synthesized from evaporation-induced self-assembly (EISA) method, b) extended CS-TEM micrograph and c) corresponding mean particle size (Dm.p) distribution histogram being
fitted by using the log-normal function.
Electrochemical characterization of the mesoporous carbon supported copper electrode
The voltammetric behaviour of carbon dioxide is studied on the mesoporous carbon -embedded copper electrode in N2-deareated and CO2-saturated 0.4 mol L-1 KHCO3
containing 4.0 mM KCl aqueous electrolyte. The cyclic voltammograms (Fig. 5) display two distinct regions: (i) metallic copper behaviour between about -0.10 and +1.40 V, (ii) CO2 electroreduction (CO2RR) and hydrogen evolution reaction (HER) region between
-0.10 and -1.0 V. As can be seen in Fig. 5, two oxidation peaks located at 0.62 V (jOx1)
and at 0.76 V (jOx2), represent the transformation of metallic copper into copper(I) oxide
(Cu→Cu2O) and then copper(I) oxide into copper(II) oxide (Cu2O→CuO), respectively.
Furthermore, the corresponding copper redox couples were observed at the potentials of 0.42 V (jRed1) and 0.21 V (jRed2) during the cathodic scan direction, which are
respectively attributed to the formation of copper(I) oxide (CuO→Cu2O) and metallic
copper (Cu2O→Cu). In addition to copper oxide species on the anodic scan direction,
another characteristic anodic peak assigned to Cu2O3 (jOx3) appears in the course of
oxidation of copper originating from hydrated CuO. Only a few papers have reported the investigations of the copper electrode behaviour in aqueous 41-43 and non-aqueous 44 electrolytes. It should be highlighted that comparing the cyclic voltammogram profiles
on the cathodic scan direction, it is remarkable that the reduction of CuO (jRed1) and
Cu2O (jRed2) species are recorded in the presence of N2, whereas only reduction to
copper(I) oxide is solely recorded in the presence of CO2. In this way, hypothesis can
be made that there is a strong interaction between Cu/Cu2O and dissolved CO2 at the
electrode surface just before the CO2 electrolysis. It is worth noting that the onset
potential of CO2RR is observed at more positive potential (about 0.30 V) than hydrogen
evolution reaction (see CV in Fig. 5). The broad reduction peak in the polarization curve as to CO2-catalysis located at about –0.50 V with a reasonable current density (jCO2RR
=-18.5 mA cm-2), is assigned to the CO
2RR, as endorsed by its 5.8-fold enhanced current
density in the presence of CO2. This sharp rise in current density indicates the
catalysing ability of Cu/C ex-Tannin under defined electrolysis conditions. In addition to CV test for Cu/C ex-Tannin, the mesoporous carbon material synthesized without copper precursor is examined. The CV measurements (shown in Fig. S4) show that mesoporous carbon material is not active towards CO2RR.
Fig. 5 Cyclic voltammograms of the Cu/C ex-Tannin electrode recorded at 50 mV s-1 scan rate in N 2
-deareated (pH 8.3) and CO2-saturated (pH 7.2) 0.4 mol L-1 KHCO3 containing 4.0 mM KCl aqueous
electrolyte.
Electroreduction of CO2 on mesoporous carbon supported copper electrode as
probed by chromatography analysis
Faradaic efficiency, abbreviated to F.E, is the fraction of electrons passed through the electric circuit to obtain a desired product, which is a key factor in determinin g the feasibility of converting CO2 to fuels. For evaluating the Faradaic efficiency, electrolysis
experiments were carried out at various cathodic potentials ranging from 0.32 V to -1.12 V vs. RHE with a constant metal loading of 0.15 mgCu cm-2. The comparison of the
CO2 reduction activity and the current densities of the material electrode are presented
in Fig S5. A high initial current density is explicit in the first 200 s of electrolysis, which thereafter declines, reaching a stable profile. As can be seen in Fig. S5, the potentiostatic currents remain stable during electrolysis period, suggesting that the diffusion limited current density was estimated by using the simplified steady-state Nernst diffusion model 45 for the case of flat electrode inserted into laminar flow,
promoting the diffusion limited current density. The details of the electrolysis results including the amount of charge passed per electrode area and the F.E values of HCOOH, CO, and H2 for each applied potential were listed in Table S1. As presented
in Fig. 6, F.E of HCOOH typically increases with the applied potential from -0.32 V and reaches a 31.2% optimum value at -0.62 V/RHE, above which only H2 concentration
continues increasing.
Fig. 6 Faradaic efficiency of Cu/C ex-Tannin material at various electrode potentials in CO2-saturated
0.4 mol L-1 KHCO
These results expose that the Cu/C ex-Tannin electrocatalyst is capable of producing HCOOH at moderate overpotentials. We could hypothesize an interaction between electroactive catalytic sites on the Cu particles facilitated by the porosities of the electrocatalyst that intends to produce a weakly stabilized CO2 intermediate species 22,
resulting in a high yield of formic acid production than that of hydrocarbons. CO is also one of the gaseous products but less than 9.6% of F.E (at the potential of -0.52 V) was detected at all applied potentials, suggesting a stable adsorption of radical anion CO2•─
on the electrode surface at more cathodic potentials. With increasing the electrode potential towards cathodic window from -0.32 to -1.12 V/RHE, the F.E related to H2
formation being dominantly favoured from 45% (at -0.32 V/RHE) up to 77 % (at -1.12 V/RHE) listed in Table S1.
CO2RR electrochemical experiments coupled to on-line DEMS
As noticed in Fig. 6, the total balance of production formation is not achieved. This is due to the detection limit chromatographic analysis. Considering copper is capable of catalysing production of hydrocarbons, the eventual formation of CH4 and C2H4 in the
CO2RR was monitored by on-line DEMS, more sensitive but not quantitative, under
galvanostatic conditions on Cu/C ex-Tannin. Fig. 7 displays the constant electrochemical potentials (Fig. 7a), and ionic currents for hydrogen (H2, m/z = 2, Fig.
7b), methane (CH4, m/z = 15, Fig. 7c), and ethylene (C2H4, m/z = 26, Fig. 7d) acquired
during DEMS measurements in CO2-saturated 0.4 mol L-1 KHCO3 containing 4.0 mM
KCl aqueous electrolyte. Indeed, it was observed during these investigations that the presence of potassium chloride in the electrolyte also promotes the CO2RR efficiency
as well as suppresses or slows down the HER may be due to the K+ radius role on the
H2O molecules. Chronoamperometry results presented in Fig. S6 show that the Cu/C
ex-Tannin electrode (0.36 mgCu cm-2) does not lose its activity during the electrolysis.
Fig. 7 a) The electrochemical potentials at -0.52 V (green), -0.72V (blue), -0.92 V (red), and -1.12 V (black) versus RHE, and corresponding ionic currents for b) hydrogen (H2, m/z=2), c) methane (CH4,
m/z=15) d) ethylene (C2H4, m/z=26) obtained during on-line DEMS measurements of
chronoamperometry for the Cu/C ex-Tannin electrode with a constant metal loading of 0.36 mg of Cu per cm2 in CO
2-saturated 0.4 mol L-1 KHCO3 electrolyte.
As under constant potential electrocatalysis the reaction activity reaches a steady state value (Fig. S6), it may be concluded that the accumulated intermediates are non -poisoning compounds. When the electrode was polarized from -0.52 to -1.12V vs. RHE, an increase in the ionic currents for m/z=2, m/z=15, m/z=26 was observed, evi dencing the formation of hydrogen, methane and ethylene, as shown in Figs. 7b-d. From the DEMS measurements, it can be seen that, while the production of methane appears at the potential of -0.52 V (Fig. 7c), ethylene detection shows up at -0.72 V/RHE (Fig. 7d), suggesting that formation of these products is extremely sensitive to the value of the electrode potential. Although not quantitative, it is noted that the ionic mass signal of
CH4 (m/z=15, Fig. 7c) is three-fold higher than that of C2H4 (m/z=26, Fig. 7d). This
suggests fast kinetics of methane production if one assumes that the formation of these two molecules requires different protonating steps that affect the reaction sites, and, therefore reaction intermediates proportionally to ionic currents i n mass spectrometer measurements.
On smooth polycrystalline metallic copper (electropolished or H2 treated Cu, for
example), the dissociative adsorption (or activation) of CO2 is thermodynamically
unfavourable 46. However, at high overpotentials, the only hydrocarbon evolved is CH 4 47, indicating that this species is formed on high hydrogenated surface. Interestingly, on
oxide-derived Cu surface or on electrodeposited Cu, C2H4 is also produced, but at lower
overpotentials. This seems to be due to the formation of a surface with high number of grain boundaries and of low-coordinated Cu atoms, which are formed during the electroreduction of Cu-oxide (surface roughening) 48-50. These undercoordinated copper
atoms and those located at the grain boundaries, more reactive than the bulk ones, do promote the dissociative adsorption of CO2 46. Additionally, active sites of these resulting
structures may possess interatomic distances that favour the CO-CO coupling, which might explain the ethylene formation, as discussed before 50. Regarding Cu/C
ex-Tannin investigated in present study, one can observe that methane is produced at lower overpotential and at a much higher extent in relation to ethylene. This indirectly shows that the surface of this electrocatalyst is smooth, with low amount of undercoordinated Cu atoms (also explaining its relatively low F.E. for formate production). One can also argue that the electrochemical potential excursion to higher values followed by another one to lower values (see CV in Fig. 5) may induce undercoordinated Cu atoms (by Cu dissolution and redeposition in the mesoporous material), which are active for C2-product formation. So, in a future study, considering
that this mesoporous material has a high-surface area of metallic copper for hydrogenation, we will explore the effect of potential and of thermal treatment on CH4
and C2H4 selectivities.
Experimental
Chemicals
Copper(II)acetylacetonate (Cu(C5H7O2)2, Sigma-Aldrich >99.9% trace metal basis),
tri-block copolymer pluronic® F127 as the structure directing agent (Sigma-Aldrich, with the formula of (PEO)106(PPO)70(PEO)106),absolute ethanol (AnalaR NORMAPUR
reagent, 37 wt.%), potassium bicarbonate (Sigma-Aldrich, ACS reagent, 99.7% powder), potassium chloride (Sigma-Aldrich, ACS reagent, 99.0%, powder). Tannin mimosa was supplied by the company Silvachimica (Italy) in the form of a fine, light brown, powder, obtained by spray drying of aqueous wattle (Acacia mearnsii formerly mollissima, DeWild) bark extracts. All used ultrapure water is provided by Milli -Q Millipore source (18.2 MΩ cm, 20 °C).
Synthesis of the mesoporous carbon embedded copper nanoparticles.
Bio-sourced mesoporous carbon material containing copper nanoparticles was synthesized by an endo-templating route using evaporation-induced self-assembly process (EISA) 37 as schematized in Fig. S7. The process is based on the use of i) an
amphilic surfactant triblock polymer Pluronic® F127 as a pore structuring agent and ii) Tannin mimosa (polyphenolic compounds) acting as both carbon source and reducing agent during the heat-treatment step. This process allows for preparation of highly uniform mesostructured carbon materials (Fig. S7d) with tubular p ores locally organized in a honey-comb structure. Fig. S7 illustrates the stages of the self-assembly formation of mesoporous carbon (Fig. S7a-d) and nucleation and growth of copper nanoparticles
by means of highly uniform thin films (Fig. 7a-i). For preparation of pure mesoporous carbon, firstly, non-ionic surfactant (Pluronic® F127) and carbon precursor (Tannin mimosa) are dissolved in the mixture of absolute ethanol, water and HCl, giving a weight composition of 1.10 g Pluronic® F127; 1.10 g Tannin mimosa; 5.7 g CH3OH; 3.0 g H2O;
1.10 g HCl (solution A). After continuous stirring at 500 rpm for 15 min, the mixture is poured into Petri dishes of 9.5 cm diameter, to evaporate the solvent at room temperature overnight. In this dry state, the mesophase obtain ed is composed of composite micelles with presumably tannin being located preferentially in the hydrophilic shell of the micelles 51 (Fig. S7a). It is proposed, as shown with phenolic
resins, that the hydroxyl groups in the Tannin structure selectively int eract with the polyethylene oxide (PEO) chains of the triblock copolymer via hydrogen bonds which intend to be the driving force of the organic-organic self-assembly 52 (Fig. S7b).
Thereafter, the so-called mesophase undergoes condensation reactions around the surfactant phase (Fig. S7c1) during the heat-treatment (120 °C for 24 h and further).
The obtained polymerized thin films are scarped from the Petri dishes and thermally treated at the temperature of 400 °C for 18 min by heating rate of 5 °C min-1 in argon
atmosphere with a flow rate of 10L h-1, leading to elimination of the surfactant (opening
of the mesoporosity) and to a partial carbonization of the polymer. For preparation of Cu/C ex-Tannin materials, another homogeneous solution (solution B) is pr epared by dispersing of copper precursor Cu(acac)2 with acacH = acetylacetone in absolute
ethanol via ultrasonication (Bandalin Sonorex RK106) with a maximum power output of 100 W for 5 min. To obtain a homogeneous material, solution A and solution B are mixed and stirred for 2 h. The mixture is then poured into four Petri dishes (5 mL in each Petri dish) so that obtaining thin film where the organized mesophase takes place. This mesophase transformation involves different steps: solvent evaporation with me so-structuration, thermal condensation phase, carbonization of the organic part and reduction of copper salt. Owing to the complexing ability of tannin, it is proposed that copper (II) is partly stabilized by the phenolic groups present in tannin. Tannin m imosa and its thermal decomposition products acts as reducing agents for Cu2+ to Cu0 clusters
(Fig. S7e). Coalescence of the copper cluster (Fig. S7f) leads to formation of copper nanoparticles (Fig. S7g) through a nucleation–growth mechanism. As presented in Fig. S7i, the mesoporous carbon structure, with open pores, that contains the co pper nanoparticles is obtained just after the removal of the surfactant. Herein, one may assume that the Cu crystallites have a perfect truncated octahedral shape (Fig. S7h) based on the Van Hardeveld and Hartog method 53 which describes the surface
structure (corners, edges, and faces) for non-supported perfect fcc crystallites.
Physicochemical Characterization
BET surface area and BJH pore size analysis
The nitrogen adsorption and desorption isotherms were conducted on a Micromeritics TriStar 3000 apparatus at 77 K. Prior to analysis, the samples were previously degassed at 363 K and then 523 K for at least 6h under vacuum. The surface area was calculated by the Brunauer-Emmett-Teller (BET) method and the pore size distribution curve was calculated by the Barret-Joyner-Halenda (BJH) method using adsorption branch of the isotherms.
Differential Thermal and Thermo-Gravimetric (DT/TG) analysis
Differential thermal and thermo-gravimetric (DT/TG) analysis was achieved by TA Instruments SDT-Q600 apparatus equipped with TA Universal analysis software. Two
alumina crucibles, one containing about 10 mg of the sample and another empty as a reference were thermally heated under air flow of 100 mL min-1 from 25 to 850 °C with
a temperature rate of 5 °C min-1.
X-ray diffraction analysis
X-ray diffraction data in the 2θ range of 15-100° with steps of 0.05° and fixed acquisition time of 2 min step-1 were collected using an ENPYREAN (PANalytical)
diffractometer in Bragg-Brentano (θ-θ) configuration with a copper tube powdered at 45 kV and 40 mA (Cukα1=1.54060 Å and Cukα2=1.54443 Å).
Cross-section transmission electron microscopy
Cross-section transmission electron microscopy (CS-TEM) observations were conducted on a TEM/STEM JEOL 2100 UHR (200 kV) microscope working at 200 kV accelerating voltage. The point and linear resolutions were 0.19 nm and 0.14 nm, respectively. Before cutting the sample by using diamond knifes with ultra-microtome (Leica UCR RT) in the section thickness between 50 and 70 nm, the sample is embedded in a polymeric resin (Epon) at 60 °C for 48 h. The nanoparticle size distribution and mean particle size were evaluated by ImageJ® free software.
Electrochemical Characterization and CO2 Electrolysis
The electrochemical behaviour of the Cu/C ex-Tannin electrode was evaluated from cyclic voltammetry (CV) on the glassy carbon electrode (5 mm diameter) at a scan rate of 50 mV s-1 in a standard three-electrode electrochemical cell, equipped with a glassy
carbon as the counter, and an Ag│AgCl (sat. KCl) as the reference electrode. Prior to measurement, 0.4 mol L-1 KHCO
3 with 4.0 mmol L-1 KCl was completely deoxygenated
by N2 (Linde Gas) for 30 min and then saturated by CO2 (Linde Gas) for another 30 min
with the pH value chancing from 8.3 to 7.2, respectively. All the potentials applied were converted to reversible hydrogen electrode (RHE) reference scale. The catalytic ink was prepared by ultrasonically dispersing the prepared catalyst powder in a mixture of isopropyl alcohol Aldrich, 99.5 wt.%) and 10% Nafion® suspension (Sigma-Aldrich 5 wt.%) at the ratio of 9:1 (v/v). Then, 10 µL ink is drop casted on the glassy carbon electrode, yielding a 62.2 µg of Cu per cm2 electrode.
CO2 electrolysis measurements were conducted using a bi-potentiostat
(Autolab-PGSTAT 302N) in a H-type cell separated by an ion-exchange Nafion®-117 membrane which is treated in 0.5 mol L-1 H
2SO4 solution at 90 °C for 8 h. The cell was designed to
have a large electrolyte volume of 100 mL in each compartment, along with a gas headspace of approximately 65 mL above the electrolyte on each side of membrane. It should be noted that the electrochemical cell was chemically cleaned with potassium permanganate acidic solution to remove the adsorbed impurities before electrochemical experiments. The counter and reference electrode are Pt/IrO2 grid and Ag│AgCl,
respectively. In the H-type electrolysis cell, a Ag wire covered with AgCl was used as a pseudo reference electrode. To better control the electrode potential, a small amount of chloride ions (4 mmol L-1 KCl) was added in the working compartment in order to
stabilize the Nernst equilibrium. The working electrode is consisting of Toray carbon paper (with a total 6.3 cm2 geometric area for both sides) with gold wire connection.
The electrode loading uses the same catalytic ink, however the volume of the ink deposited on to the wet proofed Toray carbon paper yielding a 0.15 mgCucm-2 of metal
cathodic potentials ranging from -0.32 to -1.12 V/RHE in the CO2-saturated catholyte at
room temperature. Prior to electrolysis, 0.4 mol L-1 KHCO
3 containing 4.0 mM KCl
aqueous catholyte and anolyte was de-aerated by N2 for 30 min, and then the catholyte
compartment saturated by CO2 another 30 min while keeping the anolyte under N2
purging. Corresponding chronoamperograms along with electric charge and electrolysis duration presented in supporting information (Fig. S5 and Table S1).
Chromatographic analysis
Gas products were quantified with on-line gas chromatography (Agilent Technologies, 490 GC), The residual reactant and/or product gases from the outlet of cathodic compartment were vented directly into the gas-sampling loop of the GC, equipped with a thermal conductivity detector (TCD) that possesses three columns. The first one was equipped with a packed M5 A HBF column at 80 °C for H
2 detection. The second channel
contained a packed PPQH column at 60 °C for hydrocarbon (C
xHy) detection, and a third
one was equipped with a packed COX HBF column at 120 °C for CO2 and CO detection.
Argon (Airgas, 99.999%) and helium (Airgas, 99.999%) were used as the carrier gases to quantify hydrogen and CO concentrations, respectively.
Liquid phase samples were analysed by high performance liquid chromatography (HPLC) which was equipped with Aminex®HPX-87H Ion Exclusion Column, Dionex Ultimate 3000 Pump, ASI-100 Automated Sample Injector and UV-detector. A 3.0 mM sulfuric acid solution was used as the mobile phase at 25 °C with a 0.60 mL min-1 flow
rate.
On-line Differential Electrochemical Mass Spectrometry (DEMS) Measurements
The gaseous species generated during CO2RR were also monitored by using on -line DEMS. Here, qualitative analyses were performed under potentiostati c conditions 54, 55.
The DEMS equipment was constructed with a Pfeiffer Vacuum QMA 200 quadrupole mass spectrometer, and two turbomolecular pumps. The electrochemical cell was designed specifically for the coupling with mass spectrometer. The working electrodes for DEMS measurements were prepared on carbon cloth (PWB-3, Stackpole, with a 0.9498 cm2 geometric area) pressed to a Gore-Tex PTFE membrane (pore size 0.02
µm), which served as interface layer between electrochemical cell and the high vacuum of the mass spectrometer, following a configuration similar to those utilized in a previous published study 54, 56 Carbon dioxide was bubbled into the electrolyte (herein KHCO
3)
to maintain saturation, and the electrolyte was constantly stirred using a magnetic b ar. A high area platinum electrode and an Ag│AgCl (sat. KCl) served as counter and reference electrodes, respectively. Typically, the electrochemical potential was recorded simultaneously with the ionic current (mass signal intensity) for selected values of mass/charge (m/z) ionic signals, being m/z = 2 (H2), m/z = 15 (CH4), and m/z
= 26 (C2H4). The electrochemical cell was controlled by an Autolab (PGSTAT128N)
Potentiostat/Galvanostat, and the DEMS equipment was piloted by the Quadera® analysis software (the output signal of the potential ramp from the potentiostat was registered by the DEMS equipment electronics in order to synchronized it with the mass signals). More details about DEMS electrode setup are presented in previous studies
Conclusions
We have demonstrated a facile and cost-effective route on synthesis of mesoporous carbon-embedded nanostructured copper electrocatalyst from a one-pot evaporation-induced self-assembly process. Physicochemical characterizations combined with electrochemical examinations revealed that the high catalytic activity originates from the nanostructured copper particles and also porous network that provides a favourable local environment for CO2 electroreduction. Notably, the electrocatalytic activity of the
Cu/C ex-Tannin material was evaluated by cyclic voltammetry measurements, showing catalytic ability of prepared electrode surface. Moreover, we have shown that Cu/C ex -Tannin catalysts preferably catalyse the CO2 reduction reaction into formic acid with a
remarkable F.E of 31.2% at the potential of -0.62 V/RHE. This allows conceptualization and understanding of reaction selectivity in bench-scale fundamental studies. In addition to CO2 electrocatalysis measurements, the on-line DEMS examinations
indicated that low-chain hydrocarbons (CH4 and C2H4) are selectively acquired from
CO2 electroreduction on the Cu/C ex-Tannin electrocatalyst. To sum up, these results
highlight the significant role of one pot soft-templating process on the preparation of the three-dimensional porous electrodes embedding nanostructured copper particles with interesting CO2 electroreduction properties regarding efficiency and selectivity. This
study confers valuable insights towards engineering and designing more effective materials that overcome the reaction limitations for scalable CO2 catalysis.
Conflicts of interest
There are no conflicts to declare.
Acknowledgements
This work was financially supported by the European Union (ERDF) and “Région Nouvelle-Aquitaine”. N. S. (IC2MP) is grateful for Post-doctoral research grant acknowledged by Centre National Scientific Research, France (CNRS, ANR E-CLOCK Project). F. B. H. L. and M. R. C. (IQSC) acknowledge financial support from FAPESP grants 2016/13323-0, 2013/16930-7, and 2014/26699-3, and CNPq grants 309465/2019-2 (F. B. H. L.) and 164293/2017-5 (W. O. S.).
References
1. Y. Wang, J. Liu, Y. Wang, A. M. Al-Enizi and G. Zheng, Small, 2017, 13, 1701809.
2. M. Jouny, W. Luc and F. Jiao, Ind. Eng. Chem. Res., 2018, 57, 2165-2177. 3. S. Hernández, M. Amin Farkhondehfal, F. Sastre, M. Makkee, G. Saracco and
N. Russo, Green Chem., 2017, 19, 2326-2346.
4. J. Albo, M. Alvarez-Guerra, P. Castaño and A. Irabien, Green Chem., 2015, 17, 2304-2324.
5. Y. Lum, Y. Kwon, P. Lobaccaro, L. Chen, E. L. Clark, A. T. Bell and J. W. Ager,
ACS Catal., 2016, 6, 202-209.
6. H. Han, Y. Noh, Y. Kim, S. Park, W. Yoon, D. Jang, S. M. Choi and W. B. Kim,
Green Chem., 2020, 22, 71-84.
7. X. Lu, D. Y. C. Leung, H. Wang, M. K. H. Leung and J. Xuan, ChemElectroChem, 2014, 1, 836-849.
8. K. Ogura, J. CO2 Util., 2013, 1, 43-49.
9. J. Fischer, T. Lehmann and E. Heitz, J. Appl. Electrochem., 1981, 11, 743-750. 10. F. Piccinno, R. Hischier, S. Seeger and C. Som, J. Clean. Prod., 2016, 135,
1085-1097.
12. L. R. L. Ting and B. S. Yeo, Curr Opin Electrochem, 2018, 8, 126-134. 13. H. Xie, T. Wang, J. Liang, Q. Li and S. Sun, Nano Today, 2018, 21, 41-54. 14. D. Kim, C. S. Kley, Y. Li and P. Yang, PNAS, 2017, 114, 10560-10565.
15. Z. Gu, H. Shen, L. Shang, X. Lv, L. Qian and G. Zheng, Small Methods, 2018,
2, 1800121.
16. T. Kim and G. T. R. Palmore, Nat. Commun., 2020, 11, 3622-3632.
17. N. Yang, S. R. Waldvogel and X. Jiang, ACS Appl. Mater. Interfaces, 2016, 8, 28357-28371.
18. H. Song, M. Im, J. T. Song, J.-A. Lim, B.-S. Kim, Y. Kwon, S. Ryu and J. Oh,
Appl. Catal. B: Environ., 2018, 232, 391-396.
19. O. Ayemoba and A. Cuesta, ACS Appl. Mater. & Interfaces, 2017, 9, 27377-27382.
20. D. Kim, C. S. Kley, Y. Li and P. Yang, PNAS, 2017, 114, 10560-10565.
21. S. Nitopi, E. Bertheussen, S. B. Scott, X. Liu, A. K. Engstfeld, S. Horch, B. Seger, I. E. L. Stephens, K. Chan, C. Hahn, J. K. Nørskov, T. F. Jaramillo and I. Chorkendorff, Chem. Rev., 2019, 119, 7610-7672.
22. K. P. Kuhl, E. R. Cave, D. N. Abram and T. F. Jaramillo, Energy Environ. Sci., 2012, 5, 7050-7059.
23. R. Kas, K. K. Hummadi, R. Kortlever, P. de Wit, A. Milbrat, M. W. J. Luiten-Olieman, N. E. Benes, M. T. M. Koper and G. Mul, Nat. Commun., 2016, 7, 10748.
24. A. A. Peterson, F. Abild-Pedersen, F. Studt, J. Rossmeisl and J. K. Norskov,
Energy Environ. Sci., 2010, 3, 1311-1315.
25. Y. Hori, K. Kikuchi, A. Murata and S. Suzuki, Chem. Lett., 1986, 15, 897-898. 26. N. E. Şahin, C. Comminges, A. Le Valant, J. Kiener, J. Parmentier, T. W.
Napporn, G. Melinte, O. Ersen and K. B. Kokoh, ChemPhysChem, 2018, 19, 1371-1381.
27. W. Li, J. Liu and D. Zhao, Nat. Rev. Mater. s, 2016, 1, 16023. 28. J. Zhang and C. M. Li, Chem. Soc. Rev., 2012, 41, 7016-7031.
29. N. Whilst tLinares, A. M. Silvestre-Albero, E. Serrano, J. Silvestre-Albero and J. Garcia-Martinez, Chem. Soc. Rev., 2014, 43, 7681-7717.
30. M. Liu, Y. Pang, B. Zhang, P. De Luna, O. Voznyy, J. Xu, X. Zheng, C. T. Dinh, F. Fan, C. Cao, F. P. G. de Arquer, T. S. Safaei, A. Mepham, A. Klinkova, E. Kumacheva, T. Filleter, D. Sinton, S. O. Kelley and E. H. Sargent, Nature, 2016,
537, 382-386.
31. R. M. Arán-Ais, D. Gao and B. Roldan Cuenya, Acc. Chem. Res., 2018, 51, 2906-2917.
32. P. Friebe, P. Bogdanoff, N. Alonso-Vante and H. Tributsch, J. Catal., 1997, 168, 374-385.
33. M. R. Singh, Y. Kwon, Y. Lum, J. W. Ager and A. T. Bell, J Am Chem Soc, 2016,
138, 13006-13012.
34. E. L. Clark, M. R. Singh, Y. Kwon and A. T. Bell, Anal. Chem., 2015, 87, 8013-8020.
35. A. C. Queiroz, W. O. Silva, I. A. Rodrigues and F. H. B. Lima, Appl. Catal. B:
Environ., 2014, 160-161, 423-435.
36. J.-P. Grote, A. R. Zeradjanin, S. Cherevko, A. Savan, B. Breitbach, A. Ludwig and K. J. J. Mayrhofer, J. Catal., 2016, 343, 248-256.
37. S. Schlienger, A.-L. Graff, A. Celzard and J. Parmentier, Green Chem., 2012,
14, 313-316.
38. S. Åsbrink and L.-J. Norrby, Acta Crystallogr. B, 1970, 26, 8-15.
39. L. A. Estudillo-Wong, Y. Luo, J. A. Díaz-Real and N. Alonso-Vante, Appl. Catal.
B: Environ., 2016, 187, 291-300.
40. B.-J. Kim, K.-S. Cho and S.-J. Park, J. Colloid Interface Sci., 2010, 342, 575-578.
41. T. Tsuruoka, I. Valov, S. Tappertzhofen, J. van den Hurk, T. Hasegawa, R. Waser and M. Aono, Adv. Funct. Mater., 2015, 25, 6374-6381.
42. Z. Dursun and G. Nisli, Talanta, 2004, 63, 873-878.
43. O. F. Lopes and H. Varela, ChemistrySelect, 2018, 3, 9046-9055.
44. M. A. Rizvi, S. A. Akhoon, S. R. Maqsood and G. M. Peerzada, J. Anal.l Chem., 2015, 70, 633-638.
45. H. Hashiba, S. Yotsuhashi, M. Deguchi and Y. Yamada, ACS Comb. Sci., 2016,
18, 203-208.
46. J.-J. Velasco-Vélez, T. Jones, D. Gao, E. Carbonio, R. Arrigo, C.-J. Hsu, Y.-C. Huang, C.-L. Dong, J.-M. Chen, J.-F. Lee, P. Strasser, B. Roldan Cuenya, R. Schlögl, A. Knop-Gericke and C.-H. Chuang, ACS Sustain. Chem. & Eng., 2019,
7, 1485-1492.
47. H. Mistry, A. S. Varela, C. S. Bonifacio, I. Zegkinoglou, I. Sinev, Y.-W. Choi, K. Kisslinger, E. A. Stach, J. C. Yang, P. Strasser and B. R. Cuenya, Nat. Commun., 2016, 7, 12123.
48. W. Tang, A. A. Peterson, A. S. Varela, Z. P. Jovanov, L. Bech, W. J. Dur and, S. Dahl, J. K. Nørskov and I. Chorkendorff, Phys. Chem. Chem. Phys., 2012, 14, 76-81.
49. F. Cavalca, R. Ferragut, S. Aghion, A. Eilert, O. Diaz-Morales, C. Liu, A. L. Koh, T. W. Hansen, L. G. M. Pettersson and A. Nilsson, J. Phys. Chem. C, 2017, 121, 25003-25009.
50. Y. Lum and J. W. Ager, Angew. Chem. Int. Ed., 2018, 57, 551-554.
51. K. Mortensen, W. Batsberg and S. Hvidt, Macromolecules, 2008, 41, 1720-1727. 52. S. Schlienger, C. Ducrot-Boisgontier, L. Delmotte, J.-L. Guth and J. Parmentier,
J. Phys. Chem. C, 2012, 118, 11919-11927.
53. R. Van Hardeveld and F. Hartog, Surf. Sci, 1969, 15, 189-230.
54. O. Wolter and J. Heitbaum, Ber. Bunsenges. Phys. Chem., 1984, 88, 2-6. 55. M. R. Camilo, W. O. Silva and F. H. B. Lima, J. Braz. Chem. Soc., 2017, 28,
1803-1815.
56. H. Baltruschat, J. Am. Soc. Mass Spectrom., 2004, 15, 1693-1706.
W. O. Silva, G. C. Silva, R. F. Webster, T. M. Benedetti, R. D. Tilley and E. A. Ticianelli,
Electronic Supporting Information
CO
2electroreduction to fuels on mesoporous carbon-embedded copper
nanoparticles
Nihat Sahin,a,b Wanderson O. Silva,b Mariana R. Camilo,b Edson A. Ticianelli,b Fabio H. B. Lima,b Julien Parmentier,c