HAL Id: hal-02115703
https://hal.archives-ouvertes.fr/hal-02115703
Submitted on 30 Apr 2019
HAL is a multi-disciplinary open access
archive for the deposit and dissemination of sci-entific research documents, whether they are pub-lished or not. The documents may come from teaching and research institutions in France or abroad, or from public or private research centers.
L’archive ouverte pluridisciplinaire HAL, est destinée au dépôt et à la diffusion de documents scientifiques de niveau recherche, publiés ou non, émanant des établissements d’enseignement et de recherche français ou étrangers, des laboratoires publics ou privés.
Modifications of the chemical structure of phenolics
differentially affect physiological activities in pulvinar
cells of Mimosa pudica L. II. Influence of various
molecular properties in relation to membrane transport
Françoise Rocher, Gabriel Roblin, Jean-François Chollet
To cite this version:
Françoise Rocher, Gabriel Roblin, Jean-François Chollet. Modifications of the chemical structure of phenolics differentially affect physiological activities in pulvinar cells of Mimosa pudica L. II. In-fluence of various molecular properties in relation to membrane transport. Environmental Science and Pollution Research, Springer Verlag, 2017, 24 (8), pp.6910-6922. �10.1007/s11356-016-6048-z�. �hal-02115703�
Modifications of the chemical structure of phenolics
differentially affect physiological activities in
pulvinar cells of Mimosa pudica L. II. Influence of
various molecular properties in relation to
membrane transport
Françoise Rochera, Gabriel Roblinb and Jean-François Cholleta*,
a IC2MP (Institut de Chimie des Milieux et des Matériaux de Poitiers), UMR CNRS 7285, Université de Poitiers, 4 rue Michel Brunet, TSA 51106, F-86073 Poitiers cedex 9, France b Laboratoire EBI (Écologie et Biologie des Interactions), UMR CNRS 7267, Équipe SEVE (Sucres, Échanges Végétaux, Environnement), Université de Poitiers, 3 rue Jacques Fort, TSA 51106, F-86073 Poitiers cedex 9, France
* Corresponding author. Tel.: +33 5 49 45 39 65 E-mail address: jfcholle@univ-poitiers.fr
This work was presented at the 45th Congress of the “Groupe Français des Pesticides” which was held in Versailles from 27 to 29 May 2015
Manuscript 1 2 3 4 5 6 7 8 9 10 11 12 13 14 15 16 17 18 19 20 21 22 23 24 25 26 27 28 29 30 31 32 33 34 35 36 37 38 39 40 41 42 43 44 45 46 47 48 49 50 51 52 53 54 55 56 57 58 59 60
Abstract
Early prediction of compound absorption by cells is of considerable importance in the building of an integrated scheme describing the impact of a compound on intracellular biological processes. In this scope, we study the structure-activity relationships of several benzoic acid-related phenolics which are involved in many plant biological phenomena (growth, flowering, allelopathy, defense processes). Using the PLS regression method, the impact of molecular descriptors that have been shown to play an important role concerning the uptake of
pharmacologically active compounds by animal cells was analyzed in terms of the modification of membrane potential, variations in proton flux and inhibition of the osmocontractile reaction of pulvinar cells of Mimosa pudica leaves. The hydrogen bond donors (HBD) and hydrogen bond acceptors (HBA), polar surface area (PSA), halogen ratio (Hal ratio), number of rotatable bonds (FRB), molar volume (MV), molecular weight (MW), molar refractivity (MR) were considered in addition to two physico-chemical properties (logD and the amount of non-dissociated form in relation to pKa. HBD+HBA and PSA predominantly impacted the three biological processes compared to the other descriptors. The coefficient of determination in the QSAR models indicated that a major part of the observed seismonasty inhibition and proton flux modification can be explained by the impact of these descriptors, whereas this was not the case for membrane potential variations. These results indicate that the transmembrane transport of the compounds is a predominant component. An increasing number of implicated descriptors as the biological processes become more complex may reflect their impacts on an increasing number of sites in the cell. The determination of the most efficient effectors may lead to a practical use to improve drugs in the control of microbial attacks on plants.
Keywords: H+ fluxes, Membrane potential, Mimosa pudica, Phenolics, Salicylic acid,
Seismonasty, Transmembrane transport
1 2 3 4 5 6 7 8 9 10 11 12 13 14 15 16 17 18 19 20 21 22 23 24 25 26 27 28 29 30 31 32 33 34 35 36 37 38 39 40 41 42 43 44 45 46 47 48 49 50 51 52 53 54 55 56 57 58 59 60
Introduction
The plant-specific phenolic compounds intervene in a broad range of physiological processes from a structural role in the cell wall to effects on growth, defense mechanisms and
allelopathy (Cheynier et al. 2013, Rice 1984). The impact of these compounds on so different biological phenomena may be expected as they appear to be multisite effectors on a variety of important cellular targets. In fact, they influence membrane permeability, nutrient uptake, photosynthesis and respiration, and activity of many enzymes (Muscolo et al. 2001, Weir et al. 2004). Importantly, their pivotal effect as uncouplers of oxidative phosphorylation has been largely documented (Dédaldéchamp et al. 2014, Polygalova &Ponomareva 2010, Stenlid &Saddik 1962). Their implication in interrelations between plants and microorganisms such as in the processes of resistance of plants against pathogen attacks has been emphasized (Harborne 1980). Interestingly, some of them may also present antimicrobial properties. Thus, a treatment that alters spore viability in Saccharomyces cerevisiae (Romano &Suzzi 1985) also reduces the germination of blastospores of the entomopathogen Paecilimyces
fumosoroseus (Vega et al. 1997) and contains growth of Botrytis cinerea (Dieryckx et al.
2015 and references therein). In this regard, we have previously shown that many benzoic acid (BA) derivatives inhibit the development of pathogenic fungi that induce serious diseases in vines, namely, Phaeoacremonium aleophilum, Phaeomoniella chlamydospora, Botrytis
cinerea (unpublished results) and Eutypa lata (Amborabé et al. 2002). A noteworthy
observation was that a small modification in the molecular arrangement may dramatically change the degree of the inhibition of the mycelial growth of E. lata. In particular, the 2-position of the benzene ring occupied by -OH, -OCH3 and a halogen conferred a high
inhibitory activity to the molecule. Furthermore, halogen substitution at other positions of the ring maintained this high level of reactivity. The carboxylic acid function is also of
importance as compared to aldehyde and amide. Increasing the length of the carbon chain bearing the acid function leads to increased efficiency (Amborabé et al. 2002, Rocher et al. 2014).
In a previous study related to the early events triggered by salicylic acid (SA) on plant cell, we observed that the structural changes in the molecular arrangement efficient in the experiments on E. lata development also dramatically modified in the same way several physiological processes exhibited by the motor cells in the leaf pulvinus of Mimosa pudica. Indeed, a differential action of these compounds was observed according to the molecular structure as well on membrane processes (modification of membrane electrical potential ),
1 2 3 4 5 6 7 8 9 10 11 12 13 14 15 16 17 18 19 20 21 22 23 24 25 26 27 28 29 30 31 32 33 34 35 36 37 38 39 40 41 42 43 44 45 46 47 48 49 50 51 52 53 54 55 56 57 58 59 60
the metabolic chain (respiration), enzyme function (plasma membrane H+-ATPase activity) or
on more global processes such as alterations to organelles (mitochondria in particular) and the macroscopic response to external stimuli (osmocontractile cell reaction under touch of the organ, leading to drooping of the leaf) (Dédaldéchamp et al. 2014, Rocher et al. 2014, Saeedi et al. 2013). Such a structure-activity relationship with this type of compound has already been reported on other plant metabolic processes such as thermogenesis (Raskin et al. 1989) and flowering (Kaihara et al. 1981, Oota 1975), indicating therefore that these compounds act through a very general mode of action. Therefore, the leaf pulvinus of M. pudica appears as a convenient experimental model to obtain a rapid result concerning the possible effect of a compound on cellular processes.
In order to reach the target cell, a pivotal step of the differential action may be linked to the modalities of absorption of this type of compound, related to their ionization capacity as a function of the external pH. Therefore, it has been admitted that this type of molecule crosses plant plasma membranes by a ion trapping mechanism (Krasavina 2007). However, further experiments with salicylic acid (SA) have shown that uptake is more complex since a mechanism of active transport has been shown as a complement to the ion trapping
mechanism (Bonnemain et al. 2013, Rocher et al. 2009). Nevertheless, a large component of uptake may be attributed to diffusion processes and, consequently, in this case, the
liposolubility represented by the partition coefficient Kow and the amount of the
non-dissociated form of the molecules related to the degree of ionization may play a predominant role.
In previously reported experiments (Rocher et al. 2014), the differential effect noted between BA derivatives on H+ influx and inhibition of the seismonastic reaction in motor cells has
been tentatively related to two physico-chemical parameters, i.e. logD (representing the liposolubility of a molecule at a given pH) and the degree of ionization (% of the
undissociated form, UF) of the molecule. A statistical analysis has permitted us to conclude that logD and UF do not satisfactorily explain the variation in activity noted between the different BA derivatives. Therefore, the aim of the present study was to derive a quantitative structure-activity relationship (QSAR) equation which, based on previous measurements made on the effects on , proton fluxes and inhibition of the seismonastic reaction and calculated physicochemical descriptors relevant to passive membrane permeability, will allow for the prediction of the effects on biological processes. Indeed, QSAR is based on the
hypothesis that the structure of the molecule contains the characteristics responsible for its physical, chemical or biological properties, allowing the prediction of activity. A number of
1 2 3 4 5 6 7 8 9 10 11 12 13 14 15 16 17 18 19 20 21 22 23 24 25 26 27 28 29 30 31 32 33 34 35 36 37 38 39 40 41 42 43 44 45 46 47 48 49 50 51 52 53 54 55 56 57 58 59 60
physicochemical properties and theoretical molecular descriptors were calculated. Most of them are known to play an important role in drug development for predicting bioavailability and particularly the determining step of passage across biological membranes like the
gastrointestinal tract barrier or the blood-brain barrier. Molecular descriptors can be related to steric properties such as the molecular weight (MW), the molar volume (MV), the molar refractivity (MR) or the number of rotatable bonds (FRB). MV is the volume occupied by one mole of a substance and is expressed in cm3.mol-1. MR is one of the oldest and most
successful descriptors for QSAR studies and is calculated by the Lorenz-Lorentz formula. MR increases with alkyl chain length and polar functional groups increase MR. For a radiation of infinite wavelength, MR represents the real volume of the molecules (Padron et al. 2002). FRB are defined as any single bond, not in a ring, bound to a terminal heavy (i.e., non-hydrogen) atom. Excluded from this count are amide C-N bonds because of their high
rotational energy barrier (Veber et al. 2002). Hydrogen-bonding capacity is an example of an electronic descriptor and is estimated by counting the number of possible hydrogen bond donors (HBD, number of hydrogens connected to N- and O-atoms) and possible hydrogen bond acceptors (HBA, number of O- and N-atoms in an appropriate functional group) and the sum of both (HBD + HBA) (Winiwarter et al. 2003, Winiwarter et al. 1998). LogD and polar surface area (PSA) are hydrophobic/hydrophilic molecular descriptors. LogD is defined as the effective partitioning of all ionic forms of a compound present in equilibrium at a specific pH in an octanol-water mixture (Rocher et al. 2006). PSA is the sum over all electronegative surface atoms (N, O, S) and H atoms in polar bonds (e.g. O-H, N-H, S-H) (Ertl et al. 2000, Palm et al. 1997). To avoid the necessity of generating a reasonable 3D molecular geometry before the calculation of the surface itself, a new fast and reliable approach for the calculation of the PSA has been proposed, based on the summation of tabulated surface contributions of polar fragments (Ertl 2008, Ertl et al. 2000). pKa and the percentage of undissociated form (UF) at a given pH also give important information on this family of carboxylic acids, taking into account that only the lipophilic neutral form is able to cross the plasma membrane by diffusion (Chollet et al. 2004, 2005, Kleier 1988, Rigitano et al. 1987). Finally, halogen substituents are generally known to play a major role in the biological activity of many active ingredients, particularly agrochemicals (Jeschke 2004). The halogen ratio (Hal ratio)
represents the ratio between the number of halogen atoms related to the total count of atoms in the molecule, excluding hydrogen atoms.
The partial least squares regression method (PLS) was applied to tentatively find relationships between the extent of the modification induced on biological processes observed in leaf
1 2 3 4 5 6 7 8 9 10 11 12 13 14 15 16 17 18 19 20 21 22 23 24 25 26 27 28 29 30 31 32 33 34 35 36 37 38 39 40 41 42 43 44 45 46 47 48 49 50 51 52 53 54 55 56 57 58 59 60
pulvinar of M. pudica (namely, H+ influx and inhibition of the seismonastic reaction) and
the physicochemical data of the set of BA derivatives. These data may be of importance as the determination of the most efficient effectors may lead to a practical use to improve drugs to control microbial attacks on plants.
Materials and methods
Plant growth conditions and observation of the seismonastic pulvinar reaction
Seedlings and older plants of Mimosa pudica L. were grown in an organic compost watered daily and kept in climate-controlled chambers at 27.5 ± 0.5°C and 65 ± 5% relative humidity. Illumination was regulated to give 16 h of light (photophase 6:00 A.M. to 10:00 P.M.)
provided by fluorescent tubes (mixing Osram fluora and Osram day-light types) with a photon fluence rate (400-700 nm) of 80 µmol m-2 s-1 at the plant apex (Rocher et al. 2014).
These plants are characterized by their leaves with high sensitivity to environmental changes. In particular, a touch triggers rapid movements (seismonastic reaction) mediated by
differentiated motor organs (or pulvini). These rapid movements (achieved in 2 s) are
regulated through electrical and chemical signals (Volkov et al. 2010 and references therein). In this model, a macroscopic effect of an exogenously applied compound may be
quantitatively determined by measuring the extent of the drooping movement determined by angular measurements, as described previously in detail (Saeedi et al. 2013). Briefly,
seedlings of M. pudica bearing the first fully developed leaf constituted the experimental model for the observation of the seismonastic motor reaction. Phenolics dissolved in a
medium buffered with 2.5 mM MES at pH 5.2 were applied through the cut hypocotyls of the seedlings 4 h after harvesting to allow recovery. After measurement of the initial angle, the pulvini were stimulated by a touch applied on the abaxial half of the organ at 1-h intervals for 4 h. The motor reaction was monitored by measuring the variation of the angle within 10 s after the stimulation. Each experiment was carried out on 30 seedlings separated in 3 sets.
Electrophysiological and proton flux modifications
A major advantage of the pulvinus model is linked to its size, allowing easy handling to investigate cellular processes. In addition, its particular anatomy, characterized by many layers of parenchyma cells surrounding the central cylinder, insures impalement of microelectrodes in a well-defined kind of cell. The experiments were done on 2-month-old plants bearing generally 10 leaves.
1 2 3 4 5 6 7 8 9 10 11 12 13 14 15 16 17 18 19 20 21 22 23 24 25 26 27 28 29 30 31 32 33 34 35 36 37 38 39 40 41 42 43 44 45 46 47 48 49 50 51 52 53 54 55 56 57 58 59 60
The modification of the resting potential (about -120 mV) following the application of phenolic compounds have been monitored by the classical electrophysiological method using microelectrodes (tip diameter < 1 µm, tip resistance from 5 to 30 MΩ). For details, see (Amborabé et al. 2008).
Briefly, the glass microelectrode was impaled into a motor cell of the abaxial (“extensor”) half of the primary pulvinus in excised leaves bathing in a buffered medium (10 mM MES/NaOH, pH 5.2) containing 1 mM NaCl, 0.1 mM KCl, and 0.1 mM CaCl2 (Abe 1981).
Data with phenolics were obtained from 3 to 8 assays (Rocher et al. 2014, Saeedi et al. 2013). In order to observe a possible modification to H+-ATPase activity, modification of H+
excretion performed by pulvinar tissues was monitored by quantifying the amount of
mobilized protons, as described previously (Saeedi et al. 2013). Briefly, transverse sections of primary pulvini were incubated in a medium composed of 0.50 mM CaCl2, 0.25 mM MgCl2
supplemented with the studied phenolic. Titration was made 3 h after the application of the compounds on 2 ml of the incubation medium with NaOH or HCl at 5.10-3 N. The
experiments were repeated at least 3 times.
Chemicals
All chemicals were purchased from Sigma-Aldrich Chimie SarL, France. They were prepared and used with the previously described cautions (Rocher et al. 2014), in particular their dilution in an appropriate buffer, e.g. MES at pH 5.2.
Statistical analyses
A number of physicochemical properties and theoretical molecular descriptors were computed using ACD LogD sol suite software v. 12.01. The PLS regression method (Wold et al. 2001) was applied using XLStat 2015 MS Excel add-in. The VIP plot shows the most important descriptors over the model as a whole. The VIP score of a predictor is a summary of the importance for the projections to find latent variables and it can be calculated according to (Chong &Jun 2005). The average of squared VIP scores equals 1 and VIP > 0.8 was used as a criterion for variable selection.
Standardized coefficients were used to compare the relative weights of the descriptors (Palermo et al. 2009). The higher the absolute value of a coefficient, the more important the weight of the corresponding descriptor. The standardized coefficient Csxi of the explanatory
variable xi is calculated with the following formula:
1 2 3 4 5 6 7 8 9 10 11 12 13 14 15 16 17 18 19 20 21 22 23 24 25 26 27 28 29 30 31 32 33 34 35 36 37 38 39 40 41 42 43 44 45 46 47 48 49 50 51 52 53 54 55 56 57 58 59 60
Cs = C ∗SD SD
With Cxi: coefficient of the variable xi in the QSAR equation; SDxi: Standard Deviation of the
variable xi; SDy: Standard Deviation of the dependent variable y
This also allowed us to determine whether the descriptor act either positively or negatively on the process. When the confidence interval around standardized coefficients has a value of 0 (this can be easily seen on the chart), the weight of a variable in the model is not significant. The problem was further investigated in each studied process by dividing the experimental data into sets which showed very distinct statistically significant results. Taking into account that 53 compounds were tested to evaluate their influence on leave movement and only 37 among them were further studied for their activity on pH and membrane potential variations, we respectively used 4 and 3 sets in order to consider approximately the same number of compounds (n = 12-14) in the statistical analyses. The molecular descriptors were compared in each set. The Kruskal-Wallis test was used to assess statistically significant differences between each set.
Results
The chemical structure of the studied compounds and the characteristics of the considered chemical descriptors are given in Table 1. In this table, the experimental data concerning seismonasty inhibition, proton fluxes and membrane potential variation reported in Rocher et al (2014) (Rocher et al. 2014) are also given.
Relationships between the seismonastic reaction and the computed descriptors for phenolics
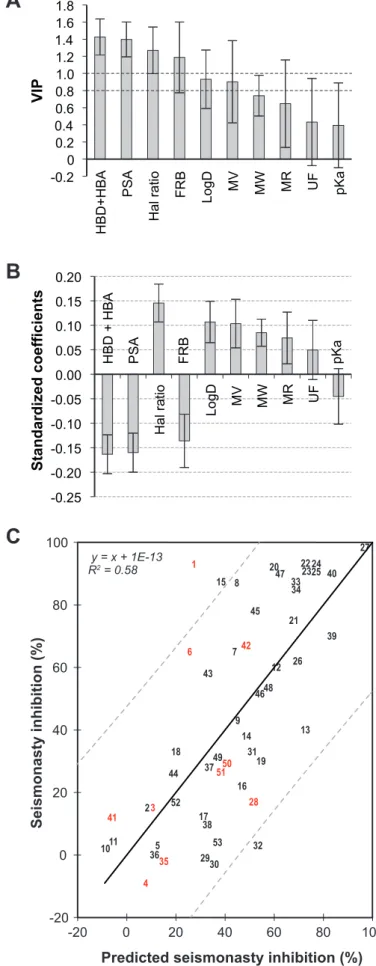
As shown in Fig. 1A, from the VIP plot, it appears that the chosen molecular descriptors acted at various degrees on the seismonastic reaction. The data in Fig. 1B concerning the
standardized coefficients show that HBD+HBA, PSA and FRB had a strong negative influence whereas the Hal ratio, logD, MV, MW, MR had a positive influence. Of note, UF and pKa presented no involvement.
According to these calculations, Fig. 1C shows that a good correlation was found between the experimental data and the predicted values issued from the QSAR equation. The coefficient of determination indicated that 58% of the observed inhibition can be explained by the impact of these descriptors. 1 2 3 4 5 6 7 8 9 10 11 12 13 14 15 16 17 18 19 20 21 22 23 24 25 26 27 28 29 30 31 32 33 34 35 36 37 38 39 40 41 42 43 44 45 46 47 48 49 50 51 52 53 54 55 56 57 58 59 60
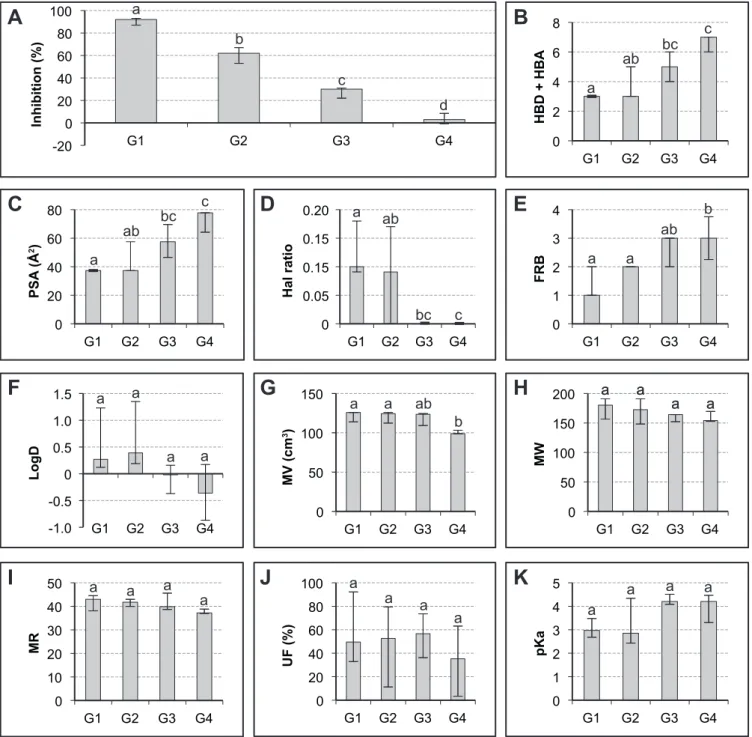
In order to refine this global result, an analysis was carried out on the data obtained by considering the phenolic-induced reaction inhibition classed by decreasing efficiency in four separate groups. These groups contained a comparable number of samples (respectively 13, 13, 13 and 14 in G1, G2, G3 and G4) and showed very significant differences using the Kruskal-Wallis test (Fig. 2A).
It was therefore corroborated that high values of HBD+HBA, PSA and FRB correspond to phenolics showing little inhibition of movement (Fig. 2 B, C and E). By contrast, high values of the Hal ratio and MV correspond to compounds inducing considerable inhibition (Fig. 2 D and G).
logD, MW and MR did not show significantly different values between the four groups, so there was a tendency to confirm the data in Fig. 1B.
Relationships between the amplitude of the proton flux and the computed descriptors for phenolics
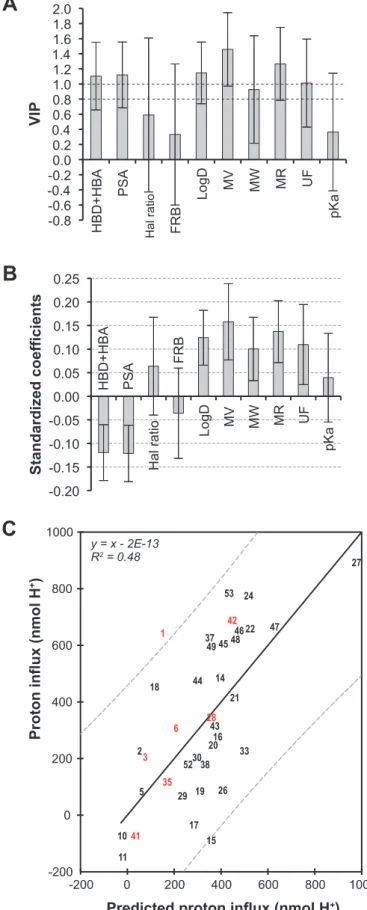
As shown in Fig. 3 A and B, HBD and PSA presented a strong negative influence on proton flux whereas logD, MV, MR and UF had a positive influence and pKa did not intervene. Note that, in contrast to the seismonastic inhibition, FRB and the Hal ratio had no effect. In the latter case, a relatively small number of halogenated products may have introduced an artifactual result. However, a good correlation was found between the experimental data and the predicted values provided by the QSAR equation. The coefficient of determination indicated that 48% of the action on proton flux can be explained by the impact of the descriptors.
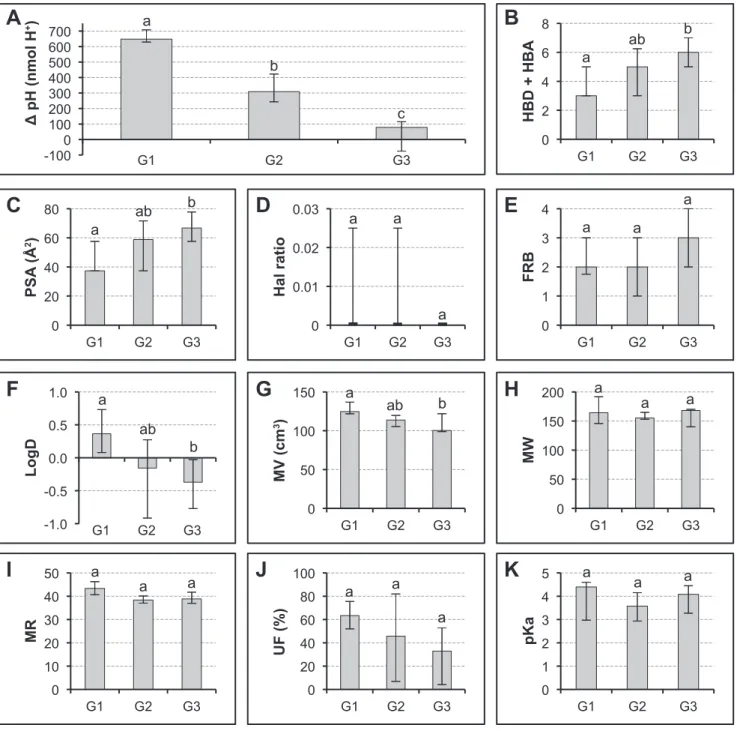
A further analysis was carried out on the data obtained by considering the phenolic-induced proton flux classed into three separate groups formed from decreasing values. These three groups had a comparable number of samples (respectively 12, 12 and 13 in G1, G2 and G3) and showed very significant differences using the Kruskal-Wallis test (Fig. 4 A).
It was therefore corroborated that high values of HBD+HBA and PSA characterize phenolics inducing a low influx of protons (Fig. 4 B and C). By contrast, negative values of logD and low values of MV correspond to compounds inducing low proton influx or proton efflux (Fig. 4 F and G).
MW, MR and UF did not show significantly different values between the three groups. It should be stressed that the Hal ratio and FRB did not show significant differences between the three groups, indicating the absence of influence on this process.
1 2 3 4 5 6 7 8 9 10 11 12 13 14 15 16 17 18 19 20 21 22 23 24 25 26 27 28 29 30 31 32 33 34 35 36 37 38 39 40 41 42 43 44 45 46 47 48 49 50 51 52 53 54 55 56 57 58 59 60
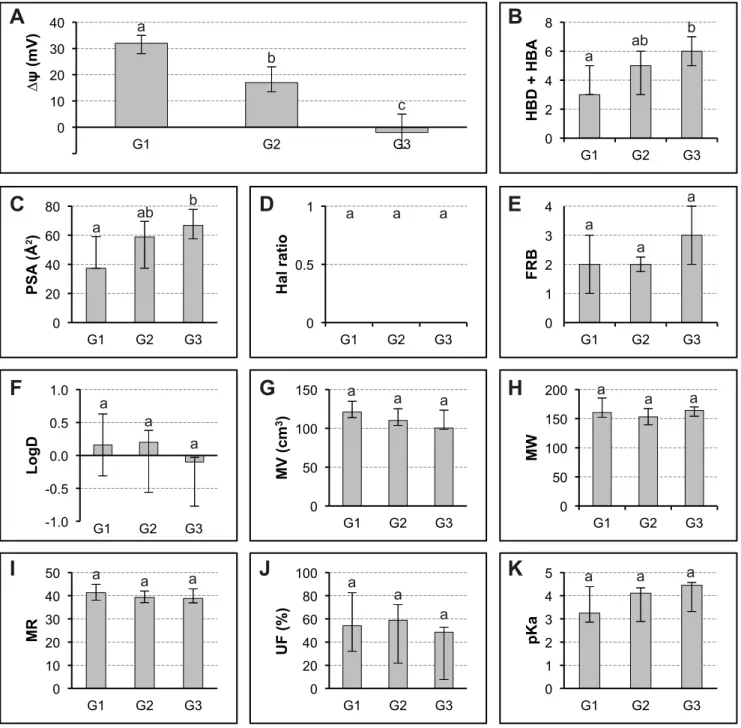
Relationships between the amplitude of the membrane potential variation and the computed descriptors for phenolics
As shown in Fig. 5 A and B, HBD + HBA and PSA were the only significant descriptors that had a strong negative influence on the bioelectrical membrane potential. No clear correlation was found between the experimental data and the predicted values issued from the QSAR equation. The coefficient of determination indicated that only 28% of the potential variation can be linked to the effect of these descriptors.
An analysis was carried out on the data obtained by considering the phenolic-induced hyperpolarizations classed into three separate groups formed from decreasing amplitudes. These three groups had comparable number of samples (respectively 12, 12 and 13 in G1, G2 and G3) and showed very significant differences using the Kruskal-Wallis test (Fig. 6 A). It was therefore corroborated that low values of HBD + HBA and PSA characterize phenolics inducing greater potential variations (Fig. 6 B and C). None of the other descriptors showed significant differences between the three groups (Fig. 6 D-K).
Discussion
Metabolic efficiency of an exobiont and its capacity to cross membranes
To be metabolically active in terms of affecting cell function, an exobiont has to cross through membranes. This process may be affected by different mechanisms, e.g. simple diffusion or active transport mechanisms. In plants, predictive models have been proposed, concerning in particular pesticide absorption by Bromilow and Chamberlain (Bromilow &Chamberlain 1988) and Kleier et al. (Kleier et al. 1998), by taking into account two physical properties of the compounds, namely their pKa and octanol/water partition coefficient. This problem has been considerably addressed in human disease treatments. Indeed, early prediction of drug absorption is of considerable importance in drug development and particularly for screening large sets of compounds. Two key determinants of intestinal drug absorption are the
dissolution rate of the active ingredient in gastrointestinal fluids and passage across the gut wall. In the latter case, a large number of forecasting models have been developed to evaluate the potential of drugs to cross the intestinal barrier, most of them being based on a number of physicochemical descriptors. The most popular interpretation remains the Lipinski’s ‟rule of five” which is a rule of thumb to determine if a chemical compound with certain
pharmacological or biological activity has properties that would make it a likely orally active
1 2 3 4 5 6 7 8 9 10 11 12 13 14 15 16 17 18 19 20 21 22 23 24 25 26 27 28 29 30 31 32 33 34 35 36 37 38 39 40 41 42 43 44 45 46 47 48 49 50 51 52 53 54 55 56 57 58 59 60
drug in humans. The rule states that an orally active drug has no more than one violation of the following criteria: i/ no more than 5 hydrogen bond donors; ii/ no more than 10 hydrogen bond acceptors; iii/ a molecular mass less than 500 Daltons and finally, iv/ an octanol-water partition coefficient log P not greater than 5 (Lipinski et al. 1997). This rule has been subsequently completed or amended by many authors to try to improve prediction models (Bergstrom et al. 2014, Bhal et al. 2007, Deconinck et al. 2007, Gozalbes et al. 2011, Kim et al. 2014, Kujawski et al. 2012, Palm et al. 1997, Talevi et al. 2011, van de Waterbeemd et al. 2003, Veber et al. 2002, Winiwarter et al. 2003, Winiwarter et al. 1998). To our knowledge, this approach was never or rarely developed in plant physiology to evaluate the capacity of a chemical to passively cross the plasma membrane. Concerning the phenolics considered in this work, it should be stressed that none of the studied compounds violated Lipinski’s rules.
Application to phenolics
Therefore, this strategy was applied in this work to evaluate the impact of ten descriptors of a series of BA derivatives on three physiological processes of gradual complexity, namely membrane potential, proton flux modification and the osmocontractile reaction of leaf pulvini of M. pudica.
As shown previously, these three processes are strongly correlated. Indeed, except some particular cases (namely, aspirin and 2,4-dichlorobenzoic acid), the higher the induced hyperpolarization, the higher the proton influx and the higher the inhibition of the osmocontractile reaction (Rocher et al. 2014). Furthermore, we have also previously
emphasized that the hyperpolarization was the earliest event occurring in less than 1 min and lasting approximately 15 min after application of the phenolics. This indicates that ionic species were rapidly mobilized. However, the involved ionic species are unlikely those involved in the depolarization observed following seismonastic or wound-induced
stimulations, namely Ca2+, Cl- and K+ (Felle &Zimmermann 2007, Fromm &Lautner 2007,
Katicheva et al. 2014, Sukhov et al. 2013). The hyperpolarization may result either from the exit of a positive charge or the entry of a negative charge. H+ would unlikely be involved in
the first phase as indicated by the observed apoplastic alkalinization monitored only 15 min after application of the phenolics, in coincidence with the beginning of the repolarization. This suggests consequently that proton mobilization may intervene in this later phase. Furthermore, by considering the differential effect of phenolics (either stimulatory or inhibitory) on the H+-ATPase activity observed on the plasma membrane vesicles purified
from pulvinar tissues, it is unlikely that this enzyme may play a general role in this process.
1 2 3 4 5 6 7 8 9 10 11 12 13 14 15 16 17 18 19 20 21 22 23 24 25 26 27 28 29 30 31 32 33 34 35 36 37 38 39 40 41 42 43 44 45 46 47 48 49 50 51 52 53 54 55 56 57 58 59 60
Lastly, it should be stressed that the effects of the active phenolics look like those of
protonophores allowing H+ entry (Saeedi et al. 2013) and K+ conductance increase (Levitan
&Barker 1972). It is therefore suggested that K+ may play the major role, on account of the
previous remarks and of the rapid inhibition of the contractile reaction in which this ion occupies a pivotal role (Moran 2007); and reference therein). A study on the activated channels would solve the question.
We have previously shown that, regarding plant cell biology (Rocher et al. 2014) as well as antifungal activity (Amborabé et al. 2002), efficiency of the assayed phenolics is correlated with particular molecular arrangements. Furthermore, modifications observed in these processes result from multimodal action. This was particularly evidenced by the comparative effect of different phenolics on the plasma membrane H+-ATPase, a pivotal enzyme in plant
membrane function. Indeed, some compounds may inhibit both components of this enzyme’s activity (proton pumping and catalytic activity), while others may present a strong
protonophore effect or have no effect on this processes. In addition, we emphasized that the multimodal action of BA derivatives cannot simply be explained by the ion trapping
mechanism which is currently used to explain the mode of uptake of this type of compound (Rocher et al. 2014).
This raises questions regarding other possible mechanisms of transmembrane transport. As shown previously, the transport of such polar compounds may be performed by two means, either carrier-driven or a diffusion mechanism (Rocher et al. 2009). In the latter case, the degree of dissociation and correlatively liposolubility is of great importance. But, as
emphasized, these two parameters cannot satisfactorily explain by themselves the differences in efficiency noted between the various compounds.
Relative importance of the descriptors in the observed biological reactions
From the data in the present work, we concluded that the number of chemical descriptors involved increased as the biological process became more complex. Indeed, taking into
account the VIP and standardized coefficient diagrams from the PLS regression, we noted that six descriptorswere implicated in the osmocontractile reaction, whereas five were implicated in proton flux mobilization and only two were implicated in membrane potential variation. This remark is corroborated by the analysis of different groups. These observations suggest that, instead of H+ flux and a correlative effect on the osmocontractile reaction,
modification does not require entry of the compound into the intracellular compartment. This is logical since membrane potential variations resulting from the modification of ionic fluxes
1 2 3 4 5 6 7 8 9 10 11 12 13 14 15 16 17 18 19 20 21 22 23 24 25 26 27 28 29 30 31 32 33 34 35 36 37 38 39 40 41 42 43 44 45 46 47 48 49 50 51 52 53 54 55 56 57 58 59 60
linked to a change in the activity of ion channels located on the plasma membrane results, therefore, merely from a surface membrane interaction. This remark is sustained by the very low correlation coefficient noted (28%). In contrast, the high correlation coefficients noted concerning H+ fluxes (48%) and the osmocontractile reaction (58%) suggest that entry of the
compound into the intracellular compartment in a diffusive way is essential.
Our data also emphasized the predominant effect of HBD+HBA, PSA (even on and also FRB in some cases, which intervene in the processes as shown in the VIP diagrams.
Furthermore, the standardized diagrams show that these three descriptors present a negative action on these biological processes. Therefore, in the scope of elaboration of active
antimicrobial products, these three descriptors must be as low as possible. Inversely, they must present high MV, logD, MR and UF.
It is of particular interest that descriptors which influence the studied biological processes through their impact on intracellular transport are the same that those noted in medical studies related to absorption through the gastrointestinal tract or Caco-2 cells (Lipinski et al. 1997, Palm et al. 1997, Veber et al. 2002, Winiwarter et al. 2003).
Particular positioning of salicylic acid in the predictive models
We have emphasized in a previous related study that among the variety of phenolics
considered, SA is distinguished because of its powerful action on biological processes. This particular effect of SA is sustained in the present analysis conducted with a different approach by its behavior as an outlier (see Fig. 1C and Fig. 3C). This observation strongly suggests that SA acts through specific mechanisms compared to other BA-related derivatives. In particular, several studies have demonstrated that SA acts as a molecular signal through the activation of a variety of genes (Vlot et al. 2009). The specificity of gene expression following SA
treatment should be questioned in further work to tentatively explain this exhaustive activity of SA compared to other BA-related derivatives.
Acknowledgments
The authors would like to thank Dr Gilles Le Pape (AnaStats Scop ARL) for his valuable advice on statistical analysis.
References
Abe T (1981): Chloride-ion efflux during an action potential in the main pulvinus of
Mimosa pudica. Bot. Mag. Tokyo 94, 379-383
1 2 3 4 5 6 7 8 9 10 11 12 13 14 15 16 17 18 19 20 21 22 23 24 25 26 27 28 29 30 31 32 33 34 35 36 37 38 39 40 41 42 43 44 45 46 47 48 49 50 51 52 53 54 55 56 57 58 59 60
Amborabé BE, Fleurat-Lessard P, Chollet JF, Roblin G (2002): Antifungal effects of salicylic acid and other benzoic acid derivatives towards Eutypa lata: structure-activity relationship. Plant Physiol. Biochem. 40, 1051-1060
Amborabé BE, Bonmort J, Fleurat-Lessard P, Roblin G (2008): Early events induced by chitosan on plant cells. J. Exp. Bot. 59, 2317-2324
Bergstrom CA, Holm R, Jorgensen SA, Andersson SB, Artursson P, Beato S, Borde A, Box K, Brewster M, Dressman J, Feng KI, Halbert G, Kostewicz E, McAllister M, Muenster U, Thinnes J, Taylor R, Mullertz A (2014): Early pharmaceutical profiling to predict oral drug absorption: current status and unmet needs. Eur. J. Pharm. Sci. 57, 173-99
Bhal SK, Kassam K, Peirson IG, Pearl GM (2007): The rule of five revisited: Applying log D in place of log p in drug-likeness filters. Mol. Pharm. 4, 556-560
Bonnemain J-L, Chollet J-F, Rocher F (2013): Transport of salicylic acid and related compounds. In: Hayat S, Ahmad A , Alyemini M-N (Editors), Salicylic Acid, Plant Growth and Development. Springer, Dordrecht, The Netherlands, pp. 43-59
Bromilow RH, Chamberlain K (1988): Designing molecules for systemicity. Monograph - British Plant Growth Regulator Group, 113-128
Cheynier V, Comte G, Davies KM, Lattanzio V, Martens S (2013): Plant phenolics: Recent advances on their biosynthesis, genetics, and ecophysiology. Plant Physiol. Biochem. 72, 1-20
Chollet JF, Rocher F, Jousse C, Deletage-Grandon C, Bashiardes G, Bonnemain JL (2004): Synthesis and phloem mobility of acidic derivatives of the fungicide fenpiclonil. Pest Manage. Sci. 60, 1063-72
Chollet JF, Rocher F, Jousse C, Deletage-Grandon C, Bashiardes G, Bonnemain JL (2005): Acidic derivatives of the fungicide fenpiclonil: effect of adding a methyl group to the N-substituted chain on systemicity and fungicidal activity. Pest Manag. Sci. 61, 377-382
Chong IG, Jun CH (2005): Performance of some variable selection methods when multicollinearity is present. Chemometrics Intellig. Lab. Syst. 78, 103-112
Deconinck E, Coomans D, Vander Heyden Y (2007): Exploration of linear modelling techniques and their combination with multivariate adaptive regression splines to predict gastro-intestinal absorption of drugs. J. Pharm. Biomed. Anal. 43, 119-30
Dédaldéchamp F, Saeedi S, Fleurat-Lessard P, Roblin G (2014): Uptake and metabolic effects of salicylic acid on the pulvinar motor cells of Mimosa pudica L. Plant Physiol. Biochem. 74, 125-132
Dieryckx C, Gaudin V, Dupuy JW, Bonneu M, Girard V, Job D (2015): Beyond plant defense: insights on the potential of salicylic and methylsalicylic acid to contain growth of the phytopathogen Botrytis cinerea. Front Plant Sci 6, 859
Ertl P, Rohde B, Selzer P (2000): Fast calculation of molecular polar surface area as a sum of fragment-based contributions and its application to the prediction of drug transport properties. J. Med. Chem. 43, 3714-7
Ertl P (2008): Polar Surface Area. In: Mannhold R (Editor), Molecular Drug Properties - Measurement and Prediction. Methods and Principles in Medicinal Chemistry Wiley-VCH Verlag GmbH & Co., Weinheim, pp. 111-126
Felle HH, Zimmermann MR (2007): Systemic signalling in barley through action potentials. Planta 226, 203-214
Fromm J, Lautner S (2007): Electrical signals and their physiological significance in plants. Plant Cell and Environment 30, 249-257
1 2 3 4 5 6 7 8 9 10 11 12 13 14 15 16 17 18 19 20 21 22 23 24 25 26 27 28 29 30 31 32 33 34 35 36 37 38 39 40 41 42 43 44 45 46 47 48 49 50 51 52 53 54 55 56 57 58 59 60
Gozalbes R, Jacewicz M, Annand R, Tsaioun K, Pineda-Lucena A (2011): QSAR-based permeability model for drug-like compounds. Bioorg. Med. Chem. 19, 2615-24 Harborne JB (1980): Plant phenolics. In: Bell A , Charlwood B (Editors), Encyclopedia of
Plant Physiology. New Series. Volume 8. Secondary plant products. Springer-Verlag, Berlin, Germany, pp. 329-402
Jeschke P (2004): The unique role of fluorine in the design of active ingredients for modern crop protection. ChemBioChem 5, 571-89
Kaihara S, Watanabe K, Takimoto A (1981): Flower-inducing effect of benzoic and salicylic acids in various strains of lemna paucicostata and lemna minor. Plant Cell Physiol. 22, 819-825
Katicheva L, Sukhov V, Akinchits E, Vodeneev V (2014): Ionic Nature of Burn-Induced Variation Potential in Wheat Leaves. Plant Cell Physiol. 55, 1511-1519
Kim MT, Sedykh A, Chakravarti SK, Saiakhov RD, Zhu H (2014): Critical evaluation of human oral bioavailability for pharmaceutical drugs by using various cheminformatics approaches. Pharm. Res. 31, 1002-14
Kleier DA (1988): Phloem mobility of xenobiotics: I. mathematical model unifying the weak acid and intermediate permeability theories. Plant Physiol. 86, 803-810 Kleier DA, Grayson BT, Hsu FC (1998): The phloem mobility of pesticides. Pestic. Outlook
9, 26-30
Krasavina MS (2007): Effect of salicylic acid on solute transport in plants. In: Hayat S, Ahmad A (Editors), Salicylic acid - A plant hormone. Springer AA, Dordrecht, The Netherlands, pp. 25-68
Kujawski J, Popielarska H, Myka A, Drabińska B, Bernard MK (2012): The log P Parameter as a Molecular Descriptor in the Computer-aided Drug Design–an Overview. Computational Methods in Science and Technology 18, 81-88
Levitan H, Barker JL (1972): Membrane permeability: cation selectivity reversibly altered by salicylate. Science 178, 63-4
Lipinski CA, Lombardo F, Dominy BW, Feeney PJ (1997): Experimental and computational approaches to estimate solubility and permeability in drug discovery and development settings. Adv. Drug Del. Rev. 23, 3-25
Moran N (2007): Osmoregulation of leaf motor cells. FEBS Lett. 581, 2337-47
Muscolo A, Panuccio MR, Sidari M (2001): The effect of phenols on respiratory enzymes in seed germination - Respiratory enzyme activities during germination of Pinus
laricio seeds treated with phenols extracted from different forest soils. Plant
Growth Regul. 35, 31-35
Oota Y (1975): Short-day flowering of Lemna gibba G3 induced by salicylic acid. Plant Cell Physiol. 16, 1131-1135
Padron JA, Carrasco R, Pellon RF (2002): Molecular descriptor based on a molar refractivity partition using Randic-type graph-theoretical invariant. J Pharm Pharm Sci 5, 258-66
Palermo G, Piraino P, Zucht H-D (2009): Performance of PLS regression coefficients in selecting variables for each response of a multivariate PLS for omics-type data. Advances and applications in bioinformatics and chemistry: AABC 2, 57-70
Palm K, Stenberg P, Luthman K, Artursson P (1997): Polar molecular surface properties predict the intestinal absorption of drugs in humans. Pharm. Res. 14, 568-71 Polygalova OO, Ponomareva AA (2010): Protonophores as inducers of
energy-dependent changes of ultrastructure of mitochondria in wheat root cells. Cell and Tissue Biology 4, 297-304 1 2 3 4 5 6 7 8 9 10 11 12 13 14 15 16 17 18 19 20 21 22 23 24 25 26 27 28 29 30 31 32 33 34 35 36 37 38 39 40 41 42 43 44 45 46 47 48 49 50 51 52 53 54 55 56 57 58 59 60
Raskin I, Turner IM, Melander WR (1989): Regulation of heat production in the inflorescences of an Arum lily by endogenous salicyclic acid. Proc. Natl. Acad. Sci. U. S. A. 86, 2214-2218
Rice EL (1984): Allelopathy. Academic Press, Orlando, 422 pp
Rigitano RLO, Bromilow RH, Briggs GG, Chamberlain K (1987): Phloem translocation of weak acids in Ricinus communis. Pestic. Sci. 19, 113-133
Rocher F, Chollet JF, Jousse C, Bonnemain JL (2006): Salicylic acid, an ambimobile molecule exhibiting a high ability to accumulate in the phloem. Plant Physiol. 141, 1684-1693
Rocher F, Chollet JF, Legros S, Jousse C, Lemoine R, Faucher M, Bush DR, Bonnemain JL (2009): Salicylic acid transport in Ricinus communis involves a pH-dependent carrier system in addition to diffusion. Plant Physiol. 150, 2081-2091
Rocher F, Dedaldechamp F, Saeedi S, Fleurat-Lessard P, Chollet JF, Roblin G (2014): Modifications of the chemical structure of phenolics differentially affect physiological activities in pulvinar cells of Mimosa pudica L. I. Multimode effect on early membrane events. Plant Physiol. Biochem. 84, 240-50
Romano P, Suzzi G (1985): Sensitivity of Saccharomyces cerevisiae vegetative cells and spores to antimicrobial compounds. J. Appl. Bacteriol. 59, 299-302
Saeedi S, Rocher F, Bonmort J, Fleurat-Lessard P, Roblin G (2013): Early membrane events induced by salicylic acid in motor cells of the Mimosa pudica pulvinus. J. Exp. Bot. 64, 1829-1836
Stenlid G, Saddik K (1962): Effect of some growth regulators and uncoupling agents upon oxidative phosphorylation in mitochondria of cucumber hypocotyls. Physiol. Plant. 15, 369-379
Sukhov V, Akinchits E, Katicheva L, Vodeneev V (2013): Simulation of Variation Potential in Higher Plant Cells. J. Membr. Biol. 246, 287-296
Talevi A, Goodarzi M, Ortiz EV, Duchowicz PR, Bellera CL, Pesce G, Castro EA, Bruno-Blanch LE (2011): Prediction of drug intestinal absorption by new linear and non-linear QSPR. Eur. J. Med. Chem. 46, 218-28
van de Waterbeemd H, Lennernas H, Arthurson P (Editors), 2003: Drug Bioavailability. Estimation of Solubility, Permeability Absorption and Bioavailability. Methods and Principles in Medicinal Chemistry, 18. Wiley-VCH, Weinheim, 580 pp
Veber DF, Johnson SR, Cheng HY, Smith BR, Ward KW, Kopple KD (2002): Molecular properties that influence the oral bioavailability of drug candidates. J. Med. Chem. 45, 2615-23
Vega FE, Dowd PF, McGuire MR, Jackson MA, Nelsen TC (1997): In vitro effects of secondary plant compounds on germination of blastospores of the entomopathogenic fungus Paecilomyces fumosoroseus (Deuteromycotina: Hyphomycetes). J. Invertebr. Pathol. 70, 209-213
Vlot AC, Dempsey DA, Klessig DF (2009): Salicylic acid, a multifaceted hormone to combat disease. Annu. Rev. Phytopathol. 47, 177-206
Volkov AG, Foster JC, Ashby TA, Walker RK, Johnson JA, Markin VS (2010): Mimosa pudica: Electrical and mechanical stimulation of plant movements. Plant Cell and Environment 33, 163-173
Weir TL, Park SW, Vivanco JM (2004): Biochemical and physiological mechanisms mediated by allelochemicals. Curr. Opin. Plant Biol. 7, 472-479
Winiwarter S, Bonham NM, Ax F, Hallberg A, Lennernas H, Karlen A (1998): Correlation of human jejunal permeability (in vivo) of drugs with experimentally and
1 2 3 4 5 6 7 8 9 10 11 12 13 14 15 16 17 18 19 20 21 22 23 24 25 26 27 28 29 30 31 32 33 34 35 36 37 38 39 40 41 42 43 44 45 46 47 48 49 50 51 52 53 54 55 56 57 58 59 60
theoretically derived parameters. A multivariate data analysis approach. J. Med. Chem. 41, 4939-49
Winiwarter S, Ax F, Lennernas H, Hallberg A, Pettersson C, Karlen A (2003): Hydrogen bonding descriptors in the prediction of human in vivo intestinal permeability. J. Mol. Graphics Model. 21, 273-87
Wold S, Sjostrom M, Eriksson L (2001): PLS-regression: a basic tool of chemometrics. Chemometrics Intellig. Lab. Syst. 58, 109-130
Figure legends
Fig. 1 Relationships between seismonasty inhibition and 10 calculated molecular
descriptors for the 43 compounds of the training set using PLS analysis. (A) VIP plot. HBD + HBA: Hydrogen bond donnors and acceptors; PSA: Polar Surface Area; Hal ratio: halogen ratio; FRB: Free Rotatable Bonds; LogD: Distribution coefficient; MV: Molecular Volume; MW: Molecular Weight; MR: Molar refractivity; UF: Undissociated Form; pKa: acid dissociation constant. (B) Standardized coefficients (95% confidence interval). (C) Correlations between observed and calculated seismonasty inhibition for the 43 compounds of the training set (black numbers). The 10 compounds of the validation set are represented by red numbers. (QSAR eq: Seismonasty Inhibition = 31.774 - 3.255*(HBD + HBA) - 0.314*PSA + 62.930*Hal ratio - 4.732*FRB + 4.279*LogD + 0.235*MV + 0.052*MW + 0.415*MR + 0.052*UD - 1.044*pKa)
Fig. 2 Analysis of the relationships between ten molecular descriptors of SA and its
analogs and the inhibition of seismonasty. (A) The tested products were ranked by decreasing inhibitory activity of seismonasty then divided into four equal groups G1, G2, G3, and G4. (B-K) Molecular descriptors are shown for each group (Median ± Interquartile range). Different letters (a, b, c, d) indicated significant differences between the groups at the 1% probability level by Kruskal-Wallis test. For abbreviations in ordinates, see Figure 1
Fig. 3 Relationships between the proton fluxes in the incubation medium and 10
calculated molecular descriptors for the 30 compounds of the training set using PLS analysis. (A) VIP plot; for abbreviations, see Figure 1. (B) Standardized coefficients (95% confidence interval). (C) Correlations between observed and calculated pH variations for the 30 compounds of the training set (black numbers). The 7 compounds of the validation set are represented by red numbers. (QSAR eq: ∆ pH [nmol H+] = -158.77 + 0.445*MW + 2.690*MV + 5.632*MR + 7.039*pKa + 43.215*LogD + 1.004*UD - 1.842*PSA - 18.441*HD+HA - 9.874*FRB + 271.541*Hal ratio)
Fig. 4 Analysis of the relationships between ten molecular descriptors of SA and its
analogs and the H+ excretion in the incubation medium (A) The tested products were ranked by decreasing activity on pH variation then divided into three equal groups G1, G2 and G3. (B-K) Molecular descriptors are shown for each group (Median ± Interquartile range). Different letters (a, b, c) indicated significant differences between the groups at the 1% probability level by Kruskal-Wallis test. For abbreviations in ordinates, see Figure 1
1 2 3 4 5 6 7 8 9 10 11 12 13 14 15 16 17 18 19 20 21 22 23 24 25 26 27 28 29 30 31 32 33 34 35 36 37 38 39 40 41 42 43 44 45 46 47 48 49 50 51 52 53 54 55 56 57 58 59 60
Fig. 5 Relationships between membrane potential variations and 10 calculated
molecular descriptors for the 30 compounds of the training set using PLS analysis. (A) VIP plot; for abbreviations, see Figure 1. (B) Standardized coefficients (95% confidence interval)
Fig. 6 Analysis of the relationships between ten molecular descriptors of SA and its
analogs and the membrane potential variation (A) The tested products were ranked by decreasing activity on membrane potential then divided into three equal groups G1, G2 and G3. (B-K) Molecular descriptors are shown for each group (Median ± Interquartile range). Different letters (a, b, c) indicated significant differences between the groups at the 1% probability level by Kruskal-Wallis test. For abbreviations in ordinates, see Figure 1
1 2 3 4 5 6 7 8 9 10 11 12 13 14 15 16 17 18 19 20 21 22 23 24 25 26 27 28 29 30 31 32 33 34 35 36 37 38 39 40 41 42 43 44 45 46 47 48 49 50 51 52 53 54 55 56 57 58 59 60
Table 1 Chemical descriptors and physicochemical properties of the studied compounds computed with ACD Log D
sol suite v. 12.01 software and experimental measurements of the biological activity on Mimosa pudica L.. MW: Molecular weight ; MV: Molar volume ; MR: Molar refractivity ; PSA: Polar Surface Area ; HBD: Hydrogen Bond Donnors ; HBA: Hydrogen Bond Acceptors ; FRB: Free Rotatable Bonds ; values of log D and % of neutral form are calculated at pH 5.2 ; UD: undissociated form ; SI: Seismonasty inhibition ; nmol H+: net proton influx (data from Rocher et al., 2014) ; ∆ψ: transmembrane potential (data from Rocher et al., 2014) ; Ts: Training set or Vs: Validation set for PLS analysis
N° Compound MW MV (cm3. mol-1) (cmMR 3) pKa PSA (Å2) HBD + HBA FRB Halogen ratio logD UD (%) SI (%) nmol H+ ∆ ψ (mV) Ts or Vs 1 Salicylic acid 138.12 100.39 35.06 3.01 57.53 5 2 0 -0.77 8.3 93 641 30 Vs 2 2,3-Dihydroxybenzoic acid 154.12 98.82 36.95 2.96 77.76 7 3 0 -1.27 2.3 15 222 16 Ts 3 2,4-Dihydroxybenzoic acid 154.12 98.82 36.95 3.32 77.76 7 3 0 -0.90 7.6 15 203 11 Vs 4 2,5-Dihydroxybenzoic acid 154.12 98.82 36.95 3.01 77.76 7 3 0 -1.45 1.8 -9 Vs 5 2,6-Dihydroxybenzoic acid 154.12 98.82 36.95 1.3 77.76 7 3 0 -0.77 0.1 3 78 8 Ts 6 2-Hydroxy-3-methoxybenzoic acid 168.15 124.4 41.74 2.85 66.76 6 3 0 -0.96 4.7 65 305 27 Vs 7 3-Chlorosalicylic acid 172.57 112.34 39.96 2.43 57.53 5 2 0.0909 -0.02 13.3 65 Ts 8 4-Chlorosalicylic acid 172.57 112.34 39.96 2.71 57.53 5 2 0.0909 0.14 23.1 87 Ts 9 5-Chlorosalicylic acid 172.57 112.34 39.96 2.64 57.53 5 2 0.0909 0.23 22.0 43 Ts 10 2,3,4-Trihydroxybenzoic acid 170.12 97.25 38.83 3.3 97.99 9 4 0 -1.47 2.0 2 -75 -2 Ts 11 2,4,6-Trihydroxybenzoic acid 170.12 97.25 38.83 1.62 97.99 9 4 0 -1.10 0.1 4 -150 12 Ts 12 3,5-Dichlorosalicylic acid 207.01 124.29 44.85 1.99 57.53 5 2 0.17 1.08 11.3 60 Ts 13 3,5,6-Trichlorosalicylic acid 241.46 136.24 49.75 1.5 57.53 5 2 0.23 1.42 2.5 40 Ts 14 2-Methoxybenzoic acid 152.15 125.97 39.86 4.09 46.53 4 2 0 0.16 61.4 38 483 24 Ts 15 Acetylsalicylic acid (Aspirin) 180.16 139.59 44.52 3.48 63.6 5 3 0 -0.31 32.9 87 -91 40 Ts 16 2-Acetyl benzoic acid 164.16 133.49 43.21 4.13 54.37 4 2 0 -0.29 38.8 22 266 23 Ts 17 2-Aminobenzoic acid 137.14 104.24 37.42 4.94 63.32 6 2 0 0.45 77.9 12 -37 14 Ts 18 2-Nitrobenzoic acid 167.12 113.8 39.73 2.19 83.12 6 2 0 -1.58 1.6 33 451 19 Ts 19 2-Fluorobenzoic acid 140.11 106.17 33.18 3.27 37.3 3 1 0.1 -0.38 28.4 30 83 18 Ts 20 2-Chlorobenzoic acid 156.57 113.91 38.08 2.97 37.3 3 1 0.1 -0.31 29.7 92 249 38 Ts 21 2-Bromobenzoic acid 201.02 118.15 40.87 2.85 37.3 3 1 0.1 0.19 52.6 75 413 26 Ts 22 2-Iodobenzoic acid 248.02 124.04 46.09 2.86 37.3 3 1 0.1 0.12 49.6 93 653 34 Ts 23 2,3-Dichlorobenzoic acid 191.01 125.86 42.97 2.53 37.3 3 1 0.18 0.22 46.9 92 Ts 24 2,4-Dichlorobenzoic acid 191.01 125.86 42.97 2.68 37.3 3 1 0.18 0.35 56.3 93 773 12 Ts 25 2,5-Dichlorobenzoic acid 191.01 125.86 42.97 2.51 37.3 3 1 0.18 0.27 48.4 92 Ts 26 2,6-Dichlorobenzoic acid 191.01 125.86 42.97 1.69 37.3 3 1 0.18 -0.82 4.1 62 86 1 Ts 27 2,3,5-Triiodobenzoic acid (TIBA) 499.81 168.18 71.9 2.16 37.3 3 1 0.25 1.87 55.7 100 893 38 Ts 28 Benzoic acid 122.12 101.96 33.18 4.2 37.3 3 1 0 0.52 78.5 17 343 23 Vs 29 m-Hydroxybenzoic acid 138.12 100.39 35.06 4.08 57.53 5 2 0 -0.03 50.4 -1 66 -8 Ts 30 p-Hydroxybenzoic acid 138.12 100.39 35.06 4.57 57.53 5 2 0 0.58 81.8 -3 193 -27 Ts 31 3-Methoxybenzoic acid 152.15 125.97 39.86 4.08 46.53 4 2 0 0.51 77.3 33 Ts 32 4-Methoxybenzoic acid 152.15 125.97 39.86 4.47 46.53 4 2 0 0.97 91.6 3 Ts 33 3-Chlorobenzoic acid 156.57 113.91 38.08 3.83 37.3 3 1 0.1 1.15 92.2 87 225 32 Ts 34 4-Chlorobenzoic acid 156.57 113.91 38.08 3.97 37.3 3 1 0.1 1.23 93.6 85 Ts 35 3,4-Dihydroxybenzoic acid 154.12 98.82 36.95 4.45 77.76 7 3 0 -0.03 52.8 -2 115 -11 Vs 36 3,5-Dihydroxybenzoic acid 154.12 98.82 36.95 3.96 77.76 7 3 0 -0.68 19.6 0 Ts 37 4-Hydroxy-3-methoxybenzoic acid 168.15 124.4 41.74 4.45 66.76 6 3 0 0.38 73.5 28 615 5 Ts 38 3-Hydroxy-4-methoxybenzoic acid 168.15 124.4 41.74 4.35 66.76 6 3 0 0.24 66.6 10 186 15 Ts 39 3,4-Dichlorobenzoic acid 191.01 125.86 42.97 3.6 37.3 3 1 0.18 1.79 95.7 70 Ts 40 3,5-Dichlorobenzoic acid 191.01 125.86 42.97 3.46 37.3 3 1 0.18 1.77 94.7 90 Ts 41 3,4,5-Trihydroxybenzoic acid 170.12 97.25 38.83 4.33 97.99 9 4 0 -0.73 20.1 12 -75 -2 Vs 42 salicylaldehyde 122.12 99.53 34.89 8.18 37.3 3 2 0 1.58 100.0 67 686 6 Vs 43 salicylamide 137.14 106.56 37.06 8.37 63.32 6 2 0 1.35 100.0 60 313 12 Ts 44 salicylhydroxamic acid 153.14 109.21 38.66 8.71 69.56 7 3 0 -0.02 100.0 30 473 28 Ts 45 Phenylacetic acid 136.15 116.88 37.37 4.3 37.3 3 2 0 0.39 74.2 78 603 32 Ts 46 Hydrocinnamic acid 150.17 133.38 42 4.65 37.3 3 3 0 0.45 79.4 52 643 28 Ts 47 4-Phenylbutyric acid 164.2 149.89 46.63 4.76 37.3 3 4 0 1.73 98.6 90 663 32 Ts 48 t-Cinnamic acid 148.16 125.03 43.71 4.34 37.3 3 2 0 0.30 70.4 53 634 26 Ts 49 2-Hydroxycinnamic acid 164.16 123.46 45.59 4.51 57.53 5 3 0 -0.10 48.5 31 602 4 Ts 50 3-Hydroxycinnamic acid 164.16 123.46 45.59 4.38 57.53 5 3 0 0.01 56.6 30 Vs 51 4-Hydroxycinnamic acid 164.16 123.46 45.59 4.65 57.53 5 3 0 0.06 58.6 28 Vs 52 3,4-Dihydroxycinnamic acid 180.16 121.89 47.47 4.58 77.76 7 4 0 -0.37 36.2 17 186 -9 Ts 53 4-Hydroxy-3-methoxycinnamic acid 194.18 147.47 52.27 4.58 66.76 6 4 0 -0.04 52.7 4 782 -8 Ts Table 1
-0.2 0 0.2 0.4 0.6 0.8 1.0 1.2 1.4 1.6 1.8 HBD+HBA PSA Hal ratio FRB LogD MV MW MR UF pKa VIP -0.25 -0.20 -0.15 -0.10 -0.05 0.00 0.05 0.10 0.15 0.20 HBD + HBA PSA Hal ratio FRB LogD MV MW MR UF pKa Standardized coefficients
A
B
C
2 5 7 8 9 10 11 12 13 14 15 16 17 18 19 20 21 22 23 24 25 26 27 29 30 31 32 33 34 36 37 38 39 40 43 44 45 46 47 48 49 52 53 y = x + 1E-13 R2 = 0.58 -20 0 20 40 60 80 100 -20 0 20 40 60 80 100 Seismonasty inhibition (%)Predicted seismonasty inhibition (%)
1 3 4 6 28 35 41 42 50 51
Fig. 1 Relationships between seismonasty inhibition and 10 calculated molecular
descriptors for the 43 compounds of the training set using PLS analysis. (A) VIP plot. HBD + HBA: Hydrogen bond donnors and acceptors ; PSA: Polar Surface Area ; Hal ratio: halogen ratio ; FRB: Free Rotatable Bonds ; LogD: Distribution coefficient ; MV: Molecular Volume ; MW: Molecular Weight ; MR: Molar refracti-vity ; UF: Undissociated Form ; pKa: acid dissociation constant. (B) Standardized coefficients (95% confidence interval). (C) Correlations between observed and
-20 0 20 40 60 80 100 G1 G2 G3 G4 Inhibition (%) 0 50 100 150 200 G1 G2 G3 G4 MW 0 50 100 150 G1 G2 G3 G4 MV (cm 3) 0 10 20 30 40 50 G1 G2 G3 G4 MR 0 1 2 3 4 5 G1 G2 G3 G4 pKa -1.0 -0.5 0 0.5 1.0 1.5 G1 G2 G3 G4 LogD 0 20 40 60 80 100 G1 G2 G3 G4 UF (%) 0 20 40 60 80 G1 G2 G3 G4 PSA (Å 2) 0 2 4 6 8 G1 G2 G3 G4 HBD + HBA 0 1 2 3 4 G1 G2 G3 G4 FRB 0 0.05 0.15 0.15 0.20 G1 G2 G3 G4 Hal ratio a a ab bc c a ab bc c c a ab bc c a a ab b b a a ab b a a a a a a a a a a a a a a a a a a a a d a a a a
A
B
C
D
E
F
G
H
I
J
K
Fig. 2 Analysis of the relationships between ten molecular descriptors of SA and its analogs and the inhibition of
seismonasty. (A) The tested products were ranked by decreasing inhibitory activity of seismonasty then divided into four equal groups G1, G2, G3, and G4. (B-K) Molecular descriptors are shown for each group (Median ± Inter-quartile range). Different letters (a, b, c, d) indicated significant differences between the groups at the 1% probabi-lity level by Kruskal-Wallis test. For abbreviations in ordinates, see Fig. 1
-0.20 -0.15 -0.10 -0.05 0.00 0.05 0.10 0.15 0.20 0.25 HBD+HBA PSA Hal ratio FRB LogD MV MW MR UF pKa Standardized coefficients -0.8 -0.6 -0.4 -0.2 0.0 0.2 0.4 0.6 0.8 1.0 1.2 1.4 1.6 1.8 2.0 HBD+HBA PSA Hal ratio FRB LogD MV MW MR UF pKa VIP
A
B
2 5 10 11 14 16 17 18 19 20 21 22 24 26 27 29 30 33 37 38 43 44 45 46 47 48 49 52 53 -200 0 200 400 600 800 1000 -200 0 200 400 600 800 1000 1 3 6 28 35 41 42 15 y = x - 2E-13 R2 = 0.48Proton influx (nmol H
+)
Predicted proton influx (nmol H+)
C
Fig. 3 Relationships between the proton fluxes in the incubation medium
and 10 calculated molecular descriptors for the 30 compounds of the training set using PLS analysis. (A) VIP plot ; for abbreviations, see Figure 1. (B) Standardized coefficients (95% confidence interval). (C) Correlations between observed and calculated pH variations for the 30 compounds of the training set (black numbers). The 7 compounds of the validation set are
+] = -158.77 +
0.445*MW + 2.690*MV + 5.632*MR + 7.039*pKa + 43.215*LogD + 1.004*UD - 1.842*PSA - 18.441*HD+HA - 9.874*FRB + 271.541*Hal ratio)
-100 0 100 200 300 400 500 600 700 G1 G2 G3 pH (nmol H +) 0 50 100 150 200 G1 G2 G3 MW 0 50 100 150 G1 G2 G3 MV (cm 3) 0 10 20 30 40 50 G1 G2 G3 MR 0 1 2 3 4 5 G1 G2 G3 pKa -1.0 -0.5 0.0 0.5 1.0 G1 G2 G3 LogD 0 20 40 60 80 100 G1 G2 G3 UF (%) 0 20 40 60 80 G1 G2 G3 PSA (Å 2) 0 2 4 6 8 G1 G2 G3 HBD + HBA 0 1 2 3 4 G1 G2 G3 FRB 0 0.01 0.02 0.03 G1 G2 G3 Hal ratio
A
B
C
D
E
F
G
H
I
J
K
a c b a ab b a ab b a ab b a ab b a a a a a a a a a a a a a a a a a aFig. 4 Analysis of the relationships between ten molecular descriptors of SA and its analogs and the H+ excretion
in the incubation medium (A) The tested products were ranked by decreasing activity on pH variation then divided into three equal groups G1, G2 and G3. (B-K) Molecular descriptors are shown for each group (Median ± Inter-quartile range). Different letters (a, b, c) indicated significant differences between the groups at the 1% probability level by Kruskal-Wallis test. For abbreviations in ordinates, see Fig. 1
-0.8 -0.6 -0.4 -0.2 0.0 0.2 0.4 0.6 0.8 1.0 1.2 1.4 1.6 1.8 2.0 2.2 2.4 HBD+HBA PSA Hal ratio FRB LogD MV MW MR UF pKa VIP -0.20 -0.15 -0.10 -0.05 0.00 0.05 0.10 0.15 0.20 HBD+HBA PSA Hal ratio FRB LogD MV MW MR UF pKa Standardized coefficients
A
B
Fig. 5 Relationships between membrane potential variations and 10 calculated
molecular descriptors for the 30 compounds of the training set using PLS analy-sis. (A) VIP plot ; for abbreviations, see Figure 1. (B) Standardized coefficients (95% confidence interval)
0 50 100 150 200 G1 G2 G3 MW 0 10 20 30 40 G1 G2 G3 0 50 100 150 G1 G2 G3 3 0 10 20 30 40 50 G1 G2 G3 MR 0 1 2 3 4 5 G1 G2 G3 pKa -1.0 -0.5 0.0 0.5 1.0 G1 G2 G3 LogD 0 20 40 60 80 100 G1 G2 G3 0 20 40 60 80 G1 G2 G3 PSA 2 0 2 4 6 8 G1 G2 G3 HBD + HBA 0 1 2 3 4 G1 G2 G3 FRB 0 0.5 1 G1 G2 G3 Hal ratio
A
B
C
D
E
F
G
H
I
J
K
a c b a ab b a ab b a a a a a a a a a a a a a a a a a a a a a a a aFig. 6 Analysis of the relationships between ten molecular descriptors of SA and its analogs and the membrane
potential variation The tested products were ranked by decreasing activity on membrane potential then divided into three equal groups G1, G2 and G3. Molecular descriptors are shown for each group (Median ± Inter-quartile range). Different letters (a, b, c) indicated significant differences between the groups at the 1% probability level by Kruskal-Wallis test. For abbreviations in ordinates, see Fig. 1