HAL Id: hal-00296941
https://hal.archives-ouvertes.fr/hal-00296941
Submitted on 14 Feb 2006
HAL is a multi-disciplinary open access
archive for the deposit and dissemination of
sci-entific research documents, whether they are
pub-lished or not. The documents may come from
teaching and research institutions in France or
abroad, or from public or private research centers.
L’archive ouverte pluridisciplinaire HAL, est
destinée au dépôt et à la diffusion de documents
scientifiques de niveau recherche, publiés ou non,
émanant des établissements d’enseignement et de
recherche français ou étrangers, des laboratoires
publics ou privés.
From inferential statistics to climate knowledge
A. de H. N. Maia, H. Meinke
To cite this version:
A. de H. N. Maia, H. Meinke. From inferential statistics to climate knowledge. Advances in
Geo-sciences, European Geosciences Union, 2006, 6, pp.211-216. �hal-00296941�
Advances in Geosciences, 6, 211–216, 2006 SRef-ID: 1680-7359/adgeo/2006-6-211 European Geosciences Union
© 2006 Author(s). This work is licensed under a Creative Commons License.
Advances in
Geosciences
From inferential statistics to climate knowledge
A. de H. N. Maia1and H. Meinke2
1Embrapa Meio Ambiente, PO Box 69, Jaguari´una, SP, Brazil
2Queensland Department of Primary Industries and Fisheries, Emerging Technologies, PO Box 102, Toowoomba, Qld 4350,
Australia
Received: 25 August 2005 – Revised: 31 January 2006 – Accepted: 1 February 2006 – Published: 14 February 2006
Abstract. Climate variability and change are risk factors for climate sensitive activities such as agriculture. Managing these risks requires “climate knowledge”, i.e. a sound un-derstanding of causes and consequences of climate variabil-ity and knowledge of potential management options that are suitable in light of the climatic risks posed. Often such infor-mation about prognostic variables (e.g. yield, rainfall, run-off) is provided in probabilistic terms (e.g. via cumulative distribution functions, CDF), whereby the quantitative as-sessments of these alternative management options is based on such CDFs. Sound statistical approaches are needed in order to assess whether difference between such CDFs are intrinsic features of systems dynamics or chance events (i.e. quantifying evidences against an appropriate null hypothe-sis). Statistical procedures that rely on such a hypothesis testing framework are referred to as “inferential statistics” in contrast to descriptive statistics (e.g. mean, median, vari-ance of population samples, skill scores). Here we report on the extension of some of the existing inferential techniques that provides more relevant and adequate information for de-cision making under uncertainty.
1 Introduction
Climate impacts are of increasing concern to societies, par-ticularly in regions with high climatic variability such as South America, Southern Africa, Australia and Asia. The growing awareness of climate variability and change has trig-gered a myriad of climate-related activities that aim to bring scientists and stakeholders together in the hope that such cli-mate knowledge might reduce clicli-mate-related vulnerabilities (Glantz, 2005; Meinke and Stone, 2005). Realising this as-piration is based on two assumptions: Firstly, it requires the ability to precisely define “climate knowledge”; secondly it assumes that vulnerability is strongly related to the exposure
Correspondence to: A. de H. N. Maia
to risk1. We argue that it is rare that these assumptions are ac-tually met and suggest that the better use of statistical tools, such as hypothesis testing and methods for assessing fore-cast uncertainty, would make a useful contribution to better understand how to manage against the background of climate variability and change.
Here we define climate knowledge as the intelligent use of climate information. This includes knowledge about climate variability, climate change and climate forecasting used such that it enhances resilience by increasing profits and reducing economic/environmental risks. How can such climate knowl-edge be created and what does it entail? Meinke et al. (2006) suggest three important steps to create climate knowledge:
– understanding climate variability (physical measure of variability)
– understanding production variability (bio-physical mea-sure of climate impact)
– understanding vulnerability (e.g. income variability, an economic measure of vulnerability)
These three steps cover a lot of scientific ground. It en-compasses everything from basic climate science, physics, mathematics and statistics to biology, economics, computer modelling and social sciences. It is this multi-disciplinarity that makes climate applications work so challenging and at times intractable. It also makes it extremely rewarding when the right mix of skills and people achieves breakthroughs that would be unlikely within the confines of a specific discipline. Each of these steps requires the ability to establish causality. Users of climate information and climate forecasts need to be able to quantify the likelihood of a particular outcome aris-ing by chance (i.e. attribution of cause and effect) and this
1Vulnerability depends on both exposure to climate risk, and
the inherent capacity of individuals, businesses or communities to cope with it. Although agricultural systems science provides some insights into the exposure of production systems to climate variabil-ity, it provides few insights into the capacity of rural communities to cope with it.
212 A. de H. N. Maia and H. Meinke: From inferential statistics to climate knowledge is where statistical inferential procedures become important.
Such attribution will then allow informed judgements of the course of action that should be taken.
Here we aim to make one additional, small contribution to-wards the better understanding of climate variability and it’s predictability. We show how inferential statistical methods can improve and simplify the evaluation of “quality” of fore-cast systems and in doing so, provide an object framework to assess alternative methods and data sources (Potgieter et al., 2003; Maia et al., 2006).
2 Inferential statistics and forecast quality assessments 2.1 General
Climate forecast systems are mathematical representations of relationships between climate predictors and prognostic vari-ables of interest (e.g. rainfall, yield, run-off). In order to sess if a given climate predictor “significantly” explains as-pects of the observed variability of some prognostic variable, statistical tests are usually applied. Statistical approaches that can be applied differ widely depending on the nature of climate factors used as predictors in the forecast system. For example, regression models are adequate to account for in-fluence of climate predictors represented by continuous vari-ables such as climate indexes2 while statistical procedures for comparing CDFs are useful for assessing contribution of categorical predictors (classes) derived from climatic indexes in explaining the variability of the prognostic variable. In both situations, statistical methods are used to quantify the likelihood that the observed influence of the climate predic-tors could arise by chance. Such methods are referred to as “inferential procedures”.
Probabilistic information is the foundation of responsible climate forecasting (WMO, 2005). Often such information is provided via cumulative distribution functions (CDFs) of prognostic variables. In this paper, we focused on proba-bilistic forecast systems based on an analogue year approach (AYA), but usefulness and relevance of inferential procedures can be extended to evaluate other probabilistic forecast sys-tems.
Accordingly to the AYA, historical climate records (time series of prognostic variables) are partitioned into “year- or season-types”, resulting in phases or classes of analogue years. Forecasts about prognostic variables of interest (e.g. rainfall, yield) are thus obtained using the CDF correspond-ing to the class or phase derived form current patterns of the adopted climate index. Climate information summarised into CDFs can be used in order to assess the probabilistic perfor-mance of systems influenced by climate variables. The AYA is an easy and convenient way of connecting climate fore-casts with biological models that require historical weather records (Meinke and Stone, 2005).
2For example, indexes derived from anomalies of ocean and/or
atmospheric conditions such as sea surface temperatures (SST) or mean sea level pressure.
CDFs that represent whole time series of the prognostic variable are referred to as unconditional CDF or “climatol-ogy”; CDFs corresponding to each class are called condi-tional CDFs or class CDFs.
Probabilistic forecast systems based on patterns of cli-matic phenomena such as Southern Oscilation (5-phase SOI Forecast System, Stone et al., 1996) or El Ni˜no/Southern Os-cillation (3-class ENSO Forecast System, Hill et al., 2000; Potgieter et al., 2005) are examples of AYA forecast sys-tems. SOI and ENSO forecast systems are used opera-tionally in many countries (e.g. Australia, India and Southern Africa), providing valuable information for decision makers (e.g. Messina et al., 1999; Meinke and Hochman, 2000; Nel-son et al., 2002; Podest´a et al., 2002).
The quality of an AYA forecast system is intrinsically re-lated to the degree of divergence among CDFs that represent the past observations of the prognostic variable belonging to each class (conditional CDFs). The degree of divergence among conditional CDFs is also referred to as the forecast system’s discriminatory ability (Stone et al., 2000). Dis-criminatory ability is also related to other quality measure, such as the skill scores. These scores quantify changes in the agreement between observed and predicted values (accuracy) when using a specific forecast system instead of a forecast system based on some reference systems, usually “climatol-ogy” (Mason, 2004). Skill measures therefore account for changes in accuracy, relative to using climatology (Murphy, 1993; Potgieter et al., 2003).
Discriminatory ability and skill of a forecast system can show high variability across time and space (Maia et al., 2004) due the timing of climate phenomena accounted by prognostic variables and heterogeneous degree of influence of such phenomena over a geographic region.
Discriminatory ability can be quantified by simple de-scriptive measures such as: a) maximum difference between conditional and unconditional means; b) maximum differ-ence between conditional and unconditional quantiles (e.g. medians) or c) maximum vertical distance between condi-tional and uncondicondi-tional CDFs. Such descriptive measures tell us how much the statistic of interest (e.g. mean, median) changes due the FS class information. This has lead to efforts by the climate science community to document the “skill” of forecast systems. Commonly this is done via complex de-scriptive measures (skill scores) that account for changes in the forecast system accuracy due the incorporation of classes, but usually without any uncertainty assessment.
These descriptive approaches provide no information re-garding the “likelihood” of observed divergences among class CDFs arising by chance. The use of descriptive mea-sures without any inferential analysis, can at best lead to misguided beliefs about the true performance of the forecast systems (e.g. due to the possible existence of artificial or per-ceived skill), at worst result in inappropriate action by the de-cision maker, with potentially disastrous consequences. The latter would constitute a degeneration of risk management performance, rather than an improvement, and could poten-tially discredit a vast amount of high quality climate and
A. de H. N. Maia and H. Meinke: From inferential statistics to climate knowledge 213 climate applications research (Maia et al., 2006). Therefore,
climate forecasts and their derivative products (e.g. produc-tion or impact forecasts) require inferential AND descriptive quality assessments before deciding whether or not to take action based on such information.
2.2 Parametric versus non-parametric methods
Although some parametric approaches now cater for a wide range of distribution types (e.g. Tweedie distributions, which include the Normal, gamma, and Poisson distributions as special cases and more; Tweedie, 1984; Jˆorgensen, 1987), spatial assessments of forecast quality still require case-by-case evaluation before parametric methods can be applied. We therefore focus on non-parametric methods (also re-ferred to as distribution-free statistical procedures), which do not suffer from such limitations. This class of pro-cedures includes both traditional non-parametric tests (e.g. Kolmogorov- Smirnov, Kruskal-Wallis) and computation-ally intensive methods based on non-parametric Monte Carlo techniques (e.g. bootstrapping and randomization tests).
Given the general availability of computers, empirical null distributions for testing statistical hypotheses can be con-structed via such Monte Carlo approaches for cases where no suitable traditional non-parametric tests are available. Those flexible distribution-free approaches are of particular importance for temporal-spatial assessments in climate sci-ence where data sources are varied, underlying distributions can come in many shapes and predictor/predictand relation-ships are often non-linear (Von Storch and Zwiers, 1999). We therefore argue strongly for the use of distribution-free approaches for assessing variability of forecast quality at-tributes across time and space.
2.3 P-values as forecast quality measures
Nominal significance levels, commonly referred to as p-values, are key elements of statistical hypothesis tests. P-value quantify the probability (range: 0 to 1) of obtaining a value from the test statistic3that is more extreme than actual value observed, given the null hypothesis is true. Thus, p-values derived from either parametric or non-parametric tests are measures of empirical evidence against a null-hypothesis: the smaller p-values, the higher evidence against the null hy-pothesis and vice-versa.
We caution against the use of any artificial cut-off levels (pre established significance levels) to determine whether or not statistical tests indicate sufficiently high evidence against the null hypothesis (or “no class effect”). Instead, we suggest to use nominal significance levels (p-values) and concur with Nicholls (2001), who questions the appropriateness of com-monly used significance levels, such as p<0.05 or p<0.01. These cut-offs are no more than a convention that reduce con-tinuous probabilistic information to a dichotomous response (Maia et al., 2006).
3Test statistic is a function of the observed data that summarizes
the information relevant for the hypothesis of interest.
In the context of AYA forecast quality assessments, null hypotheses of interest could be: (a) “no divergence among class CDfs”, (b) “no difference among class medians” or (c) “no difference among probability of exceeding uncondi-tional median”. The appropriateness of a particular statis-tical test to be employed depends on the hypothesis of in-terest. For example, the nonparametrical tests Kolmogorov-Smirnov (based on maximum vertical distance among CDFs) and Kruskal-Wallis (based on differences among class me-dians) are adequate for null hypotheses (a) and (b), respec-tively. Some special cases like testing hypothesis on skill scores require computationally intensive techniques that al-low construction of empirical null distributions used for com-puting p-values.
P-values take into account the length of the time series, the number of classes of the chosen forecast system and the intra-class variability. Further, given adequate spatial coverage, p-values can be mapped using interpolation methods, providing a powerful and intuitive means of communicating the spatial variability of forecast performance.
3 Data and methods
We used rainfall data from stations across Australia to demonstrate the utility and adequacy of p-values for the in-ferential evaluation of the 5-phase SOI forecast system. This serves as an example only. The method is generic and can be applied to any type of probabilistic forecast system based on categorical climate predictors that use information from historical data, be it real or simulated, as long as autocor-relation patterns are negligible (e.g. yearly series of rainfall, temperature, yield or income).
3.1 The 5-phase SOI Forecast System
The forecast system considered in the case studies presented in this paper was derived from patterns of the Southern Oscil-lation Index4(SOI), a measure of the large-scale fluctuations
in air pressure anomalies occurring between the western and eastern tropical Pacific. This system allows historical climate records (“climatology”) to be partitioned into five phases or classes of analogue years, namely: negative, positive, falling, rising and neutral (“conditional climatologies”; Stone et al., 1996).
3.2 Rainfall data
We used data from 590 rainfall stations across Australia con-taining at least 50 and up to 116 years of continuous, daily rainfall records (80% of stations had more than 90 years of daily data). Time series of 3-monthly rainfall amounts of all stations were included to demonstrate how p-values can be
4Traditionally, this index has been calculated based on the
dif-ferences in air pressure anomaly between Tahiti and Darwin, Aus-tralia.
214 A. de H. N. Maia and H. Meinke: From inferential statistics to climate knowledge
associated with the observed score was thus calculated as the relative frequency of LEPS skill
scores that exceed observed LEPS_SS.
b) Spatial pattern of the SOI forecast system discriminatory ability over Australia
The Kruskal-Wallis (KW) non-parametric test (Conover, 1980) was performed in order to
quantify the evidences of the 5-phase SOI classification influence on JJA rainfall medians. The
p-values associated with this test are a direct measure of forecast system discriminatory
ability. Hence, we mapped the KW p-values in order to show spatial patterns of the SOI
forecast system discriminatory ability for JJA rainfall over Australia.
Results & Discussion
LEPS scores, like any other empirical measure, require uncertainty assessments in order to
adequately quantifying the evidence of forecast systems skill (Jolliffe, 2004). Beyond
assessing the skill magnitude as a point estimate (observed LEPS score), it is important for
users of forecast systems to know the probability of exceeding the observed skill score by
chance, in order to avoid making decisions based on ‘artificial’ or perceived skill. This
probability is used to assess the true class contribution for changes in accuracy, considering
the time series size (record length) and other sources of variability, not explained by the
current classification system (intra-class variability).
Using a randomization test, we calculated the p-value corresponding to observed LEPS score
This allow us to compare skill arising from different classification systems, regardless of
differences in record length and intra-class variability. It provides an objective way to
compare temporal variation in skill of forecast systems and to assess the spatial patterns of
forecast skill over a region. This is a generic approach that can be applied to any other skill
measures (e.g. ranked probability skill score, RPSS).
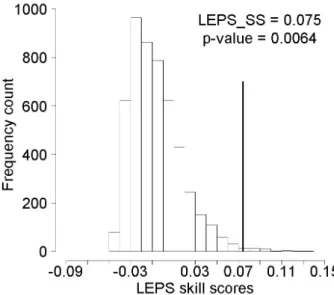
Figure 1. Empirical null distribution for tercile LEPS skill score arising from the SOI forecast
system for predicting JJA rainfall at Dalby (North-eastern Australia). The dark, thick line
indicates the location of the observed LEPS_SS value.
The relative location of the observed LEPS score (Fig. 1, dark, thick line) on the LEPS score
empirical null distribution indicates the degree of evidence against the hypothesis of ´no skill’,
that is ‘no change in the forecast system accuracy due class information. The higher the
observed LEPS score, the greater the empirical evidence of ‘true’ skill for the forecast system.
In our example, the p-value associated to the respective LEPS score (0.075) was 0.0064,
indicating high evidence of ´true´ skill of the 5-phase SOI forecast system for predicting JJA
Dalby rainfall.
The spatial pattern of discriminatory ability for the 5-phase SOI system based on KW p-values
was consistent with typical SOI impacts across Australia (Fig. 2). It shows strong impact of
Fig. 1. Empirical null distribution for tercile LEPS skill score aris-ing from the SOI forecast system for predictaris-ing JJA rainfall at Dalby (North-eastern Australia). The dark, thick line indicates the location of the observed LEPS SS value.
used for a spatial assessment of forecast quality. One sta-tion was chosen for a more in-depth analysis of the forecast system skill. Years were categorised into five analogue sets according to their similarity regarding oceanic and/or atmo-spheric conditions as measured by SOI phases just prior to the 3-months forecast period. Hence, the 590 JJA rainfall time series were segregated into five sub-series correspond-ing to each SOI class, resultcorrespond-ing in 2950 sub-series with vari-able record lengths.
3.3 Rainfall cumulative distribution functions
Rainfall time series were represented by their respective cu-mulative distribution functions (CDFs): a conditional CDF for each class and an unconditional CDF for “climatology”. Cumulative probabilities are widely used to represent prob-abilistic climate information arising from a time series that exhibit no or only weak serial auto-correlations (Maia et al. 2006). However, if the time series shows moderate to strong auto-correlation patterns, CDF summaries will result in some loss of information5. For such series, methods specifically tailored for time series analysis (Shumway, 1988; von Storch and Zwiers, 1999) would be required. However, most yearly sequences of rainfall data from a specific month or period ex-hibit only weak auto-correlation, thus allowing an adequate CDF representation to convey seasonal climate forecast in-formation (e.g. Selvaraju et al., 2004).
5Autocorrelations indicate that the value of the prognostic
vari-able in year n depends to some extent on the value in year n-k – in-formation that is lost when the data is summarized in CDFs. CDFs breaks any temporal dependency and hence do not account for au-tocorrelations patterns.
ENSO on winter rain for southern and Eastern Australia, with weaker and less consistent discriminatory ability for Western Australia (northern Australia is seasonally dry at this time of the year).
In this case study, rainfall series lengths were different at some locations. Thus, p-values were influenced by three diverse factors: series lengths, intra class rainfall variability and observed differences among medians.
Figure 2: Discriminatory ability of 5-phase SOI system for JJA rainfall across Australia, as
measured by Kruskal-Wallis p-values. This test accounts for differences among class medians. Non-parametrical tests for comparing conditional probability distributions (e.g. Kolmogorov-Smirnov, Log-Rank) rather than tests for comparing medians (as in our case study) could also be used to quantify discriminatory ability.
P-values can also be used to assess temporal variability of large scale climate phenomena influence (e.g. Southern Oscillation, ENSO) on prognostic variables over time, at a particular location. Assessments of Southern Oscillation influence on rainfall of 3-monthly running periods, using p-values, showed high temporal variability at three selected locations across Australia (Maia et al. 2006). Such temporal analyses objectively quantified the variable signal strength of a forecast system (in this case the SOI phase system) as the seasonal cycle progresses.
Conclusions
We have shown how an intuitively simple, but generic approach, based on inferential statistical methods, can be useful to objectively quantify some quality aspects of probabilistic forecast systems, namely, discriminatory ability and skill. Forecast quality measures based on nominal significance levels (p-values) derived from hypothesis testing frameworks can also provide the means to compare different probabilistic forecast systems according to objective quality criteria – a key issue to further improve risk management in climate-sensitive
agricultural systems. This constitutes a small but important step towards the much bigger goal of creating a comprehensive set of climate knowledge amongst managers of climate sensitive systems.
Fig. 2. Discriminatory ability of 5-phase SOI system for JJA rainfall across Australia, as measured by Kruskal-Wallis p-values. This test accounts for differences among class medians.
3.4 Inferential statistical methods
In this section, we describe statistical procedures applied to two case studies in order to demonstrate the usefulness of inferential approaches in the creation of “actionable climate knowledge”.
3.4.1 Assessing p-values associated to LEPS skill scores To demonstrate how Monte Carlo methods can be used to calculate nominal significance levels (p-values) associated to the skill scores, we quantified skill evidence of the SOI fore-cast system for predicting JJA rainfall at one location (Dalby; 1889–2003) using the LEPS skill score. LEPS score was chosen as an example for a widely used skill measure in cli-matological research (Potts et al., 1996). LEPS scores were calculated to quantify the accuracy of the SOI forecast sys-tem relative to the benchmark syssys-tem (climatology).
Hence, we calculated the LEPS score, (ranging from −1 to +1) based on categories defined by rainfall terciles for the ob-served Dalby JJA data set (obob-served LEPS SS) as outlined by Potts et al. (1996). Using randomisation techniques (Manly, 1981) we derived an empirical null distribution for that skill measure. This null distribution represents the set of possible score values under the hypothesis of “no SOI classification effect” for this dataset. The p-value associated with the ob-served score was thus calculated as the relative frequency of LEPS skill scores that exceed observed LEPS SS.
3.4.2 Spatial pattern of the SOI forecast system discrimi-natory ability over Australia
The Kruskal-Wallis (KW) non-parametric test (Conover, 1980) was performed in order to quantify the evidences of the 5-phase SOI classification influence on JJA rainfall medians.
A. de H. N. Maia and H. Meinke: From inferential statistics to climate knowledge 215 The p-values associated with this test are a direct measure
of forecast system discriminatory ability. Hence, we mapped the KW p-values in order to show spatial patterns of the SOI forecast system discriminatory ability for JJA rainfall over Australia.
4 Results and discussion
LEPS scores, like any other empirical measure, require un-certainty assessments in order to adequately quantifying the evidence of forecast systems skill (Jolliffe, 2004). Beyond assessing the skill magnitude as a point estimate (observed LEPS score), it is important for users of forecast systems to know the probability of exceeding the observed skill score by chance, in order to avoid making decisions based on “ar-tificial” or perceived skill. This probability is used to assess the true class contribution for changes in accuracy, consider-ing the time series size (record length) and other sources of variability, not explained by the current classification system (intra-class variability).
Using a randomization test, we calculated the p-value cor-responding to observed LEPS score This allow us to compare skill arising from different classification systems, regardless of differences in record length and intra-class variability. It provides an objective way to compare temporal variation in skill of forecast systems and to assess the spatial patterns of forecast skill over a region. This is a generic approach that can be applied to any other skill measures (e.g. ranked prob-ability skill score, RPSS).
The relative location of the observed LEPS score (Fig. 1, dark, thick line) on the LEPS score empirical null distribu-tion indicates the degree of evidence against the hypothesis of “no skill”, that is no change in the forecast system accu-racy due class information. The higher the observed LEPS score, the greater the empirical evidence of “true” skill for the forecast system. In our example, the p-value associated to the respective LEPS score (0.075) was 0.0064, indicating high evidence of “true” skill of the 5-phase SOI forecast sys-tem for predicting JJA Dalby rainfall.
The spatial pattern of discriminatory ability for the 5-phase SOI system based on KW p-values was consistent with typ-ical SOI impacts across Australia (Fig. 2). It shows strong impact of ENSO on winter rain for southern and Eastern Aus-tralia, with weaker and less consistent discriminatory ability for Western Australia (northern Australia is seasonally dry at this time of the year).
In this case study, rainfall series lengths were different at some locations. Thus, p-values were influenced by three di-verse factors: series lengths, intra class rainfall variability and observed differences among medians.
Non-parametrical tests for comparing conditional prob-ability distributions (e.g. Kolmogorov-Smirnov, Log-Rank) rather than tests for comparing medians (as in our case study) could also be used to quantify discriminatory ability.
P-values can also be used to assess temporal variability of large scale climate phenomena influence (e.g. Southern
Oscillation, ENSO) on prognostic variables over time, at a particular location. Assessments of Southern Oscillation in-fluence on rainfall of 3-monthly running periods, using p-values, showed high temporal variability at three selected lo-cations across Australia (Maia et al., 2006). Such temporal analyses objectively quantified the variable signal strength of a forecast system (in this case the SOI phase system) as the seasonal cycle progresses.
5 Conclusions
We have shown how an intuitively simple, but generic approach, based on inferential statistical methods, can be useful to objectively quantify some quality aspects of probabilistic forecast systems, namely, discriminatory ability and skill. Forecast quality measures based on nominal sig-nificance levels (p-values) derived from hypothesis testing frameworks can also provide the means to compare different probabilistic forecast systems according to objective quality criteria – a key issue to further improve risk management in climate-sensitive agricultural systems. This constitutes a small but important step towards the much bigger goal of creating a comprehensive set of climate knowledge amongst managers of climate sensitive systems.
Edited by: P. Fabian and J. L. Santos
Reviewed by: M. Rouault and another anonymous referee
References
Conover, W. J.: Practical Nonparametric Statistics, 3d ed. John Wi-ley & Sons, 584pp., 1980.
Glantz, M. H. (Ed.): Usable Science 9: El Ni˜no early warning for sustainable development in Pacific Rim countries and Islands, Report of workshop held 13–16 September 2004 in the Galapa-gos Islands, Ecuador, Boulder, CO, ISSE/NCAR, available at: http://www.ccb.ucar.edu/galapagos/report/, 2005.
Hill, S. J. H., Park, J., Mjelde, J. W., Rosenthal, W., Love, H. A., and Fuller, S. W.: Comparing the value of Southern Oscilla-tion Index-based climate forecast methods for Canadian and US wheat producers, Agric. Forest Met., 100, 261–272, 2000. Jolliffe, I. T.: Estimation of uncertainty in verification measures.
Proc. International Verification Methods Workshop, Montreal, Canada, available at: http://www.bom.gov.au/bmrc/wefor/staff/ eee/verif/Workshop2004/home.html, 2004.
Jˆorgensen, B.: Exponential dispersion models, J. Roy. Stat. Soc., Series B, 49, 127–162, 1987.
Maia, A. H. N., Meinke, H., Lennox, S., and Stone, R. C.: Infer-ential, non-parametric statistics to assess quality of probabilistic forecast systems, Mon. Wea. Rev., accepted subject to revision, 2006.
Maia, A. H. N., Meinke, H., and Lennox, S.: Assess-ment of probabilistic forecast ‘skill’ using p-values, Proc. 4th International Crop Science Congress, Brisbane, Australia, available at: http://www.cropscience.org.au/icsc2004/poster/2/6/ 1360 maiaa.htm, 2004.
Manly, B. F.: Randomization tests and Monte Carlo methods in biology, John Willey & Sons, 1981.
216 A. de H. N. Maia and H. Meinke: From inferential statistics to climate knowledge
Mason, S.: On using ‘climatology’ as a reference strategy in the Brier and ranked probability skill scores, Mon. Wea. Rev., 132, 1891–1895, 2004.
Meinke, H. and Hochman, Z.: Using seasonal climate forecasts to manage dryland crops in northern Australia, in: Applica-tions of Seasonal Climate Forecasting in Agricultural and Nat-ural Ecosystems – The Australian Experience, edited by: Ham-mer, G. L., Nicholls, N., and Mitchell, C., Kluwer Academic, The Netherlands, p. 149–165, 2000.
Meinke, H. and Stone, R. C.: Seasonal and inter-annual climate forecasting: the new tool for increasing preparedness to climate variability and change in agricultural planning and operations, Clim. Change, 70, 221–253, 2005.
Meinke, H., Nelson, R., Stone, R. C., Selvaraju, and Baethgen, W.: Actionable climate knowledge – from analysis to synthesis, Clim. Res., in press, 2006.
Messina, C. D., Hansen, J. W., and Hall, A. J.: Land allocation conditioned on ENSO phases in the Pampas of Argentina, Ag. Syst., 60, 197–212, 1999.
Murphy, A. H.: What is a good forecast? An essay on the nature of goodness in weather forecasting, Wea. Forecasting, 8, 281–293, 1993.
Nelson, R. A., Holzworth, D. P., Hammer, G. L., and Hayman, P. T.: Infusing the use of seasonal climate forecasting into crop man-agement practice in North East Australia using discussion sup-port software, Ag. Syst., 74, 393–414, 2002.
Nicholls, N.: The insignificance of significance testing, Bull. Amer. Meteorol. Soc., 82, 981–986, 2001.
Potgieter, A. B., Everingham, Y., and Hammer, G. L.: Measuring quality of a commodity forecasting from a system that incorpo-rates seasonal climate forecasts, Int. J. Remote Sens., 23, 1195– 1210, 2003.
Potgieter, A. B., Hammer, G. L., Meinke, H., Stone, R. C., and Goddard, L.: Three putative types of El Nino revealed by spatial variability in impact on Australian wheat yield, J. Climate, 18, 1566–1574, 2005.
Potts, J. M., Folland, C. K., Jolliffe, I. T., and Sexton, D.: Revised “LEPS” scores for assessing climate model simulations and long-range forecasts, J. Climate, 9, 34–53, 1996.
Podest´a, G., Letson, D., Messina, C., Rocye, F., Ferreyra, A., Jones, J., Llovet, I., Hansen, J., Grondona, M., and O’Brien, J.: Use of ENSO-related climate information in agricultural decision mak-ing in Argentina: a pilot experience, Ag. Syst., 74, 371–392, 2002.
Selvaraju, R., Meinke, H., and Hansen, J.: Climate in-formation contributes to better water management of irri-gated cropping systems in Southern India, Proc. 4th Inter-national Crop Science Congress, Brisbane, Australia, avail-able at: http://www.cropscience.org.au/icsc2004/poster/2/6/739 selvarajur.htm, 2004.
Shumway, H. R.: Applied statistical time series analysis, Prentice Hall, 379 pp., 1988
Stone, R. C., Hammer, G. L., and Marcussen, T.: Prediction of global rainfall probabilities using phases of the Southern Oscil-lation Index, Nature, 384, 252–255, 1996.
Storch, H. V. and Zwiers, F. W.: Statistical Analysis in Climate Research, Cambridge University Press, 484 pp., 1999.
Tweedie, M. C. K.: An index which distinguishes between some important exponential families, in: Statistics Applications and New Directions, Proc. of the Indian Statistical Institute Golden Jubilee International Conference, Indian Statistical Institute, Cal-cutta, edited by: Ghosh, J. K. and Roy, J., 579–604, 1984. WMO: Proceedings of the meeting of the CCA OPAG3 expert
team on verification, available at: http://www.wmo.ch/web/wcp/ clips2001/html/Report ETVerification 080205 2.pdf, 2005.