HAL Id: hal-00329247
https://hal.archives-ouvertes.fr/hal-00329247
Submitted on 1 Jan 2003
HAL is a multi-disciplinary open access
archive for the deposit and dissemination of
sci-entific research documents, whether they are
pub-lished or not. The documents may come from
teaching and research institutions in France or
abroad, or from public or private research centers.
L’archive ouverte pluridisciplinaire HAL, est
destinée au dépôt et à la diffusion de documents
scientifiques de niveau recherche, publiés ou non,
émanant des établissements d’enseignement et de
recherche français ou étrangers, des laboratoires
publics ou privés.
S. Lepidi, L. Cafarella, P. Francia, A. Meloni, P. Palangio, et al.. Low frequency geomagnetic field
variations at Dome C (Antarctica). Annales Geophysicae, European Geosciences Union, 2003, 21 (4),
pp.923-932. �hal-00329247�
Annales Geophysicae (2003) 21: 923–932 c European Geosciences Union 2003
Annales
Geophysicae
Low frequency geomagnetic field variations at Dome C (Antarctica)
S. Lepidi1, L. Cafarella2, P. Francia3, A. Meloni2, P. Palangio1, and J. J. Schott4
1Istituto Nazionale di Geofisica e Vulcanologia, L’Aquila, Italy 2Istituto Nazionale di Geofisica e Vulcanologia, Roma, Italy 3Dipartimento di Fisica, Universit`a dell’Aquila, L’Aquila, Italy 4EOST, IPG, Strasbourg, France
Received: 17 January 2002 – Revised: 7 June 2002 – Accepted: 28 October 2002
Abstract. We conduct an analysis of the geomagnetic field
variations recorded at the new Antarctic station Dome C, lo-cated very close to the geomagnetic pole, which has been op-erating for approximately one month during the 1999–2000 campaign. We also perform a comparison with simultane-ous measurements at the Italian Antarctic station Terra Nova Bay, in order to investigate the spatial extension of the phe-nomena observed at very high latitude. Our results show that between the two stations the daily variation is similar and the fluctuations with f ∼1 mHz are coherent, provided that in both cases the comparison is made between geographically oriented components, suggesting that ionospheric currents related to the geographic position, more than field-aligned currents, are responsible for the lowest frequency variations; conversely, higher frequency (Pc5) fluctuations are substan-tially decoupled between the two stations. We also found that at Dome C the fluctuation power in the 0.55–6.7 mHz frequency band is well related with the solar wind speed dur-ing the whole day and that at Terra Nova Bay the correlation is also high, except around local geomagnetic noon, when the station approaches the polar cusp. These results indicate that the solar wind speed control of the geomagnetic field fluctu-ation power is very strict in the polar cap and less important close to the polar cusp.
Key words. Magnetospheric physics (MHD waves and
in-stabilities; Polar cap phenomena; Solar wind-magnetosphere interactions)
1 Introduction
The study of the geomagnetic field variations in Antarctica is important in that local field lines are close to the extreme magnetospheric regions (for instance the magnetopause and the polar cusp) where several generation mechanisms for ULF waves are active (Arnoldy et al., 1988 and references therein). In this sense, ground measurements at the
Antarc-Correspondence to: S. Lepidi ([email protected])
tic stations have provided useful information on the local and/or temporal extent of the Pc5 (1.6–6.7 mHz) and lower frequency pulsations (the so called IPCL, ∼1–5 mHz; Troit-skaya et al., 1973) and on their relationship with solar wind (SW) parameters. In particular, enhancements of the wave activity were clearly observed around local magnetic noon (Olson, 1986; Kleimenova et al., 1989; Engebretson et al., 1995; Ballatore et al., 1996; Kurazhkovskaya and Klain, 2000), i.e. when the stations are expected to approach the cusp position, while the presence of a power enhancement near magnetic midnight was explained in terms of substorm related features (Olson, 1986). The power of the Pc5 pulsa-tions was found to be strongly dependent on the SW speed (Wolfe et al., 1987; Engebretson et al., 1995, 1998; Ballatore et al., 1996), indicating a wave source related to the Kelvin-Helmholtz instability on the flanks of the magnetopause. Conversely, no clear relationship with the north–south com-ponent of the interplanetary magnetic field has been observed (Engebretson et al., 1995; Ballatore et al., 1998). Ballatore et al. (1998) have also shown that the Pc5 pulsation power at ∼80 S corrected geomagnetic latitude does not show a strong dependence on the geomagnetic activity.
The availability of data from approximately 1 month from a new Antarctic station at Concordia, in the framework of a joint French-Italian venture at Dome C (DMC), located very close to the geomagnetic pole, allows us to extend the study of the geomagnetic variations at the footprint of open field lines stretching in the geomagnetic tail.
For a comparison, we also analyzed the simultaneous data recorded at the Italian Antarctic station Terra Nova Bay (TNB). The location of the two stations is particularly inter-esting in that they are approximately at the same geographic latitude but at quite different corrected geomagnetic latitude. Indeed, TNB during the major part of the day is situated in the polar cap but around geomagnetic noon approaches the polar cusp and, in particular magnetospheric conditions, can even reach the location of closed field lines; conversely DMC is located deep in the polar cap during the whole day.
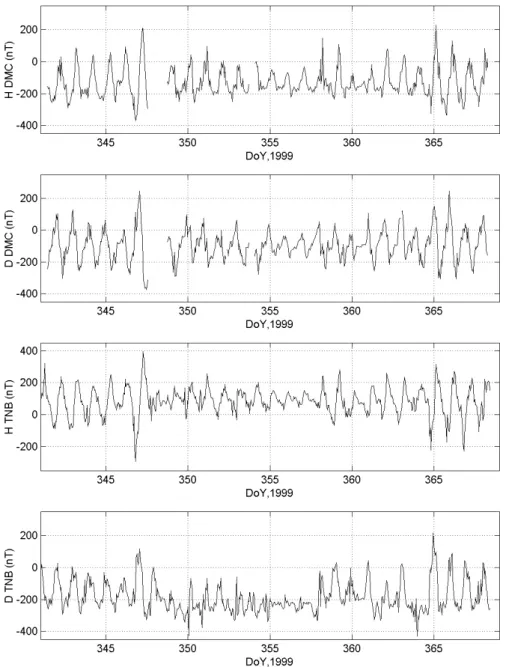
Fig. 1. Hourly averages of the H and D components at DMC and TNB from 7 December 1999 to 3 January 2000. Times are in UT.
more recently also with high resolution (1 s) measurements. The availability of long series of data allowed us to con-duct several studies to characterize the diurnal variation (Ca-farella et al., 1998), as well as the local geomagnetic field fluctuations and their relationship with the SW parameters (for a review on ULF fluctuations at TNB see Villante et al., 2000a). For the purpose of the present investigation, it is in-teresting to recall some of the results obtained for the lower frequency variations. In particular, the statistical studies by Ballatore et al. (1996) and Villante et al. (2000b) have shown that the power level of low frequency pulsations (Pc3–Pc5) maximizes around local geomagnetic noon, when TNB sta-tion approaches the polar cusp; moreover there is a good cor-relation between the fluctuation power and the SW speed, indicating a wave source related to the KelvHelmholtz
in-stability. From a statistical analysis, Villante et al. (1997) also found evidence, in the average daytime spectra of the H component, for power enhancements at discrete frequencies of the order of few mHz. This was more evident during time intervals characterized by high SW speed. The observed fre-quencies are close to those detected at auroral latitudes in the F-region drift velocities and in the geomagnetic field fluctua-tions and interpreted in terms of field line resonances excited by magnetospheric cavity/waveguide modes (Samson et al., 1992; Walker et al., 1992; Ziesolleck and McDiarmid, 1994, 1995). Due to external stimulation, for example SW pressure pulses or Kelvin-Helmholtz instability, compressional waves are generated inside the magnetosphere and propagate tail-ward reflecting between two boundaries, such as the magne-topause and the plasmapause, giving rise to standing waves
S. Lepidi et al.: Geomagnetic field variations at Dome C 925
Fig. 2. Average daily variation of the H and D hourly values at DMC and TNB.
at discrete frequencies. The evidence of the power enhance-ments at TNB, clearer near local geomagnetic noon, suggests that the fluctuations can extend some finite distance into the polar cap (see also Matthews et al., 1996).
In this paper we extend the analysis of the geomagnetic field low frequency variations up to the latitude of the geo-magnetic pole and, comparing simultaneous measurements at TNB and DMC, address the question of the spatial exten-sion of the phenomena observed at very high latitude.
2 Data analysis and experimental observations
The station DMC was installed during the 1999–2000 expe-dition, when instruments and shelter were tested in the plan-ning phases of a permanent observatory and, after some tests and checks, the observatory started in operation on 7 De-cember 1999 and worked until 3 January 2000. The varia-tions of the geomagnetic field components were measured by means of a FGE DMI variometer with a cardanic suspension, magnetically oriented, and the acquisition was triggered by a GPS.
We analyzed the 1 min values of the horizontal H and D geomagnetic field components measured at the two Antarc-tic stations DMC and TNB by a fluxgate magnetometer in the time period from 7 December 1999 to 3 January 2000. In Table 1 the geographic coordinates, the IGRF99 corrected geomagnetic coordinates and the time in UT of the magnetic
Table 1. Geographic coordinates, IGRF99 corrected geomagnetic
coordinates and time in UT of the magnetic local midnight for the stations DMC and TNB
Station Geographic Coord. Corr. Geom. Coord. MLTMN (UT) DMC 75.11 S 123.40 E 88.83 S 55.62 E 1:04
TNB 74.69 S 164.12 E 80.03 S 307.74 E 8:06
local midnight for the two stations are reported. Magnetic lo-cal time (MLT), expecially at high latitudes, is an important parameter to understand several physical phenomena. How-ever, MLT becomes meaningless approaching the geomag-netic pole, where it is not defined. For this reason, in the following we use the geographic local time (LT) as an order-ing parameter of the observed phenomena, indicatorder-ing also the MLT only for TNB station.
2.1 Diurnal variation
In Fig. 1 we show the hourly averages of the H and D com-ponents at the two stations; it is evident that a quite regu-lar 24-h variation is present at both stations for both com-ponents. In order to better investigate this feature, we cal-culated the average daily variation of the amplitude of the horizontal components, after eliminating the average values of the time series (Fig. 2). As can be seen, at DMC the H
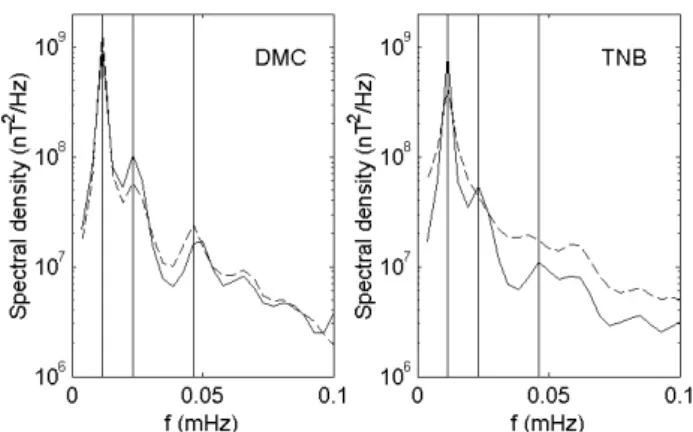
Fig. 3. Average power spectra of the H and D components
(indi-cated with solid and dashed lines, respectively) at DMC and TNB computed from hourly values. Vertical lines indicate the frequen-cies corresponding to 24 h, 12 h and 6 h.
component amplitude shows a symmetric variation with a maximum around local noon, while the D component varia-tion is antisymmetric around ∼12:00 LT, with a maximum at ∼08:00 LT and a minimum at ∼16:00 LT. On the contrary, at TNB a symmetric variation with a wide maximum around lo-cal noon characterizes the D component, and an antisymmet-ric variation with a minimum around 08:00 LT and a maxi-mum around 16:00 LT characterizes the H component. The amplitude of the diurnal variation at the two stations is com-parable: at DMC it is ∼200 nT for H and ∼250 nT for D and at TNB it is ∼200 nT for H and ∼150 nT for D.
The clear diurnal variation is also evidenced by a spec-tral analysis of the hourly averages. We computed individ-ual power spectra from 72-h values with a step size of 24 h, obtaining 12 spectra for DMC (compatibly with some data gaps) and 25 spectra for TNB; the resulting average power spectra (Fig. 3) show a clear peak at 24 h, corresponding to the diurnal variation, and, mainly at DMC, also evidence for minor peaks at 12 h and 6 h, corresponding to its harmonics (Campbell, 1997). From a visual inspection of Fig. 1, it is evident that the amplitude of the variation varies from day to day, and we found that it closely follows the level of the magnetospheric activity. Indeed, as shown in Fig. 4, the log-arithmic total horizontal power (H power + D power) at 24-h is well related to the corresponding average Kpvalue, with a
correlation coefficient of 0.89 and 0.84 for DMC and TNB, respectively (similar results are obtained separately for the two components).
2.2 Low frequency fluctuations
We next investigated the fluctuations in the frequency range f =0.55 − 6.7 mHz (i.e. T = 2.5 − 30 min), approximately corresponding to the lower frequency pulsations, calculating the hourly power spectra of the H and D components from the original 1-min measurements. We found (Fig. 5) that the average power spectra at both stations are well approximated by a straight line on a log-log scale, and no clear power
en-Fig. 4. The total (H + D) amplitude of the 24-h power peak at
DMC and TNB versus the average Kp index. The values of the
correlation coefficients are also indicated.
hancement emerges in the analyzed frequency range; more-over, at DMC the H and D power levels are very similar, while at TNB a higher power content is present on the D component. Comparing the two stations, it is also evident that at TNB there is a higher power content at the lower frequencies, while at DMC the power level is higher at the higher frequencies; this feature is well expressed by the spec-tral index (also indicated in Fig. 5), which is ∼3.0 at TNB and ∼2.6 at DMC for both components (we verified that the spectral index at both stations does not show a significant variation if we consider separately daytime and nighttime av-erage spectra).
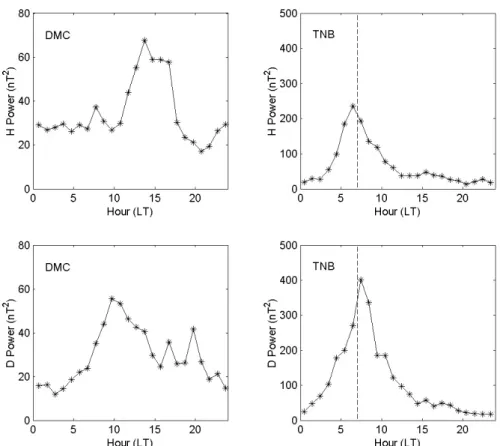
We studied the local time dependence of the low fre-quency fluctuation power (integrated over the 0.55–6.7 mHz frequency range), logarithmically averaging the values cor-responding to the same hour and plotting the behaviour in the 24 h. It is evident (Fig. 6) that a different time behaviour emerges at the two stations: at DMC the most evident feature is that the low frequency power of the H and D components maximizes in the local early afternoon (∼13:00–15:00 LT) and in the local late morning (∼09:00–11:00 LT), respec-tively; conversely at TNB both components show a very clear peak, with the largest power values on the D component, at ∼07:00 LT, corresponding to local geomagnetic noon. It is also interesting to note that during daytime hours the max-imum power level detected at TNB is really higher than at DMC; conversely, during nighttime hours, when both TNB and DMC are situated deep in the polar cap, the power level at the two stations is very similar (it is even somewhat higher at DMC). Of course, the observed power values reflect pri-marily the power content of the lower frequency fluctuations; in order to evaluate whether the same local time dependence characterizes also the higher frequency fluctuations, we con-ducted the same analysis but considering only the frequency range 4.2–6.7 mHz. The results are very similar, although in this case, the power level at the two stations is comparable, for both the minimum and the maximum values.
In order to analyze the relationship between the low fre-quency fluctuations and the magnetospheric and SW condi-tions, we estimated the correlation coefficient ρ between the logarithm of the daily average power and the daily average values of the Kp index and the SW speed (V , from ACE
S. Lepidi et al.: Geomagnetic field variations at Dome C 927
Fig. 5. The average power spectra of the H and D components
(in-dicated with solid and dashed lines, respectively) at DMC and TNB computed from original 1-min values. The values of the spectral index m are also indicated.
spacecraft) separately for the frequency bands 0.55–6.7 mHz and 4.2–6.7 mHz. As can be seen from Table 2, the corre-lation coefficients with Kp and V are well above the 99.9%
confidence limit (ρ ∼ 0.6), except for TNB in the frequency band 0.55–6.7 mHz. We also investigated the possible local time dependence of the correlation coefficient, considering hourly values of the low frequency power, Kpand V and, in
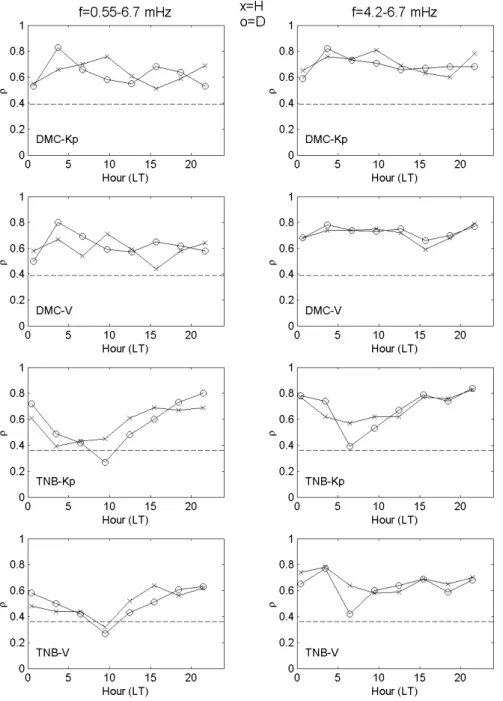
order to have a higher statistical reliability, grouping together 3-h intervals starting from 0:00 UT. The results are shown in Fig. 7. As can be seen, at DMC the correlation with Kp
and V is always well above the 99.9% confidence level (in-dicated in the figure by the dashed line) and does not show a clear local time dependence. With regards to TNB, the local time dependence is more clear, especially for the D compo-nent, with a pronounced minimum of the correlation (in some cases with values lower than the 99.9% confidence level) in the local morning, when the power of the two components maximizes (Fig. 6). We also found (results not shown) that the low frequency power does not show any significant de-pendence on the interplanetary magnetic field orientation.
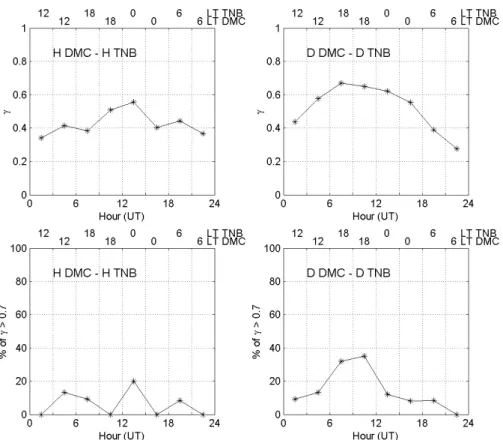
An analysis of the coherence γ between the fluctuations at DMC and TNB (calculated over 30-min intervals and aver-aged over 3 h) has revealed that for frequencies higher than ∼1.5 mHz the fluctuations detected at the two stations are substantially decoupled (the average value of γ is lower than 0.4). Conversely, for lower frequencies (f = 0.55−1.1 mHz, i.e. T = 15 − 30 min), the coherence can reach slightly higher values. Considering the homologous components of the geomagnetic field at the two stations, we found that the average value of γ is higher than 0.5 between 09:00 and 15:00 UT for the H component, and between 03:00 and 18:00 UT for the D component (Fig. 8, upper panels). How-ever, the occurrence of events with γ > 0.7 (this threshold value allows us to select coherent events with a 95% confi-dence interval; Lepidi et al., 1999) is low, always lower than 40% during the day (Fig. 8, lower panels). The same analysis performed by cross-comparing the H and D components re-veals that between non-homologous components the
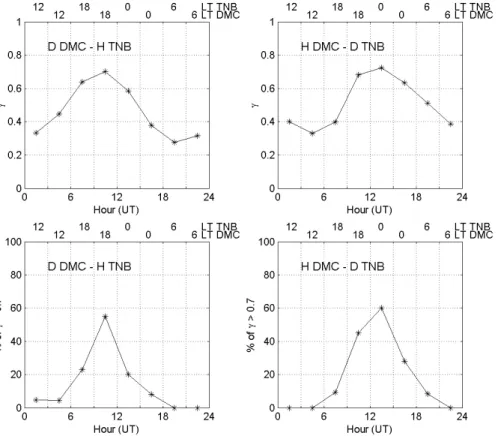
coher-Table 2. Correlation coefficients between the logarithm of the daily
average power at DMC and TNB and the daily average values of the Kpindex and the SW speed V , for the frequency bands 0.55–
6.7 mHz and 4.2–6.7 mHz Correlation f =0.55 − 6.7 mHz f =4.2 − 6.7 mHz coefficient HDMC – Kp 0.71 0.82 DDMC – Kp 0.79 0.82 HDMC – V 0.66 0.79 DDMC – V 0.75 0.84 H TNB – Kp 0.58 0.75 DTNB – Kp 0.59 0.82 H TNB – V 0.50 0.75 DTNB – V 0.57 0.81
ence is higher (Fig. 9). Indeed, when considering the pair D(DMC) – H (TNB), in the time interval 09:00–12:00 UT the average coherence is ∼0.7 and the occurrence of coher-ent evcoher-ents (γ > 0.7) is ∼50%; the same results are obtained for the pair H (DMC) – D(TNB) in the time interval 09:00– 15:00 UT. In all cases it is interesting to note that the most coherent low frequency fluctuations are statistically observed during time intervals characterized by a minor power content at both stations (Fig. 6).
3 Summary and discussion
In this paper we investigate the low frequency variations of the H and D geomagnetic field components measured at the two Antarctic stations DMC and TNB in the time period from 7 December 1999 to 3 January 2000, close to the maximum of solar activity. A comparison between DMC and TNB ob-servations is particularly interesting in that the two stations are approximately situated at the same geographic latitude, but at different corrected geomagnetic latitude: DMC is lo-cated deep in the polar cap, very close to the geomagnetic pole, while TNB, which is also usually located in the polar cap, around local geomagnetic noon can reach and even cross the location of the polar cusp for particular magnetospheric conditions.
We first focused our attention on the daily variation of the geomagnetic field components and found that it ap-pears to have a different local time behaviour at the two stations. However, when non-homologous components are compared, a close similarity of the daily variation at the two stations clearly emerges: the local time behaviour of H(DMC) closely resembles that of D(TNB) and the local time behaviour of D(DMC) closely resembles, with opposite sign, that of H (TNB). This result can be explained in terms of the electrical current systems which are responsible for the polar daily variation, including the poleward extension of the mid- and low-latitude ionospheric electric current vor-tices and the additional DP2 polar current system (Nishida and Kokubun, 1971). All these current systems, which are
Fig. 6. Average local time dependence of the 0.55–6.7 mHz fluctuation power at DMC and TNB. The vertical dashed lines indicate the local
geomagnetic noon at TNB. Note the different vertical scales at the two stations.
stationary with respect to the Sun-Earth line, at stations lo-cated at the same geographic latitude give the same daily variation of the geomagnetic field along geographic direc-tions (Campbell, 1989); since at TNB and DMC the instru-ments are magnetically oriented and the declination of the geomagnetic field at the two stations differs by ∼ 90◦ (the IGRF99 declination values are ∼ 137◦at TNB and ∼ −137◦ at DMC), similar daily variations are observed along perpen-dicular components. We note that the local time behaviour of the two horizontal components at DMC also closely re-sembles that observed on the homologous components at AGO P6 (∼85 S geomagnetic invariant latitude) by Detrick and Lanzerotti (2001) during geomagnetic quiet days, which, in turn, agrees well with the estimates of the Sq model by Campbell (1997). On this regard, we point out that the decli-nation values at DMC and P6 are very similar (∼ −137◦and −139◦, respectively). As to the amplitude of the daily varia-tion, at DMC and TNB it is roughly comparable, and is also similar to the one found at TNB during local summer and active years in a previous analysis by Cafarella et al. (1998). A visual inspection of the geomagnetic data suggests that the daily variation is always present at both stations for both components (in this sense, the average power spectra show a pronounced power peak at 24 h and also minor peaks at 12 h and 6 h), but its amplitude shows a large variation from day to day, being closely related to the Kp index. This
re-sult indicates that in the polar region the strength of the
cur-rent systems responsible for the daily variation is strongly dependent on the global level of the magnetospheric activity, and then shows a variability on time scales of days or less. A previous study of the daily variation at TNB, based on a long series of data, has provided evidence for a longer term modulation of its amplitude, due to a seasonal and solar cy-cle dependence (Palangio et al., 1996; Cafarella et al., 1998) and similar results have also been obtained at mid-latitudes (Campbell, 1989). We note that the daily variation at DMC and TNB is characterized by a greater excursion than the Sq variation at P6, reported by Detrick and Lanzerotti (2001). Since the Sq variation is calculated for the geomagnetic most quiet days, this difference can be well explained in terms of the observed dependence of the amplitude of the daily varia-tion on magnetospheric condivaria-tions.
We also investigated the fluctuations in the frequency range 0.55–6.7 mHz, which correspond roughly to the lower frequency geomagnetic pulsations. The average power spec-tra show that at the lower frequencies the power content is higher at TNB, while at the higher frequencies it is higher at DMC. As to the spectral index, at TNB we found for both components a value of ∼3.0, independent of local time, which is similar to that obtained in the Pc5 frequency band at approximately the same geomagnetic latitude (AGO P4, 80.0 S) during nighttime hours (Yagova et al., 2002) and also at slightly lower latitude (Iqaluit, ∼74.0 N; De Lauretis et al., 1991). Conversely, Olson (1986) found that the spectral
in-S. Lepidi et al.: Geomagnetic field variations at Dome C 929
Fig. 7. Local time dependence of the correlation coefficient ρ between the logarithm of the fluctuation power of the H and D components at
the two stations and the Kpindex and the solar wind speed V , separately for the frequency bands 0.55–6.7 mHz (left panels) and 4.2–6.7 mHz
(right panels). The horizontal dashed lines indicate the ρ value corresponding to the 99.9% confidence level.
dex at Cape Perry (73.8 N) in the whole Pc1–Pc5 frequency range (i.e. in a frequency range really wider than that consid-ered in the present analysis) is ∼2.6. Our results also show that the spectral index at DMC (∼2.6 for both components) is slightly lower than at TNB, independent of the local time; on the contrary, Yagova et al. (2002) have shown that during nighttime hours the spectral index increases with increasing latitude inside the polar cap (from ∼2.7 at 69 S to ∼3.3 at 87 S). We also found that in this frequency range the aver-age power spectra at both stations do not exhibit any signif-icant power enhancement. This result seems to be in
dis-agreement with previous findings by Villante et al. (1997), who, in a statistical analysis of data recorded at TNB during three austral summers, found evidence for power enhance-ments at discrete frequencies (of the order of a few mHz) and interpreted this feature as an indication for global mag-netospheric modes. We think that the series of data analyzed in the present study is not long enough to provide statisti-cal evidence for these modes, which, in the regions close to the auroral oval, can be masked by a large variety of local phenomena.
fluctu-Fig. 8. Coherence γ between the homologous components at DMC and TNB in the frequency range 0.55–1.1 mHz: daily distribution of the
average γ values (upper panels) and of the occurrence of intervals with γ > 0.7 (lower panels). Local times at the two stations are shown at the top of the plots.
ation power is different at the two stations: at TNB both components show the already known maximum around lo-cal geomagnetic noon, when the station approaches the po-lar cusp (Villante et al., 2000b), while at DMC the power of the H and D components maximizes in the local early af-ternoon and late morning, respectively. In order to provide an explanation for this different behaviour, it might be im-portant to perform a similar analysis with data from stations located at intermediate latitudes between TNB and DMC. We also found that the daytime power level is definitely higher at TNB. On the contrary, during nighttime hours, when both stations are situated deep in the polar cap, the power level at DMC is somewhat higher than at TNB; this last feature is consistent with the findings by Yagova et al. (2002), who found that the nighttime low frequency power level increases with increasing latitude inside the polar cap.
At DMC the low frequency fluctuation power appears to be well related to the Kp index and to the SW speed, with
values of the correlation coefficient ρ well above the 99.9% confidence level, without any clear dependence on the local time. Similar values of ρ are obtained at TNB only far from the local geomagnetic noon, while around local geomagnetic noon ρ exhibits a pronounced minimum (in some cases with values below the 99.9% confidence level). These results in-dicate that the SW speed control of the low frequency fluc-tuation power is stronger deep in the polar cap than close
to the polar cusp. Similar findings for the relationship be-tween Pc3–4 pulsation power at TNB and the SW speed have been recently found also by Villante et al. (2000b). In addi-tion, in the polar cap, where the local field lines are inside the geomagnetic tail, the low frequency fluctuation power reflects well the general magnetospheric conditions, while close to the polar cusp, where the local field lines reach the most extreme magnetospheric regions, the power can also be strongly influenced by local phenomena.
The analysis of the coherence between the geomagnetic field components at the two stations shows that the fluctua-tions detected at the two sites are substantially decoupled for frequencies higher than ∼1.5 mHz, while at lower frequen-cies coherent fluctuations can be observed. Moreover, the coherence for the lower frequency fluctuations is statistically higher between non-homologous components, i.e. when the Hand D components at the two stations are cross-compared; as previously remarked for the daily variation, this result could be due to the different declination at the two stations and suggests that the lower frequency geomagnetic field vari-ations (T = 15 − 30 min) could be explained mainly in terms of ionospheric phenomena related to the geographic position, rather than to field-aligned currents. We also found that the coherence is higher in the time intervals far from those in which the power level at the two stations is higher (i.e. far from the local geomagnetic noon at TNB and the local noon
S. Lepidi et al.: Geomagnetic field variations at Dome C 931
Fig. 9. The same as Fig. 8, but cross-comparing the non-homologous components at the two stations.
at DMC); in this sense it is interesting to recall the results by Yagova et al. (2002), who found that high latitude, low frequency oscillations along a magnetic meridian are highly coherent through the polar cap, while the correlation between auroral and polar cap latitudes is poor.
Acknowledgements. This research activity is supported by Italian
PNRA (Programma Nazionale di Ricerche in Antartide). The cam-paign at DMC was supported by PNRA and IFRTP (Institut Fran-cais pour la Recherche et la Technologie Polaires).
Topical Editor G. Chanteur thanks two referees for their help in evaluating this paper.
References
Arnoldy, R. L., Cahill, Jr., L. J., Engebretson, M. J., Lanzerotti, L. J., and Wolfe, A.: Review of hydromagnetic wave studies in the Antarctic, Rev. Geophys., 26, 181–207, 1988.
Ballatore, P., Lepidi, S., Cafarella, L., Villante, U., Meloni, A., Can-didi, M., and Palangio, P.: Low frequency (1.7–6.7 mHz) geo-magnetic field fluctuations at high southern latitudes, Nuovo Ci-mento, 19, 517–525, 1996.
Ballatore, P., Lanzerotti, L. J., and Maclennan, C. G.: Multistation measurements of Pc5 geomagnetic power amplitudes at high lat-itudes, J. Geophys. Res., 103, 29 455–29 465, 1998.
Cafarella, L., Meloni, A., and Palangio, P.: Solar cycle 22 control on daily geomagnetic variation at Terra Nova Bay (Antarctica), Annali di Geofisica, 41, 805–811, 1998.
Campbell, W. H.: The regular geomagnetic field variation during quiet solar conditions, in: Geomagnetism, (Ed) Jacobs, J. A., vol. 3, 385, 1989.
Campbell, W. H.: Introduction to Geomagnetic fields, Cambridge University Press, 1997.
De Lauretis, M., Villante, U., Vellante, M., and Wolfe, A.: An anal-ysis of power spectral indices in the micropulsation frequency range at different ground stations, Planet. Space Sci., 39, 975– 982, 1991.
Detrick, D. L. and Lanzerotti, L. J.: Geomagnetic quiet time (Sq) variations at high latitudes, Geophys. Res. Lett., 28, 2581–2584, 2001.
Engebretson, M. J., Hughes, W. J., Alford, J. L., Zesta, E., Cahill Jr., L. J., Arnoldy, R. L., and Reeves, G. D.: Magnetometer ar-ray for cusp and cleft studies observations of the spatial extent of broadband ULF magnetic pulsations at cusp/cleft latitudes, J. Geophys. Res., 100, 19 371–19 386, 1995.
Engebretson, M. J., Glassmaier, K. H., and Stellmark, M.: The de-pendence of high latitude Pc5 wave power on solar wind velocity and on the phase of high speed solar wind streams, J. Geophys. Res., 103, 26 271–26 283, 1998.
Kleimenova, N. G., Kosyreva, O. V., Bitterly, J., and Folk, J.: Spec-trum of long-period geomagnetic pulsations (np) in the region of the daytime polar cusp, Geomagn. Aeron., 29, 742–743, 1989. Kurazhkovskaya, N. A. and Klain, B. I.: Peculiar features of burst
series of long period irregular ipcl-type geomagnetic pulsations in the vicinity of the dayside cusp, Intern. J. Geomagn. Aeron., 2, 2000.
Lepidi, S., Francia, P., Villante, U., Lanzerotti, L. J., and Mel-oni, A.: Polarization pattern of low frequency geomagnetic field
Palangio, P., Meloni, A., Cafarella, L., and Zirizzotti, A.: Magnetic field measurements at Terra Nova Bay geomagnetic observatory, in: Italian Geophysical Observatories in Antarctica, (Eds) Mel-oni, A. and Morelli, A., 21, 1996.
Samson, J. C., Harrold, B. G., Ruohoniemi, J. M., Greenwald, R. A., and Walker, A. D. M.: Field line resonances associated with MHD waveguides in the magnetosphere, Geophys. Res. Lett., 19, 441–448, 1992.
Troitskaya, V. A., Bolshakova, O. V., and Hessler, V. B.: Irregular geomagnetic pulsations in the polar cap, Rep. Assem. IAGA, Int. Assoc. Geom. and Aeron., Rockville, Md., 1973.
Villante, U., Lepidi, S., Francia, P., Meloni, A., and Palangio, P.: Long period geomagnetic field fluctuations at Terra Nova Bay (Antartica), Geophys. Res. Lett., 24, 1443–1446, 1997. Villante, U., Lepidi, S., Francia, P., Vellante, M., Meloni, A., and
J. F., and Venkatesan, D.: ULF geomagnetic power at cusp lati-tudes in response to upstream solar wind conditions, J. Geophys. Res, 92, 168–174, 1987.
Yagova, N. V., Lanzerotti, L. J., Villante, U., Pilipenko, V. A., Le-pidi, S., Francia, P., Papitashvili, V. O., and Rodger, A. S.: ULF Pc5–6 magnetic activity in the polar cap as observed along a ge-omagnetic meridian in Antartica, J. Geophys. Res, 107, SMP 22-1–SMP22-12, 2002.
Ziesolleck, C. W. S. and McDiarmid, D. R.: Auroral latitude Pc5 field line resonances: quantized frequencies, spatial character-istics and diurnal variations, J. Geophys. Res., 99, 5817–5830, 1994.
Ziesolleck, C. W. S. and McDiarmid, D. R.: Statistical survey of auroral latitude Pc5 spectral and polarization characteristics, J. Geophys. Res., 100, 19 299–19 312, 1995.