Determinants of Credit Spreads on U.S. Dollar-Denominated Asian Corporate Bonds
BySungmin Jo B.A. Economics
Seoul National University, 2003
SUBMITTED TO THE MIT SLOAN SCHOOL OF MANAGEMENT IN PARTIAL FULFILLMENT OF THE REQUIREMENTS FOR THE
DEGREE OF
MASTER OF BUSINESS ADMINISTRATION AT THE
MASSACHUSETTS INSTITUTE OF TECHNOLOGY JUNE 2014
C 2014 Sungmin Jo. All Rights Reserved.
AASSAcIAUSETTS INSIrfUTE
JUN 18 2014
§B 7RARIES
The author hereby grants to MIT permission to reproduce and todistribute publicly paper and electronic copies of this thesis document in whole or in part in any medium now known or hereafter created.
Signature redacted
Signature of Author:MIT'Sloan School of Management May 9, 2014
Certified By:
Signature redacted
Deborah Lucas Sloan Distinguished Professor of Finance
Thesis Supervisor
Signature redacted
Accepted By:
Maura Herson Director, MIT Sloan MBA Program MIT Sloan School of Management
Determinants of Credit Spreads on U.S. Dollar-Denominated Asian Corporate Bonds
By Sungmin Jo
Submitted to the MIT Sloan School of Management on May 9, 2014 in partial fulfillment of the requirements for the degree of
Master of Business Administration
ABSTRACT
This study investigates determinants of credit spreads on U.S. dollar-denominated Asian corporate bonds. Using a country-level unbalanced panel dataset of Asian corporate bond indices, I find that global factors including U.S. corporate bond spreads and the U.S. long-term Treasury yield are main determinants of Asian corporate bond spreads. Principal component analysis also demonstrates that only a few variables account for the variation in Asian corporate bond spreads. Moreover, global factors have the greatest impact on credit spreads in the financial sector and the smallest impact on credit spreads in the utility sector. Finally, my results show that Asian corporate credit spreads respond more substantially to the U.S. monetary easing than to the U.S. monetary tightening, and they also react more strongly to widening U.S. credit spreads than to narrowing U.S. credit spreads.
Thesis Supervisor: Deborah Lucas
Table of Contents
I. Introduction ... 7
II. Literature Review ... 9
III. M ethodology and Data... 11
1. M odel Specification ... 11
2. Data Construction ... 13
IV . R e su lts ... 15
1. Baseline Estim ations ...
15
2. Determ inants of Corporate Bond Spreads by Sector ... 18
3. Asym metric Effects of Global Factors... 19
4. Principal Component Analysis...22
5. Robustness Checks...25
V . Conclusions ... 26
Appendix A Descriptive Statistics of Corporate Bond Spreads and Explanatory Variables ... 27
Appendix B Descriptions of Variables ... 30
Appendix C Correlation Matrix of Dependent Variables and Explanatory Variables...31
Appendix D Determinants of Corporate Bond Spreads: First Difference Variables ... 32
List of Tables
Table 1 Descriptive Statistics of Credit Spreads... 14
Table 2 Corporate Bond Spreads Determinants: First Difference Variables ... 16
Table 3 Corporate Bond Spreads Determinants: Level Variables ... 17
Table 4 Predictions on Credit Spreads by Country ... 18
Table 5 Corporate Bond Spreads Determinants by Sector...19
Table 6 Asymmetric Impacts of Monetary Policy ... 21
Table 7 Asymmetric Impacts of U.S. Corporate Bonds...21
Table 8 Determinants of Corporate Bond Spreads: 2004.4Q-2013.4Q ... 23
Table 9 Principal Component Analysis of Corporate Bond Spreads and Residuals...24
I. Introduction
Asian corporate bond issuance in the global financial markets has expanded dramatically since the Asian Crisis. ' The amount of outstanding international debt securities issued by non-financial corporations in Asian countries has more than tripled from $57.0 billion at the end of 2000 to $183.6 billion at the end of September 2013.2 During the same period developed countries have experienced similar growth rates in the issuance of the international debt securities. Local currency corporate bond markets have also grown tremendously in Asian countries over the past decade, but foreign currency corporate bonds (mostly U.S. dollar-denominated bonds) are more attractive to global investors due to the availability of replicable portfolio benchmarks, larger deal sizes, and a greater likelihood that they are rated by international rating agencies. (Hack and Close, 2013).
The implications of the increase in Asian foreign currency corporate bonds are twofold. First, Asian corporations have been able to improve their fundamentals such as debt service after the Asian Crisis and secured another funding source from the global capital markets. Second, there have been changes in investors' risk preferences toward the credit risk of Asian companies, and investors could also benefit from portfolio diversification effects through increased investment in emerging markets.
Despite the importance of this topic, there have been few studies which investigate credit spreads on Asian foreign currency corporate bonds and most research has dealt with U.S. corporate bond markets. Recently, Cavallo and Valenzuela (2010) examine determinants of credit spreads on emerging market foreign currency corporate bonds and find that firm-specific characteristics substantially explain changes in credit spreads. Delikouras, Dittmar, and Li (2013) explore the extent to which the volatility of foreign exchange rates along with interest rates and stock prices influence credit spreads on U.S. dollar-denominated corporate bonds issued by emerging market companies. Their main focus is on the sensitivity of credit spreads to foreign exchange rates. However, both of the studies use only level variables in their model specifications and do not analyze a short-run relationship between credit spreads and other variables by means of employing differenced variables. The coverage of Asian countries in the sample is also limited.
This paper analyzes determinants of credit spread changes in U.S. dollar-denominated Asian corporate bonds. I construct a quarterly country-level panel dataset with corporate bond indices for nine Asian countries (China, Hong Kong, India, Korea, Malaysia, Philippines, Singapore, Taiwan, Thailand) over the period from 2000 through 2013 and consider four categories of explanatory variables: country fixed effects, bond indices characteristics, global factors, and country-specific factors. Implementing regressions with differenced variables and level variables separately, I find that global factors including U.S. corporate bond spreads and the U.S. 10-year Treasury yield are primary determinants of the variation in Asian corporate bond spread changes. This result is supported by principal component analysis, which indicates that two principal components capture most of the variations in Asian corporate credit spreads.
' Asian corporate bonds in this paper refer to U.S. dollar-denominated Asian corporate bonds unless otherwise stated. 2 Following Delikouras et al. (2013), I take data from the Bank for International Settlements and do some calculations based on international debt securities by nationality of issuers in Table 12D of the BIS Quarterly Review December 2013. International debt securities include bonds, notes, and money market instruments. The data of bonds and notes by nationality of issuer are not released separately, but money market instruments account for only a small proportion of international debt securities (developed countries 4.1%, Asia 8.7% as of September 2013).
These findings imply that U.S. dollar-denominated Asian corporate bonds are in the same investment pool with U.S. corporate bonds. It appears that global investors indirectly infer credit risk of Asian companies from the U.S. financial market conditions even though they might not have as precise information about Asian corporate risk as local investors do. Furthermore, in explaining Asian credit spreads, I observe considerable cross-country heterogeneity, which is not captured by economic variables. Additionally, I find that global factors are more closely related to Asian corporate bond spreads in the financial sector than those in the industry sector or the utility sector. Last, my results show that the effect of the U.S. monetary policy on Asian credit spreads is more noticeable in monetary easing than in monetary tightening. Asian credit spreads also react more strongly to widening U.S. corporate bond spreads than to narrowing U.S. corporate bond spreads.
My study differs from previous research papers in that it includes an extensive range of Asian countries in analyzing determinants of Asian corporate bond spreads. In addition, an option-adjusted spread is used as a dependent variable and contributes to increasing the quality of analysis by removing the effect of the optionality of corporate bonds on credit spreads. This paper also extends to comparing determinants of credit spreads across sectors.
The rest of the paper is organized as follows. Section 2 reviews recent relevant literature. Section 3 discusses empirical methodology, explains variables, and presents descriptive statistics of data. Sector 4 reports estimation results on the determinants of Asian corporate bond spreads, and Section 5 makes conclusions.
II. Literature Review
Several empirical studies on determinants of corporate bond spreads have been conducted over the last decade. Most of them focus on U.S. corporate bond markets, and there have been few studies on Asian corporate credit spreads.
Collin-Dufresne, Goldstein, and Martin (2001) consider default probability and recovery rates, which are suggested by traditional models of default risk to analyze determinants of changes in corporate bond spreads. They find that those factors explain only 25 percent of the variation in credit spread changes. They show that the dominant factor is the systematic movement of credit spread changes, but it is not associated with either the equity markets or Treasury markets. They suggest that the dominant component of credit spread changes is driven by local supply and demand shocks that are independent of both changes in credit risk and liquidity.
Elton, Gruber, Agrawal, and Mann (2001) also document that expected default loss accounts for only 18 percent of corporate bond spreads. They find that taxes explain 36 percent of the spreads and hence emphasize the importance of tax premium in credit risk. They also argue that 85 percent of the changes in unexplained spreads can be explained as a compensation for bearing common stock factors, which is measured by the Fama-French factors including the market excess return factor, the small minus big size factor, and the high minus low book-to-market factor.
On the other hand, Avramov, Jostova, and Philipov (2007) present contrasting findings. They demonstrate that common factors and firm-level fundamentals explain more than 68 percent, 55 percent, and 36 percent of the variation in credit spread changes for low-, middle-, and high-grade bonds, respectively and support structural models in explaining changes in corporate credit risk. The variables they incorporate into linear time-series regressions are idiosyncratic equity volatility, growth opportunities, stock return momentum, the leverage of a company, the spot rate and the term-structure slope, and market conditions. Furthermore, their principal component analysis shows that structural models of credit spreads capture the systematic variation in credit spread changes. All three studies employ firm-level data and individual bond yields in the U.S. market, but the next two studies use bond indices for their analysis.
Brown (2001) investigates the relation of corporate bond spread changes with the U.S. 10-year Treasury yield, consumer confidence, and the VIX. Using option-adjusted spreads for different credit quality and maturities in Salomon Brothers bond indices, he points out that corporate bond spread changes are negatively related to changes in consumer confidence and 10-year Treasury bond yield, but positively related to the VIX. His additional finding is that a considerable portion of the corporate bond spread volatility is due to changes in the non-default components of the spreads.
Huang and Kong (2003) also use changes in option-adjusted spreads for nine Merrill Lynch U.S. corporate bond indices to examine the explanatory power of the following variables: the level and the slope of yield curve, interest rate volatility, equity index return and volatility, the Conference Board leading and coincident indicator indexes, and the Fama-French high-minus-low factor. They run OLS regressions with each explanatory variable separately, and then implement the regression with all the explanatory variables combined. Their conclusion is that these variables explain more than 60 percent of
credit spread changes for both BB-and B-rated indexes, and macroeconomic factors also explain credit spread changes at the aggregate level.
Recently two studies analyze emerging market corporate bond spreads. Cavallo and Valenzuela (2010) use option-adjusted spreads on foreign currency bonds issued in 10 emerging countries (six in Latin America and four in Asia). To study determinants of corporate bond spreads through linear regressions, they control for firm-specific variables, bond characteristics, macroeconomic conditions, sovereign risk, and global factors. Their finding is that firm-level performance indicators are significant determinants of corporate risks. They also document that sovereign risk and global factors explain some of the variation in corporate bond spreads but that they are less important.
Lastly, Delikouras et al. (2013) investigate whether investors in dollar-denominated emerging market corporate bonds are exposed to foreign exchange risk. They use individual corporate bonds issued by 24 companies in six emerging countries (Brazil, Chile, Mexico, Russia, Singapore, Korea). As an explanatory variable of corporate bond spreads, the volatility of foreign exchange rates is newly considered in addition to the level and the slope of yield curve, the VIX, returns on U.S. stock market, and returns on local stock markets. They find that there is some evidence that credit spreads on dollar-denominated corporate bonds are sensitive to the variation in the foreign exchange rates, but there is a substantial variation across countries in the signs and magnitudes of estimates.
III. Methodology and Data
1. Model Specification
I implement regression analysis with differenced variables and level variables separately. Regressions with differenced variables help capture short-run relationships among variables, but there are limitations in that they may not be able to capture information about potential long-run relationships. Regressions with level variables can complement this shortcoming of the differenced variable regressions. I begin with estimating the following regression with first-differenced variables for each country i at quarter t:
A(OAS)it = a + 31,ABFit± fl2AGFt+ 3ACFit + Et (1)
where OAS, are credit spreads, a are country fixed effects, BFit are bond indices characteristics, GFit are global factors, CFit are country-specific factors, and Eit are error terms. First differencing is change from quarter t-1 to quarter t, and sovereign credit rating is used in its orginal form since it does not vary from quarter to quarter.
Next, I estimate the regression with level variables for each country i at quarter t:
ln(OAS)it = ai + /31BFit+ f2GFit + / 3CFit + Eit (2) Panel unit root tests (Augmented Dickey-Fuller tests and Phillips Perron tests) indicate that all variables except time to maturity and the U.S. 10-year Treasury yield are stationary.3 Thus there is little possibility of spurious correlation resulting from non-stationary variables when regressions with level variables are conducted. If all variables in the panel dataset are non-stationary but cointegrated, Kao (1999) suggests dynamic ordinary least squares and Pedroni (2000) recommends fully modified ordinary least squares for estimation. But it does not apply to my panel dataset because most of my variables are stationary. As a result, I use pooled ordinary least squares (OLS) and employ other estimations for robustness checks.
Dependent variable is Asian credit spreads, measured by option-adjusted spreads (OAS) on Asian corporate bond. OAS can be defined as a credit spread that has been adjusted for any options embedded in bonds. Since many companies tend to issue callable bonds, the optionality should be taken into account to better isolate the effects of credit risk and to make the spreads on callable bonds and non-callable bonds more comparable. Huang and Kong (2003) describe the credit spread on corporate bonds without embedded options as the extra yield offered to compensate investors for a variety of risks: (1) expected default loss, (2) credit risk premium, and (3) liquidity and tax premium. Therefore, OAS is a good proxy for credit risk regardless of the embedded options.
Explanatory variables are categorized into four groups: country fixed effects, bond indices characteristics, global factors, and country-specific factors. The country fixed effects account for each country's unobserved inherent characteristics such as taxation and financial regulations.
3 For panel unit root tests, I employ Fisher-type test and Im-Pesaran-Shin test, both of which can be applied to unbalanced panel data. Stata command 'xtunitroot fisher' and 'xtunitroot ips' are used.
For bond indices characteristics, I include time to maturity and amount outstanding. To the extent that greater risk is associated with longer maturities even within the same rating class, investors would require higher (lower) spreads with longer (shorter) maturities. In academic research the evidence for this relationship is mixed. Merton (1974) finds that in theory, corporate bond spreads can either increase or decrease with maturities depending on the credit quality of the bonds. Sarig and Warga (1989) and Fons (1994) show a downward-sloping credit yield curve for high-yield bonds, but Helwege and Turner (1999) and Huang and Zhang (2008) find an upward-sloping curve for investment-grade and high-yield bonds. The next variable used in the regression is liquidity, which is important to explain the spread on corporate bonds since they are not actively traded (Houweling, Mentink, and Vorst (2005), Chen, Lesmond, and Wei (2007), Bao, Jun, and Wang(201 1)). In this paper, the amount outstanding of constituents bonds in the indices is used as a proxy for liquidity. The bid-ask spread could be a more accurate variable, but the data is not available all the time due to the low frequency of trading. Thus, the amount outstanding is used as an alternative measure, which is suggested by Houweling et al. (2005).
Global factors are comprised of price variables in the U.S. financial markets which would influence global investors' decisions on whether to buy or sell Asian corporate bonds. The first explanatory variable is U.S. corporate bond credit spreads, measured by U.S. corporate bond option-adjusted spreads. U.S. corporate bonds are in many ways similar instruments to U.S. dollar-denominated corporate bonds issued by Asian companies. For example, since both of them are issued in the same currency, the Asian corporate bonds do not cause foreign exchange risk for U.S. investors and thus could be viewed as substitutes (Cavallo and Valenzuela, 2010). This would lead the OAS of Asian corporate bonds to be positively related with the OAS of U.S. corporate bonds. The next variable is the VIX of Chicago Board Options Exchange, which measures the market implied expectations of the volatility of the S&P 500 index. I also consider the level and the slope of the U.S. yield curve. An increase in the yield curve level, measured by the U.S. 10-year Treasury yield, implies an increase in the upward drift of risk-neutral process for firm value and reduces the probability of default, thereby decreasing credit spreads (Longstaff and Schwartz (1995) and Collin et al. (2001)). The slope of the yield curve is a proxy for the economic outlook of market participants, defined as the difference between the U.S. 10-year Treasury yield and the U.S. 2-year Treasury yield. The slope could have an either positive or negative relationship with credit spreads. A steepening of the yield curve, which typically implies an increase in the expected future spot rate and a bullish outlook for the global economy, would reduce credit spreads. But an increase in the expected future spot rates would raise borrowing costs of corporations in the future and hence lead to
widening credit spreads.
For country-specific factors, I include sovereign risk and macroeconomic indicators because economic conditions could be an important criterion for global investors in order to determine whether to invest in emerging market risky assets. As a proxy for sovereign risk, S&P issuer ratings of long-term government bonds are used. Issue ratings are available as well, but issuer ratings are better variables since issue ratings can vary depending on the specific characteristics of government bonds. S&P credit ratings are numbered from one (AAA) to 22 (D). Other country-specific factors include GDP growth rate, CPI, and current account as a percentage of GDP. I also consider the equity index volatility of each country as a forward-looking economic indicator. Merton (1974) shows that higher volatility of a firm's value increases the likelihood of the firm's default, and Campbell and Taksler (2003) find evidence that equity
volatility helps to explain the movements in aggregate corporate bond yield spreads. Following their methodology, I define the equity volatility as annualized standard deviation of daily equity index returns for 180 trading days. The final variable is the local term spread as an indicator of economic conditions, defined as the difference between the 10-year government bond yield and the 2-year government bond yield.
I employ cluster-robust standard errors by time variable for pooled OLS estimation. Petersen (2009) and Cameron, Gelbach, and Miller (2011) suggest that the standard error estimator with clustering two dimensions (e.g. country and time) should be used to obtain consistency in financial panel datasets because errors are likely to be correlated within cluster. They recommend that the number of clusters should be large to avoid misleading clustered standard errors. Petersen (2009) presents simulation results that when there are only a few clusters in one dimension, clustering by the more frequent cluster yields results that are almost identical to clustering by two dimensions. My panel dataset consists of 10 countries over 53 quarters, and hence I employ the standard error estimator clustered by the time variable and additionally include country dummy variables to account for country fixed effects. I report estimation results using clustered standard errors by both the time variable and the country variable for robustness checks.
2. Data Construction
I obtain corporate bond indices from Barclays Point database. They are end-of-month data on U.S. dollar-denominated corporate bonds of 13 Asian countries and provide aggregate information including option-adjusted spreads, time to maturity, the number of bonds, and the amount outstanding. The indices contain four aggregate sectors (corporate, financial, industrial, utility) and 10 credit ratings (Aaa, Aa, A, Baa, Ba, B, Caa, Ca, C, D) for each sector, and include all bonds with a minimum of $150 million outstanding, fixed rate coupons, and more than one year to maturity.
I exclude the Indonesian indices from the analyses because of the unusually high volatility of its OAS. Its volatility (standard deviation) is about four times higher than the maximum volatility of the remaining countries.4 I also do not use indices based on credit rating because the number of countries does not remain the same across ratings categories and each index has fewer observations than aggregate sector indices have. This filtering results in four aggregate sector indices (corporate, financial, industrial, utility) from 2000 to 2013, and countries are China, Hong Kong, India, Korea, Malaysia, Philippines, Singapore, Taiwan, and Thailand.
Table
1
summarizes descriptive statistics of credit spreads on U.S. dollar-denominated Asian corporate bonds by sector. U.S. corporate bond spreads are tabulated for comparison. The mean of corporate bond spreads, their standard deviation, the minimum, 25th percentile, 75th percentile, and the maximum are reported. In four sectors of Asian corporate bonds and U.S. corporate bonds, credit spreads 4 The table below presents the standard deviation (basis point) of option-adjusted spreads in the corporate sector bond index by country.China Hong Kong India Indonesia Korea Malaysia Philippines Singapore Taiwan Thailand 330.59 130.18 281.23 1167.59 271.33 117.72 87.45 110.69 197.49 151.14
are skewed to the right due to the very large magnitude of the maximum. This is partly because credit spreads spiked during the global financial crisis. All maximum credit spreads are observed in the fourth quarter of 2008. The average spread on Asian corporate bonds is higher by 150 basis points than the average of U.S. corporate bond spread, implying that Asian corporate bonds are associated with higher risk than U.S corporate bonds in the financial markets. Among individual sectors, the average credit spread is the highest in the financial sector and the lowest in the utility sector. But the lowest volatility is observed in the utility sector, reflecting the lower cyclicality of that industry. Further descriptive statistics of bond indices and explanatory variables are presented in Appendix A.
Table 1 Descriptive Statistics of Credit Spreads
This table reports descriptive statistics of Asian and U.S. corporate bond spreads in basis point by sector from 2000 to 2013.
Asian Credit Spreads US Credit Spreads
Corporate Sector Financial Sector Industry Sector Utility Sector
Mean 331.72 349.46 337.8 283.09 181.39 Std dev. 241.82 276.58 279.39 207.14 105.16 Min 72.93 74.86 71.15 55.34 83.00 25th percentile 174.56 189.06 150.43 120.16 99.50 75th percentile 411.93 396.81 429.56 374.88 197.00 Max 1689.96 2146.89 1989.50 908.60 604.00 Obs. 366 295 340 142 504
Explanatory variables are taken from various sources: the U.S. OAS from Global Financial Data, the U.S. Treasury yields and individual countries' equity indices and macroeconomic indicators from Bloomberg, the VIX and individual countries' yields from Datastream. But current account as a percentage of GDP for Philippines and Singapore are obtained in a different way because Bloomberg has either short time series or does not provide the data. For the Philippines, I obtain current account as a percentage of GDP from the Central Bank of the Philippines, and for Singapore, I divide current account by GDP after I obtain both data series from Bloomberg. Lastly, I use the same OAS on U.S. corporate bonds as an explanatory variable of all sector indices because the U.S. OAS is not available at an individual sector level.
The data frequency used in the regression analysis is quarterly due to the availability of macroeconomic indicators (GDP and current account) which are released on a quarterly basis although all the other variables are month-end data. I select quarter-end data (March, June, September, December) from these month-end data and construct a quarterly unbalanced panel dataset for each sector indice over 56 quarters from the first quarter of 2000 to the fourth quarter of 2013. Descriptions of variables are presented in Appendix B, and correlation matrices of a dependent variable and explanatory variables are reported in Appendix C.
IV. Results
1. Baseline Estimations
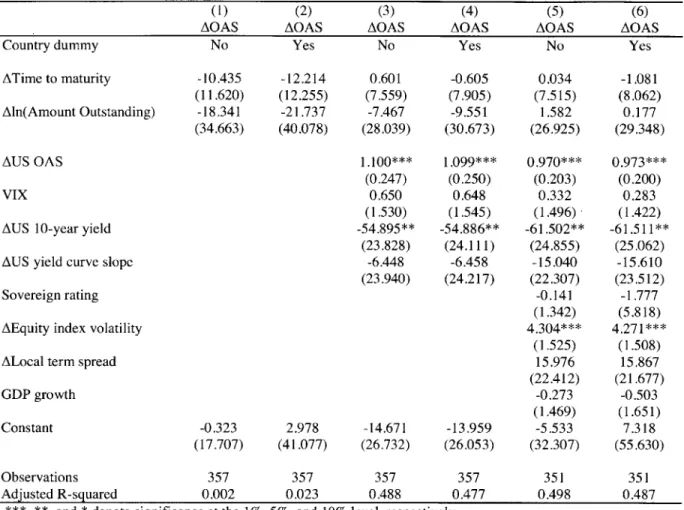
I run pooled regressions of first-differenced Asian corporate bond spreads on bond indices characteristics, global factors, and country-specific factors with and without country dummy variables, as in model (1). I implement regressions on bond indices characteristics and then sequentially include two other factors as explanatory variables. This intends to see whether there is any improvement in the explanatory power of an additional factor with little impact on explanatory variables that are already included in regression specifications. The regression results are presented in Table 2.
Column (1) only includes bond indices characteristics as explanatory variables. The coefficients of time to maturity and amount outstanding are negative, but are not statistically significant. These results remain the same after global factors, country-specific factors, and country fixed effects were controlled for. The explanatory power is also very low. This result is due to very little quarterly variability of time to maturity and the amount outstanding.
Column (3) contains explanatory variables which are related to U.S. financial market conditions. The U.S. OAS has almost one-to-one positive relation with the dependent variable and has economic significance: when the change in U.S. corporate bond spreads moves down by 100 basis points, the change in Asian corporate bond spreads falls by about the same amount of basis points. This result implies high degrees of integration among the same currency-denominated corporate bonds regardless of issuers' geographical location, and it can be interpreted as follows; U.S. corporate bonds and Asian corporate bonds are in the same investment class. The estimated coefficients of the U.S. OAS remain statistically and economically significant when country-specific factors are incorporated into regressions.
The estimated coefficients of the U.S. 10-year Treasury yield are of the expected negative sign and statistically significant at the 95% confidence level. Its magnitude is large in economic significance: a one percent decrease in the U.S. 10-year Treasury yield change is associated with a 55 basis point increase in Asian corporate bond spread changes on average. This result is consistent with Duffee's finding (1998).
In column (5) and (6), only equity index volatility among country-specific factors is statistically significant at the 99% confidence level. It is positively related with changes in credit spreads. Since GDP is not statistically significant, I test alternative macroeconomic indicators including CPI and current account as a percentage of GDP, but the results remain the same. In addition, country fixed effect is not shown to be significant because whether country dummy variables are included or not has little impact on the adjusted R-squared. The coefficients of country dummy variables are reported in Appendix D.
The explanatory power of global factors are dominant among explanatory variables. Adjusted R-squared does not change much even when country-specific factors are added. The variation in global factors changes explains 48% of the variation in Asian corporate bond spread changes. This finding shows that U.S. dollar-denominated Asian corporate bonds are highly integrated with the global markets, in particular, the U.S. market conditions.
Table 2 Corporate Bond Spreads Determinants: First Difference Variables
Using quarterly unbalanced panel data from 2000 to 2013, I run regressions of first-differenced Asian corporate bond spreads on the variables listed below with and without country dummy variables.'Clustered standard errors by quarter are in parentheses. The dummy variables are reported in Appendix D.
(1) (2) (3) (4) (5) (6)
AOAS AOAS AOAS AOAS AOAS AOAS
Country dummy No Yes No Yes No Yes
ATime to maturity -10.435 -12.214 0.601 -0.605 0.034 -1.081 (11.620) (12.255) (7.559) (7.905) (7.515) (8.062) Aln(Amount Outstanding) -18.341 -21.737 -7.467 -9.551 1.582 0.177 (34.663) (40.078) (28.039) (30.673) (26.925) (29.348) AUS OAS 1.100*** 1.099*** 0.970*** 0.973*** (0.247) (0.250) (0.203) (0.200) VIX 0.650 0.648 0.332 0.283 (1.530) (1.545) (1.496), (1.422)
AUS 10-year yield -54.895** -54.886** -61.502** -61.511**
(23.828) (24.111) (24.855) (25.062)
AUS yield curve slope -6.448 -6.458 -15.040 -15.610
(23.940) (24.217) (22.307) (23.512)
Sovereign rating -0.141 -1.777
(1.342) (5.818)
AEquity index volatility 4.304*** 4.271***
(1.525) (1.508)
ALocal term spread 15.976 15.867
(22.412) (21.677) GDP growth -0.273 -0.503 (1.469) (1.651) Constant -0.323 2.978 -14.671 -13.959 -5.533 7.318 (17.707) (41.077) (26.732) (26.053) (32.307) (55.630) Observations 357 357 357 357 351 351 Adjusted R-squared 0.002 0.023 0.488 0.477 0.498 0.487
***, **, and * denote significance at the 1%, 5%, and 10% level, respectively.
Next, I run regressions of the natural logarithm of Asian corporate bond spreads on the explanatory variables used in model (2), and the results are presented in Table 3. Most of the changes in Asian corporate bond spreads are explained by variation in bond indices characteristics and global factors while country-specific factors have minimal explanatory power as shown in column (4) and (6). In particular, global factors including U.S. corporate bond spreads, U.S. long-term Treasury yield, and the slope of U.S. yield curve have large explanatory power. This result confirms that Asian corporate bond spreads are highly linked with global financial market conditions.
In addition, there is considerable cross-country heterogeneity which is not explained by economic variables. In column (3) and (4), as country fixed effect is included in the regression, the adjusted R-squared jumps to 87% from 55%. Country-specific factors including sovereign rating, equity index volatility, and GDP growth lose statistical significance whereas the coefficient of U.S. credit spreads increases in the magnitude. This country fixed effect is not captured by first difference regressions in Table 2. Country dummy variables are presented in Appendix E.
Table 3 Corporate Bond Spreads Determinants: Level Variables
Using quarterly unbalanced panel data from 2000 to 2013, I run regressions of Asian corporate bond spreads (level variables) on the variables listed below with and without country dummy variables. Clustered standard errors by quarter are in parentheses. The dummy variables are reported in Appendix E.
(1) (2) (3) (4) (5) (6)
ln(OAS) ln(OAS) ln(OAS) ln(OAS) ln(OAS) ln(OAS)
Country dummy No Yes No Yes No Yes
ln(Time to maturity) -0.318*** -0.439*** 0.127** 0.204*** 0.026 0.116* (0.087) (0.126) (0.049) (0.061) (0.052) (0.059) ln(Amount Outstanding) -0.035* -0.014 -0.046*** -0.069*** -0.046*** -0.053* (0.018) (0.036) (0.014) (0.021) (0.011) (0.029) ln(US OAS) 0.838*** 0.781*** 0.413*** 0.673*** (0.108) (0.099) (0.137) (0.108) VIX -0.004 -0.000 0.000 0.002 (0.007) (0.006) (0.006) (0.005)
ln(US 10-year yield) -0.410*** -0.359*** -0.703*** -0.377***
(0.078) (0.066) (0.073) (0.068)
US yield curve slope 0.091*** 0.114*** 0.089*** 0.087***
(0.018) (0.016) (0.033) (0.024)
Sovereign rating 0.031*** -0.019
(0.005) (0.020)
Equity index volatility 0.031*** 0.003
(0.003) (0.002)
Local term spread 0.037 0.077***
(0.029) (0.027) GDP growth 0.032*** -0.003 (0.006) (0.003) Constant 6.744*** 7.433*** 2.186*** 3.424*** 3.807*** 3.877*** (0.372) (0.666) (0.537) (0.590) (0.665) (0.844) Observations 366 366 366 366 360 360 Adjusted R-squared 0.047 0.416 0.550 0.866 0.708 0.874
***, **, and * denote significance at the 1%, 5%, and 10% level, respectively.
Determinants of corporate bond spreads by country would be of interests for market participants since cross-country differences are important information for investment country selection. I predict credit spreads of 2004, 2008 and 2013 with coefficient estimates of explanatory variables in column (6) of Table 3 and country dummy variables in Appendix E. Predictions are presented in Table 4. Predicted credit spreads are in general close to the actual spreads, but they fail to capture the extreme spike during the 2008 global financial crisis. For instance, the credit spreads of China are overpredicted while the credit spreads of India and Korea are underpredicted. I observe two additional findings from the predicted credit spreads. The first one is that the gap between Chinese corporate bond spreads and other countries corporate bond spreads narrowed dramatically in 2013 despite increases in speculative-rated Chinese corporate bonds in 2013. This finding has to do with the fact that there has been a lot of demand for Chinese corporate bonds in the global markets over the past five year; in fact, their outstanding amount has increased from $3.3 trillion to $76.3 trillion. Another finding is that Singapore corporate bond spreads
spiked the most during the global financial crisis compared to 2004 and then dropped the least among countries in 2013 although most of Singapore's corporate bonds have higher average credit ratings than other countries' corporate bonds.
Table 4 Predictions on Credit Spreads by Country
Corporate bond spreads (basis point) of 2004, 2008 and 2013 are predicted for each country. Estimated coefficients in column (6) of Table 3 and country dummy variables in Appendix E are used for calculations. Actual credit spreads on Asian and U.S. corporate bonds are tabulated for comparison.
Predicted Credit Spreads Actual Credit Spreads
2004 2008 2013 2004 2008 2013 China 393.38 2068.72 485.65 343.64 1689.96 488.63 Philippines - - 308.62 - - 411.93 India - 962.63 289.20 - 1476.41 360.95 Thailand 182.15 856.01 242.48 188.77 610.14 205.91 Taiwan - 876.38 235.40 - 584.73 225.32 Hong Kong 137.22 700.53 214.78 129.31 706.35 255.26 Korea 158.89 734.23 197.64 91.82 1266.60 151.89 Malaysia 122.40 543.93 174.61 95.92 727.21 198.33 Singapore 93.57 500.68 159.37 87.30 595.33 212.00 us - - - 83.00 604.00 128.00
2. Determinants of Corporate Bond Spreads by Sector
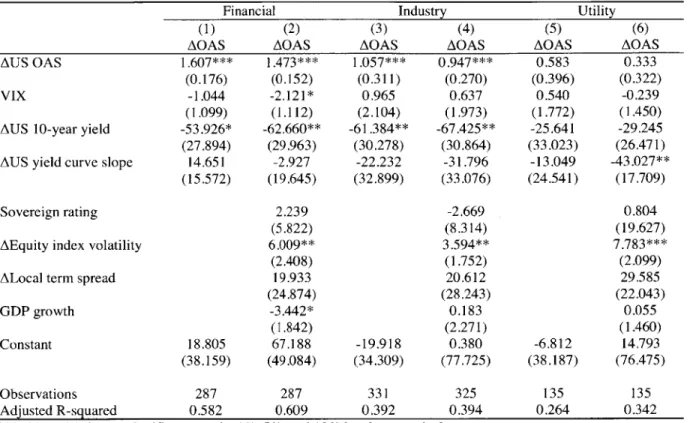
The next question regarding global factors is that there could be differences among individual sectors in terms of credit spread changes resulting from global market shocks. In general, debt service and profitability of financial institutions are directly affected by global financial markets, and thus global factors could play a more significant role in explaining credit risk of the financial sector. On the other hand, the utility sector would be relatively less affected by global factors due to its more stable cash flow.
Based on this intuition, I run pooled regressions of first-differenced Asian corporate bond spreads of each sector on global factors and country-specific factors. I focus on global factors and country-specific factors and thus omit bond indices characteristics which are not statistically significant in the preceding estimations. Even when they are included, however, the results remain similar. All regressions contain country dummy variables.
Table 5 summarizes the regression results. In line with my intuition, the explanatory power of global factors is higher in the financial sector than in the industry sector and in the utility sector. In the financial sector, the variation in global factors changes explains 61 percent of the variation in Asian corporate bond spreads changes. This is higher than the adjusted R-squared for the corporate sector overall shown in Table 2 (49 percent). Interestingly, the incremental change in explanatory power when country-specific factors are included in the regression is the highest in the utility sector (column 5 and 6). These findings supports the intuition that global factors have the greatest predictive power in the financial sector and that local conditions are more important for the utility sector.
Table 5 Corporate Bond Spreads Determinants by Sector
Using quarterly unbalanced panel data from 2000 to 2013, I run regressions of first-differenced Asian corporate bond spreads on the variables listed below with country dummy variables. The dummy variables are not reported in this table. Clustered standard errors by quarter are in parentheses.
Financial Industry Utility
(1) (2) (3) (4) (5) (6)
AOAS AOAS AOAS AOAS AOAS AOAS
AUS OAS 1.607*** 1.473*** 1.057*** 0.947*** 0.583 0.333
(0.176) (0.152) (0.311) (0.270) (0.396) (0.322)
VIX -1.044 -2.121* 0.965 0.637 0.540 -0.239
(1.099) (1.112) (2.104) (1.973) (1.772) (1.450)
AUS 10-year yield -53.926* -62.660** -61.384** -67.425** -25.641 -29.245 (27.894) (29.963) (30.278) (30.864) (33.023) (26.471) AUS yield curve slope 14.651 -2.927 -22.232 -31.796 -13.049 -43.027**
(15.572) (19.645) (32.899) (33.076) (24.541) (17.709)
Sovereign rating 2.239 -2.669 0.804
(5.822) (8.314) (19.627)
AEquity index volatility 6.009** 3.594** 7.783***
(2.408) (1.752) (2.099)
ALocal term spread 19.933 20.612 29.585
(24.874) (28.243) (22.043) GDP growth -3.442* 0.183 0.055 (1.842) (2.271) (1.460) Constant 18.805 67.188 -19.918 0.380 -6.812 14.793 (38.159) (49.084) (34.309) (77.725) (38.187) (76.475) Observations 287 287 331 325 135 135 Adjusted R-squared 0.582 0.609 0.392 0.394 0.264 0.342
***, **, and * denote significance at the 1%, 5%, and 10% level, respectively.
3. Asymmetric Effects of Global Factors
Could global factors have asymmetric impacts on credit spreads? This question has been explored by several academic researchers in terms of asymmetric effects of monetary policy on stock prices (Chen (2007) and Chulia, Martens, and Dijk (2010)). More recently, Zhu (2013) notes that the impacts of unanticipated monetary policy on credit spreads are more noticeable in economic recessions than in economic booms.
Based on the previous research, I focus here on capturing an asymmetric relation between the U.S. monetary policy rate and U.S. credit spreads. I use the U.S. 3-month Treasury yield instead of the U.S. 10-year Treasury yield because the former is a better proxy for the monetary policy rate due to its higher correlation with the U.S. federal funds rate (correlation coefficient 0.99). Extending the work of Collin et al. (2001) to account for asymmetric impacts of global factors and country-specific factors, I implement the following regression for each country i at quarter t:
A OASit = ai + y1(AUS 3 - month yield)t Dt + y2(AUS 3 - month yield)t(1 - Dt)
where all variables except for the U.S. 3-month Treasury yield and sign dummy variables remain the same as in model specification (1), AUS 3 - month yieldt is the change in the U.S. 3-month Treasury yield from quarter t-1 to quarter t, and Dt takes the value of 1 if AUS 3 - month yieldt > 0 and 0 otherwise. I omit bond indices characteristics in the regressions.
The estimates of the regression are reported in Table 6. The results indicate that Asian corporate bond spreads show different responses depending on the direction of the change in the U.S. 3-month Treasury yield; the movement of Asian corporate bond spreads appears more noticeable when the U.S. 3-month Treasury yield decreases. The coefficients of negative changes in the U.S. 3-3-month Treasury yield show negative signs and are statistically significant in all sectors except the utility sector, and the magnitude of the coefficients is the greatest in the industry sector. The economic significance is considerable. In case of the corporate sector, a one percentage point decrease in the U.S. 3-month Treasury yield changes is associated with a 82 basis point increase in Asian corporate bond spreads changes. But positive changes in the U.S. 3-month Treasury yield do not show significant coefficients. It can be inferred from this finding that Asian corporate bond spreads is more closely related to monetary easing than monetary tightening. This asymmetric relation might be explained by the behavior of investors. Monetary easing is a policy in response to economic downturns in the U.S., in which case Asian economies would also get hurt, and investors take economic recessions more seriously than economic booms. As a result, Asian corporate bonds become riskier in times of monetary easing.
To examine asymmetric effects of U.S. credit spreads, I substitute U.S.
OAS
for the U.S. 3-month Treasury yield in model (3) and estimate the following regression:A OASit = ai + y1AUS OASt Dt + y2AUS OASt (1 - Dt) + 31,AGFt + /32ACFit + Eit (4)
where AUS OASt is the change in U.S. corporate bond
OAS
from quarter t-1 to quarter t, and Dt takes the value of 1 if AUS OASt > 0 and 0 otherwise.The estimates of the coefficients are presented in Table 7. In all sectors except the utility sector, credit spreads on Asian corporate bonds show more considerable responses to positive changes in U.S. corporate bond spreads. The coefficients of both positive and negative changes in U.S. corporate bond spreads are of positive sign and statistically significant, but the coefficients of positive changes in U.S. corporate bond spreads are larger in sizes than those of negative changes. The economic significance is substantial. In the corporate sector, when changes in U.S. corporate bond spreads go up (down) by one percentage point, changes in Asian corporate bond spreads increase by 1.9 percentage point (decrease by 0.5 percentage point). This indicates that changes in Asian corporate bond spreads have weak asymmetric relation with changes in U.S. corporate bond spreads.
Table 6 Asymmetric Impacts of Monetary Policy
Using quarterly unbalanced panel data from 2000 to 2013, I run regressions of first-differenced Asian corporate bond spread on the variables below. The positive (negative) AUS 3-month Treasury yield is an interaction term between AUS 3-month Treasury yield and positive (negative) sign dummy variable, which takes the value of
1
for the positive (negative) sign of AUS 3-month Treasury yield and 0 otherwise. Country dummy variables are included in all sectors, but not reported in this table. Clustered standard errors by quarter are in parentheses.AUS OAS
Positive AUS 3-month yield Negative AUS 3-month yield
VIX
AUS yield curve slope
Sovereign rating AEquity index volatility ALocal term spread GDP growth Constant Corporate (1) AOAS 0.973*** (0.215) -63.099 (52.492) -81.988** (33.152) 0.354 (1.440) -97.452** (44.023) -3.572 (5.978) 3.569** (1.567) 6.312 (20.398) -0.499 (1.594) 13.640 (54.575) Financial (2) AOAS 1.492*** (0.177) -59.876 (37.487) -74.493** (34.010) -1.975* (1.117) -81.571* (48.025) 0.203 (5.848) 5.498** (2.400) 10.373 (22.140) -3.521* (1.986) 71.785 (47.773) Industry (3) AOAS 0.903*** (0.276) -81.383 (65.656) -104.004** (45.862) 0.466 (1.945) -129.553** (54.555) -3.785 (7.773) 2.92 1* (1.715) 11.029 (26.611) -0.054 (2.177) 9.507 (77.401) Utility (4) AOAS 0.350 (0.353) -44.304 (44.951) -40.756 (40.748) 0.036 (1.506) -90.377** (35.056) -4.490 (11.957) 7.783*** (2.420) 6.144 (23.410) -0.251 (1.503) 35.734 (55.419) Observations 351 Adjusted R-squared 0.491
***, **, and * denote significance at the 1%, 5%, and
287 0.605
10% level, respectively.
Table 7 Asymmetric Impacts of U.S. Corporate Bonds
Using quarterly unbalanced panel data from 2000 to 2013, I run regressions of first-differenced Asian corporate bond spreads on the variables below. The positive (negative) AUS corporate bond
OAS
is an interaction term between AUS corporate bondOAS
and positive (negative) sign dummy variable, which takes the value of1
for the positive (negative) sign of AUS corporate bond OAS and 0 otherwise. Country dummy variables are included in all sectors, but not reported in this table. Clustered standard errors by quarter are in parentheses.Corporate (1) Positive AUS OAS
Negative AUS OAS
AUS 3-month yield
VIX
AUS yield curve slope
AOAS 1.922*** (0.648) 0.529*** (0.141) -44.587 (31.834) -1.782 (1.116) -91.647* (45.653) Financial (2) AOAS 1.869*** (0.631) 1.330*** (0.253) -57.868* (30.263) -2.889** (1.121) -79.819 (48.526) Industry (3) AOAS 2.197*** (0.784) 0.366** (0.176) -43.413 (40.568) -2.276 (1.471) -118.975** (55.356) Utility (4) AOAS 1.608*** (0.521) -0.118 (0.210) 24.493 (31.424) -3.270*** (0.879) -69.946** (32.249) 325 0.402 150 0.247
Sovereign rating 1.672 2.697 -0.267 3.305
(6.527) (6.020) (8.453) (19.161)
AEquity index volatility 3.071* 5.328** 2.348 6.999***
(1.822) (2.425) (2.131) (1.802)
ALocal term spread 15.861 14.229 29.326 36.607*
(20.850) (23.741) (26.014) (19.337) GDP 0.159 -3.411* 1.267 0.723 (1.498) (1.883) (2.417) (1.342) Constant -1.390 69.138 2.354 34.009 (53.956) (48.270) (77.445) (69.925) Observations 351 287 325 135 Adjusted R-squared 0.525 0.609 0.443 0.436
***, **, and * denote significance at the 1%, 5%, and 10% level, respectively.
4. Principal Component Analysis
My estimation results so far demonstrate that global factors have the greatest explanatory power for changes in Asian corporate credit risk, and among them, U.S. corporate bond spreads and the U.S. 10-year Treasury yield are the most significant determinants. However, it is possible that other omitted variables would better capture systemic variations in Asian credit spreads. To investigate this possibility, I conduct principal component analysis of Asian corporate bond spreads and the residuals of regressions. Principal component analysis requires that variables span identical time periods and that there are no gaps within time series. Due to my unbalanced panel dataset, I select the period from the fourth quarter of 2004 to the fourth quarter of 2013 where there are no such gaps. That excludes Taiwan, India, and the Philippines, for which the first reported OAS starts after the fourth quarter of 2004. The balanced panel dataset includes six countries: China, Hong Kong, Korea, Malaysia, Singapore, and Thailand.
With the modified panel dataset, I first run the same regressions as in model specification (1) in order to examine whether the regression results remain unchanged with the sub-period sample. Then, I implement principal component analysis. Table 8 reports the regression estimations for 2004.4Q-2013.4Q, and the regression results for 2000.1
Q
-2014.4Q in Table 2 are presented for comparison. The coefficients of U.S. corporate bond spreads and the U.S. 10-year Treasury yield have the same signs for both time periods, but increase slightly in magnitude for the sub-period. The equity index volatility loses statistical significance in the shorter sample. The reason is because the period of the early 2000s, when equity volatility was globally high due to the dotcom boom and bust, is excluded from the regression. But global factors and country-specific factors still account for large proportion of variations in Asian corporate bond spreads changes. Taken together, the regressions for both periods exhibit similar results in terms of the explanatory power and the statistical significance of coefficients.Table 8 Determinants of Corporate Bond Spreads: 2004.4Q-2013.4Q
Using quarterly balanced panel data from 2004.4Q to 2013.4Q, I run regressions of first-differenced Asian corporate bond spreads on the variables listed below with country dummy variables. The dummy variables are not reported in this table. Countries are China, Hong Kong, Korea, Malaysia, Singapore, and Thailand. For comparison, the regression results for 2000.lQ-2013.4Q in Table 2 are also tabulated. Clustered standard errors by quarter are in parentheses.
2004.4Q-2013.4Q 2000.1 Q-2013.4Q
(1) (2) (3) (4)
AOAS AOAS AOAS AOAS
ATime to maturity -13.699 -1.081 (9.497) (8.062) Aln(Amount Outstanding) 31.779 0.177 (28.527) (29.348) AUS OAS 1.031*** 1.014*** 0.974*** 0.973*** (0.198) (0.197) (0.202) (0.200) VIX -0.368 -0.250 0.278 0.283 (1.431) (1.394) (1.433) (1.422)
AUS 10-year yield -72.319** -74.070** -61.561** -61.511**
(27.815) (27.920) (25.007) (25.062)
AUS yield curve slope -11.467 -9.683 -15.541 -15.610
(23.368) (24.687) (23.349) (23.512)
Sovereign rating 5.475 4.756 -1.768 -1.777
(11.359) (11.258) (5.937) (5.818)
AEquity index volatility 1.820 1.792 4.272*** 4.271***
(1.605) (1.575) (1.551) (1.508)
ALocal term spread 48.006 48.360 15.792 15.867
(31.249) (31.853) (21.812) (21.677) GDP growth -1.128 -0.990 -0.506 -0.503 (1.823) (1.766) (1.640) (1.651) Constant -7.987 -13.469 7.454 7.318 (87.692) (88.509) (55.071) (55.630) Observations 216 216 351 351 Adjusted R-squared 0.565 0.564 0.490 0.487
***, **, and * denote significance at the 1%, 5%, and 10% level, respectively.
Using Asian credit spreads of six countries from 2004.4Q to 2013.4Q, I conduct principal component analysis and the results are summarized in Table 9. Panel A presents the analysis of corporate bond spreads and Panel B presents the analysis of regression residuals obtained from column (2) of Table 8. Panel Al shows that the first principal component explains as much as 88 percent of the variation in Asian corporate bond spreads, and the second principal component accounts for 6 percent. In other words, 94 percent of the variation in corporate bond spread changes is explained by two principal components, and the other principal components have small explanatory power. The contributions of each country to the first three components are also reported in Panel A2. All countries contribute to the first principal component noticeably, and unexplained proportion of all countries by the first three principal components are minimal.
Panel B reports results that contrast with Panel A. There is dispersion in explanatory power for each principal component. The first principal component explains 48 percent of the variation in regression
residuals, and the second and the third principal components account for 25 percent and 14 percent, respectively. There is not any single dominant component which captures variations in the regression residuals, and the first five principal components account for 97 percent of changes in the residuals. Furthermore, Panel B2 indicates that the unexplained proportion of changes in the residuals by the first three principal components ranges from 5 percent (China) to 22 percent (Singapore). All these results support the conclusion that changes in Asian corporate bond spreads are explained by only a few variables.
Table 9 Principal Component Analysis of Corporate Bond Spreads and Residuals
In Panel A, I conduct principal component analysis with quarterly corporate bond spreads of Asian corporations from 2004.4Q to 2013.4Q. Countries are China, Hong Kong, Korea, Malaysia, Singapore, and Thailand. In Panel B, I implement principal component analysis with the regression residuals obtained from column (2) of Table 8 over the same period.
Panel Al Principal Components: Corporate Bond Spreads
Compl Comp2 Comp3 Comp4 Comp5 Comp6
Eigenvalue 5.295 0.341 0.196 0.089 0.048 0.031
Difference 4.954 0.145 0.107 0.041 0.017
-Proportion 0.883 0.057 0.033 0.015 0.008 0.005
Cumulative 0.883 0.939 0.972 0.987 0.995 1.000
Panel A2 Loadings and Unexplained Proportion
Compi Comp2 Comp3 Unexplained
China 0.383 0.773 -0.106 0.017 Hong Kong 0.423 0.219 0.070 0.033 Korea 0.412 -0.412 -0.305 0.026 Malaysia 0.409 -0.334 -0.470 0.033 Singapore 0.423 0.053 0.009 0.050 Thailand 0.397 -0.265 0.819 0.009
Panel B I Principal Components : Residuals
Residuals Compi Comp2 Comp3 Comp4 Comp5 Comp6
Eigenvalue 2.896 1.473 0.820 0.335 0.268 0.209
Difference 1.423 0.653 0.484 0.068 0.059
-Proportion 0.483 0.245 0.137 0.056 0.045 0.035
Cumulative 0.483 0.728 0.865 0.921 0.965 1.000
Panel B2 Loadings and Unexplained Proportion
Residuals Compl Comp2 Comp3 Unexplained
China 0.186 0.625 -0.575 0.053 Hong Kong 0.515 0.141 -0.276 0.141 Korea 0.165 0.633 0.570 0.064 Malaysia 0.478 -0.041 0.501 0.130 Singapore 0.495 -0.214 -0.064 0.219 Thailand 0.447 -0.375 -0.118 0.204
5. Robustness Checks
I perform robustness checks with three other estimations. The first estimation with two-way clustered standard error is what Petersen (2009) and Cameron et al. (2011) suggest.5 The small number of country variables may be misleading to obtain a consistent standard error estimator, but I conduct a pooled regression of first-differenced Asian corporate bond spreads with country dummy variables (column
1
and 2). The second robustness check is a panel regression with fixed effect and clustered standard error by country variable (column 3 and 4). The third one is a random-effect panel regression with clustered standard error by country variable (column 5 and 6). The estimation results are presented in Table 8. The results are almost unaffected. Global factors are significant determinants of Asian corporate bond spreads. The magnitudes in point estimates change slightly and their statistical significance remains all the same except equity index volatility. The explanatory power of the regressions is also similar.Table 10 Robustness Checks with Other Estimations
Using quarterly unbalanced panel data from 2000 to 2013, I run regressions with three estimations. The first one is a pooled OLS with clustered standard error both by country and time. Country dummy variables are included in this regression but are not reported in this table. The second one is a fixed-effect panel estimation with clustered standard error by country, and the third one is a random-effect panel estimation with clustered standard error by country. Clustered standard errors are in parentheses.
Pooled OLS Fixed Effect Random Effect GLS
(Two-way clustered S.E.) (One-way clustered S.E.) (One-way clustered S.E.)
(1) (2) (3) (4) (5) (6)
AOAS AOAS AOAS AOAS AOAS AOAS
ATime to maturity -1.081 -1.081 0.034 (6.144) (7.127) (6.749) Aln(Amount Outstanding) 0.177 0.177 1.582 (35.029) (33.947) (32.585) AUS OAS 0.974*** 0.973*** 0.974*** 0.973*** 0.970*** 0.970*** (0.248) (0.243) (0.232) (0.228) (0.227) (0.228) VIX 0.278 0.283 0.278 0.283 0.332 0.329 (1.301) (1.259) (0.781) (0.714) (0.690) (0.742)
AUS 10-year yield -61.561*** -61.511*** -61.561*** -61.511*** -61.502*** -61.486*** (23.154) (23.245) (12.340) (12.435) (12.511) (12.376) AUS yield curve slope -15.541 -15.610 -15.541* -15.610 -15.040* -15.054*
(15.764) (16.075) (8.286) (8.599) (8.187) (7.873)
Sovereign rating -1.768 -1.777 -1.768 -1.777 -0.141 -0.127
(3.350) (3.162) (1.677) (1.983) (0.690) (0.718)
AEquity index volatility 4.272** 4.271** 4.272* 4.271* 4.304** 4.295*
(1.781) (1.663) (2.228) (2.164) (2.187) (2.234)
ALocal term spread 15.792 15.867 15.792 15.867 15.976 15.908
(19.139) (18.849) (13.690) (13.658) (13.519) (13.566) GDP growth -0.506 -0.503 -0.506 -0.503 -0.273 -0.273 (1.489) (1.451) (1.216) (1.176) (0.894) (0.917) Constant 7.454 7.318 6.194 5.947 -5.533 -5.427 (41.324) (41.060) (21.867) (22.388) (16.168) (17.871) Observations 351 351 351 351 351 351
Adjusted (within) R-squared 0.514 0.514 0.512 0.513 0.513 0.513
***, **, and * denote significance at the 1%, 5%, and 10% level, respectively.