Development and Implementation of a Flexible
Reporting Software Application
by
Enrique R. SiacaB.S. Electrical Engineering, Massachusetts Institute of Technology, 1988 Submitted to the Department of Electrical Engineering and Computer Science
and the Sloan School of Management in partial fulfillment of the requirements for the degrees of
MASTER OF SCIENCE IN ELECTRICAL ENGINEERING and
MASTER OF SCIENCE IN MANAGEMENT
In conjunction with the Leaders for Manufacturing Program at the Massachusetts Institute of Technology
May, 1994
@ 1994 Massachusetts Institute of Technology All rights reserved
Signature of Author
Certified by
Certified by
Accepted by
Accepted by
Deprtment of Electrical Engineering & Computer Science Sloan School of Management
May, 1994
Steven B. Leeb, Assistant Professor of Electrical Engineering Departmept of Electrical Engineering, Thesis Supervisor
James Ut rback, Professor of Management and Engineering Sloa.Schh Management, Thesis Supervisor
-'-Fre••
')"-;Fredei
~ R. MorgenthalerChairman,
9ommittee
on Graduate StudentsJeffrey A. Barks Associate Dean. Sloan Master's and Bachelor's Programs
Sri
Ty7~
J.L..11994
Development and Implementation of a Flexible Reporting Software Application
by
Enrique R. Siaca
B.S. Electrical Engineering, Massachusetts Institute of Technology, 1988 Submitted to the Department of Electrical Engineering and Computer Science
and the Sloan School of Management in partial fulfillment of the requirements for the degrees of
MASTER OF SCIENCE IN ELECTRICAL ENGINEERING and
MASTER OF SCIENCE IN MANAGEMENT
Abstract
The high-capacity 3 1/2" disk drive market provides suppliers with the opportunity to achieve differentiation through better service. Periodic product performance reports may help to improve service in three distinct ways. They can provide customers with commonly requested information, trigger feedback on the various reported metrics, and guide efforts to identify and solve specific customer problems.
This document discusses the development and implementation of a flexible software application capable of providing periodic, product performance reports to Digital Equipment Corporation's disk drive customers. The software application was eventually able to customize the reports, generate new reports, perform data updates, and handle new data sources. It was also flexible enough to accommodate organizational changes that could affect the report generation activities.
Thesis Supervisors:
Steven Leeb, Assistant Professor of Electrical Engineering James Utterback, Professor of Management & Engineering
Acknowledgements
I wish to acknowledge the Leaders for Manufacturing Program for its support of this work. Special thanks go to the people at Digital's Small Form Factor organization who put up with me for the six and a half months of the internship and gracefully answered all of my questions.
Thanks also go to my advisors, Dr. Jim Utterback and Dr. Steven Leeb for their guidance both during the internship and during the preparation of this document.
I also wish to acknowledge my manufacturing philosophy classmates for discussing their own experiences and helping me to better understand the total picture of the manufacturing enterprise. Their advise throughout the year has allowed me to distill from my internship experience a much better document than it would have been otherwise.
Finally, I would like to thank my mother Dina and my father Ram6n for their unwavering support and encouragement. Without them I would not have made it this far.
Table of Contents
A bstract...3 Acknowledgem ents... ... 5 Table of Contents ... ... 7 List of Figures...9 List of Tables... ... 11Ch. 1 Industry and Project Overview ... 13
1.1 Industry environment and supplier/customer com m unications ... 13
1.2 Improving communications between suppliers and custom ers ... ... 16
Ch. 2 Report Definition and Development...19
2.1 The information needs of the customer satisfaction group... 21
2.2 Definition of the customer product performance reports ... 26
2.3 Development of the customer product performance reports...30
2.3.1 Initial throw-away prototypes... .... 30
2.3.2 Report prototypes with real data ... 33
2.3.3 Towards the final reports...36
2.4 Contents of the customer product performance reports...44
2.4.1 Cover page and header information ... 45
2.4.2 Delivery performance section...45
2.4.3 Delivered quality section...46
2.4.4 Reliability performance section ... 48
Ch. 3 Definition and Development of the Software Application ... 51
3.1 Data collection and processing. ... 52
3.1.1 Searching for the data sources... 53
3.1.2 Evaluating the data collection and processing m echanism s ... 55
3.2 The data maintenance application...56
3.3 Report generation and distribution. ... 64
3.4 The reporting application ... 65
Ch. 4 Definition and Implementation of Process Activities ... 71
4.1 Definition of the activities associated with the new reports...71
4.2 Development of the data gathering and reporting activities...78
4.2.1 Initial implementation problems ... 78
4.2.2 Remaining problems ... 79
4.2.3 Implementation of the activities...80
4.3 Final location of the collected data... ... 81
4.4 Comments on the implementation of the reporting activities...83
Ch. 5 Description of the Developed Software... 85
5.1 Software overview ... 85
5.2 Data maintenance application description...86
5.2.2 Update architecture ... 90
5.3 Reporting application description...92
5.3.1 Report architecture ... 93
5.3.2 User interface... 95
5.4 Integration into the network environment ...96
5.4.1 The PC and the network... ... 96
5.4.2 Using network drives to transfer data...98
5.4.3 Obtaining Rdb data from the network ... 98
Ch. 6 Description of the Data Gathering & Report Generating Process ... 101
6.1 Execution of the data gathering and reporting activities ... 101
6.2 Problems with the execution of the activities ... 102
Ch. 7 Impact and Reactions to the Project ... ... 105
7.1 Review of the main project decisions ... 105
7.2 Feedback and reactions to the product performance reports...07
7.3 Suggestions for a better development approach...108
7.4 Suggestions for further research... ... 111
R eferences...113
List of Figures
Figure 1.1: Internship Project Activities ...17
Figure 2.1: Communication Path to Customers...20
Figure 2.2: Barriers between Data and Useful Information...24
Figure 2.3: From Current Practice to an Ideal Report... ... 29
Figure 2.4: Initial Throw-away Report Prototype...32
Figure 2.5: Throw-away Prototype Report with Real Data...34
Figure 2.6: Final Customer Product Performance Report...37
Figure 3.1: Flow of Data and Associated Tasks ... 52
Figure 3.2: Initial Concept for Maintenance Application...57
Figure 3.3: Main Menu of Data Maintenance Application... 59
Figure 3.4: Opening the Update Windows...60
Figure 3.5: Sample Update Query.... ... 60
Figure 3.6: Revised Data Maintenance Application Concept... 62
Figure 3.7: Initial Concept for Reporting Application ... 66
Figure 3.8: Main Menu for Reporting Application ... 67
Figure 3.9: Examples of Report Windows ... 68
Figure 3.10: Customization Window ... 69
Figure 4.1: Initial Concept for Reporting Activities ... 74
Figure 4.2: Revised Approach to Reporting Activities ... 77
Figure 5.1: Data Maintenance and Reporting Applications... 86
Figure 5.2: Relationship between Update Form and Update Macro...88
Figure 5.3: ACCESS BASIC Update Procedure...90
Figure 5.4: Viewing Information on Update Queries ... 92
Figure 5.5: Structure of Product Performance Reports ... 94
Figure 5.6: Digital's Small Form Factor Computer Network ...96
List of Tables
Delivery Performance Metrics ... 46
Delivered Quality Metrics ... 47
Reliability Performance Metrics ... 48
Examples of Required Data for Reports ... 55
Calls to an Update Procedure ... ... 89 Table 2.1:
Table 2.2: Table 2.3: Table 3.1: Table 5.1:
CHAPTER 1
Industry and Project Overview
This document describes the implementation of a flexible software
application developed to generate a series of product performance reports addressing internal and external information needs within a manufacturing organization. The work was performed during a 6 1/2 month internship at Digital Equipment Corporation's disk drive manufacturing facility in
Colorado Springs, Colorado. In particular, it involved work within the Small Form Factor organization which assembled and tested 3 1/2" hard disk drives for internal and external customers.
This chapter briefly introduces the relevant competitive aspects of the high-capacity disk drive industry that served to motivate the internship project. An overview of the research project then follows. The various stages and results of the project are then discussed in more detail in the subsequent chapters.
1.1 Industry environment and supplier/customer communications
In the 1970's, IBM built the first of what are known today as Winchester disk drives. These original drives were 14" in diameter and their primary
characteristic was an assembly of read/write heads and disks enclosed in a clean cavity. Over the years, Winchester disk drives have gradually decreased in diameter from 14" to 8" to 5 1/4" to the current industry leader, the 3 1/2"
drive. At the same time, their market has spread from mainframe storage applications to include personal computers and laptops.
Today, the high-capacity disk drive OEM1 business generates over two billion dollars in yearly revenues2 by supplying drives to high-end systems including microcomputers, workstations, and RAID3 systems. It is characterized by constant product innovations focused on increasing areal density4 and improving product performance characteristics such as how quickly a drive can find, read, and write data. These improvements must come without sacrificing the lower prices, better product quality, and higher reliability demanded by the market.
"[Areal density has] been rising at about 60% per year." s5
-Peter Franklin, business manager of OEM storage at Digital Equipment Corp.
"Traditionally, hard-drive prices drop between 5% and 6% per quarter. "6
-Peter Knight, senior vice president of systems development at Conner Peripherals Inc.
Within this fast paced environment, drive manufacturers fiercely compete to supply a limited number of OEM customers. The competition has turned the industry into one where both technological innovation and commodity pricing are necessary for a manufacturer to succeed.
10Original Equipment Manufacturer; customer that integrates the product into a larger system. 2
Computer Industry Forecasts, January 15, 1993.
3Redundant Arrays of Independent Disks.
4Areal density refers to the amount of data that can be stored on recording media per unit area.
5Computer Reseller News, December 20, 1993. 6IBID
The suppliers that are first to reach the market with new products have a distinct competitive advantage. Products must initially go through an expensive qualification process with OEM customers that might last several
weeks and involve hundreds of evaluation drives. Therefore, many
customers will only qualify two or three suppliers and ignore those that don't have a product available on time. Unless qualified suppliers perform poorly, latecomers then face a very uphill battle. They must convince customers that they can offer enough of a better product and service to warrant spending more money on additional qualifications.
Nevertheless, winners of a qualification cycle are faced with several other cycles during the year, forcing established suppliers to remain alert to changes in customer demands. These demands might include hardware as well as software changes to the drives, new bus interfaces for the drives, and more stringent labeling and packaging requirements. Manufacturers who are not able to quickly adapt to their customers' demands risk losing their customer base.
"The technology continues to move at a frantic pace. There's no question life cycles for products are shorter."7
-Greg Brashier, director of Storage Dimensions' LANStor Unit.
In particular, the level of required communication between supplier and customer is becoming particularly high in this business. Customers who put their brand names on the drives or install them in their systems want to be
7
notified about how the drives are performing. For example, information on manufacturing yields and the percentage of drives that fail during and after installation is increasingly being requested by customers. The causes of drive failures and corresponding corrective action plans are also important to customers.
The internship project was undertaken with the belief that a supplier that could establish a broad communication channel with its customers, and had a strong commitment to customer satisfaction, would develop a definite edge over its competitors. Such a supplier would be able to maintain strong links with its existing customers, react faster to their changing needs, and convince potential customers to consider it over other suppliers.
1.2 Improving communications between suppliers and customers
In an attempt to broaden the communications between Digital and its OEM customers, the internship project introduced a series of monthly product performance reports for the different hard drive models purchased by Digital's customers. These reports were eventually made available to the people working directly with customers. The new information was expected to generate questions that would improve communication between the Small Form Factor organization, the customer contacts, and the customers, as well as within different functional areas of the Small Form Factor organization.
The general progress of the project consisted of three distinct definition activities starting with the creation of a sample product performance report. This activity was followed by the development of the software tools necessary
for the periodic generation of the reports, and the definition of the steps required for using the software and generating the reports.
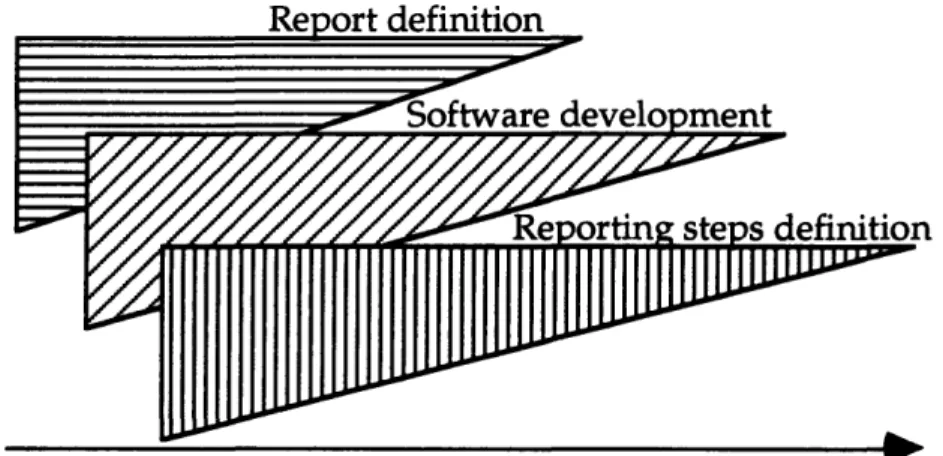
Figure 1.1 shows the overlap of these three definition activities over time. The triangular shapes are intended to represent a move from the initial broad definitions to the more concrete ones that were later implemented.
PROJECT ACTIVITIES Report definition 7 -
Software
development1
P t - , cf-n Aý 4 AC4 v,% -44 j~IUIIU±WULW timeFigure 1.1: Internship Project Activities
The next three chapters will discuss these activities in order and the effect of their interactions on the various development efforts. First, Chapter 2 includes the development of the product performance reports from initial concept to final implementation. Chapter 3 describes the construction of the software tools that enabled the generation of the reports, while Chapter 4 follows the development of the activities related to the periodic generation of the reports. 71 I///•, ! ' !' ' ' ' • " " " i ~ " " ' N r N l " ' i i i i"iI
H
U
1
d
r////~/~ r~r~v~,rr·k v~ryu urrrru~rvr~W
0 L v LAfterwards, Chapter 5 gives a more detailed description of the main features of the softwareapplications that were developed, while Chapter 6 describes the final sequence of activities required to generate the reports. Finally, Chapter 7 provides the opportunity to step back and analyze the effects and impact of the product performance reports. Some comments will be provided on the events that followed the end of the internship and suggestions will be given for improving the development and implementation methodology of similar future projects.
CHAPTER 2
Report Definition and Development
This chapter will review the process by which a given information need and a series of reports to satisfy this need were identified during the internship. In particular, the chapter will show how a development approach using quick iterations followed by requests for feedback can integrate new information processing innovations quickly and effectively into an organization.
Before describing the information need that was addressed by the reports, some additional background on Digital's Small Form Factor organization is required. This manufacturing group belonged to a larger storage organization operating out of Massachusetts and having a business office that dealt directly with customers. Under this arrangement, Small Form Factor operated such that exposure to customers was mostly limited to receiving drive orders, returned drives, and occasional customer visits (usually by new customers that were thinking of qualifying a new product). As the organization moved to serve more and more external customers, the need for better
communication became apparent. For example, many customers changed order quantities and requested delivery dates and a lot of rescheduling effort was needed to accommodate these changes. Demands for modifications to the disk drives and for more and/or different drive tests were also being voiced by multiple customers.
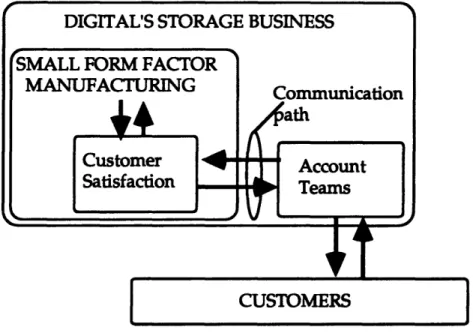
To attend to customer needs, a customer satisfaction group operated within the Small Form Factor organization. This group served as a link to a series of
account teams working directly with the customers. These account teams operated out of the separate storage business office and usually consisted of a sales representative, a manager for the account, and an applications engineer. The customer satisfaction group, in its role as a communication link, would bring feedback from the customers into the manufacturing decision making process, and provide information on the manufacturing operations to the
account teams. Figure 2.1 illustrates the position of the customer satisfaction group along the communication path between Small Form Factor
manufacturing and the customers.
Figure 2.1: Communication Path to Customers
Note again how the account teams belonged to an organization separate from Small Form Factor. This surfaced as a problem later on in that the
expectations on how the product performance reports would be used turned out to be inconsistent between customer satisfaction and the account teams.
With this in mind, an explanation will now be given of how poor access to information was a major hurdle to improved communications with
customers. Afterwards, discussion will center around the evolution of the product performance reports that were eventually created to address this communication need, from their initial conception to the actual final product.
2.1 The information needs of the customer satisfaction group
As a starting point, I would like to present an initial problem statement as it was posed by the customer satisfaction group. This initial problem definition will be explored in further detail, and the information obstacles that were found will then be discussed.
In brief, the problem faced by the customer satisfaction group can be stated as
follows:
Increasingly, customers demand more information on product and process performance metrics and there is no way to easily gather and communicate this information in a periodic, cohesive fashion.
In addition, the perception by the customer satisfaction group was that more customers would be demanding this information in the future, and that more detailed information would be demanded. Therefore, the mechanisms to gather data and generate reports including databases, software applications, and the activities related to their use needed to be in place to handle these new requests.
During the early part of the internship, the customer satisfaction group
provided a description of a variety customer information needs. In addition, memorandums, contracts, and other documents were provided to support the anecdotal information. The following signals pointed to a growing customer need for product information:
- Several customers were asking for product performance information: There
were information requests as part of the product qualification process, negotiated access to product and process information as part of new
contracts, and direct requests to account teams and customer satisfaction for product performance information.
- Account teams were asking for periodic information on product
performance: There were memorandums from account team members
asking for this information in order to work out customer complaints more effectively. In particular, some customers were generating their own
product performance information, and account team members did not have any internally provided information for comparison purposes.
- Competitors were already providing some information to customers: Some
account team members had seen samples of product performance reports provided by competitors. From the interviews performed, it appears that the competitor's reports contained general information on quality and reliability of the disk drives.
At the root of the problem with reporting the requested information was the way the information systems were organized and the data were shared within the manufacturing plant. The information systems within the plant could be characterized as isolated pockets of functional information. Different data was controlled and used by different groups, and there was no overall data architecture or translation mechanisms to tie the various systems together. More specifically, in collecting the data for the product performance reports, the following problems were encountered.
-Access: Data contained in multiple computer systems required separate user
accounts to become accessible. For an employee, this meant going to different system administrators to get the accounts, get approvals from a manager for each one, then get access to the data sources from the groups that managed the data, and finally, learn to use the different available interfaces to access the data.
-Interpretation: The meaning of the data was often unclear or misleading. There was some documentation available but it was frequently inadequate in providing a meaningful interpretation of the data. The best sources for gaining an understanding of what the data meant were the people who actually captured and maintained it through data-entry, execution of periodic file updates, etc. Even here, individual employees were often familiar with only portions of these activities and processes.
-Integrity: There were sources of errors from the data-entry process as well as
timing problems in accessing the data. The timing problems, in particular, required knowledge of. how often the data was entered, and how the
different files were updated. Changes in data collection procedures also introduced changes to the meaning of the data.
Figure 2.2 provides a graphical representation of how the occurrence of any of these three problems prevented the extraction of useful information from the available data.
Integrity
Figure 2.2: Barriers between Data and Useful Information
Examples of symptoms associated with these barriers included the following:
- Data was shared through electronic reports: Typically, users would receive
periodic reports from other functional groups through electronic mail. Ad hoc querying of databases to answer specific questions was the exception rather than the norm.
-Data that seemed the same was not the same in different systems: For
example, production and financial systems had fields to denote the
date meant the date when the product left the end of the production line (not necessarily the shipment date). In the case of the financial database, shipment date meant the date of a particular stockroom transaction and an extensive understanding of all the transaction types was required to
determine which ones were shipments.
- Information systems suffered both major and minor changes that affected the integrity of the data: Major changes occurred when new information
systems were introduced and the data from the older system was transferred to them. Minor changes within an information system developed over time as the existing system was adapted to new business needs8. These changes jeopardized the integrity of the data in the eyes of those not familiar with them.
As evidenced by these symptoms, a division existed between the people who maintained and used the data often, and the people who didn't use the data as frequently and therefore did not have the necessary knowledge to correctly interpret it.
This situation proved problematic because the customers were asking for data that cut across functional boundaries. Typically, a member of the customer satisfaction group would collect internal memos and reports and either incorporated them directly into a customer report or included a retyped and revised version of these with the following results:
8
For example, in one system a text field called REQUESTER was reassingned to capture customer request dates since no locations were originally set up to store this information.
-The presentation was not consistent across sections of a report.
-The reports used a lot of internal "lingo" that was hard for customers to
understand.
- The reports had to be assembled individually.
- Data not available from internal memos or reports had to be obtained and interpreted by the customer satisfaction representative.
2.2 Definition of the customer product performance reports
From the original conversations with members of the customer satisfaction group, they expressed a desire for solving the above problems by providing a
series of easy to generate customized reports to customers. These reports would contain a variety of information with different detail levels that could be included or excluded depending on the needs of each customer. These first conversations formed the basis for an initial broad description of the reports that would help address the varying information requirements of customers:
Periodic customer reports with product and process information that could be customized to incorporate specific customer requests.
These new reports would help the customer satisfaction group to classify product information by customer since each customer had its own assigned part numbers. The reports would also provide factual rather than anecdotal information to manufacturing on specific customer problems, and would lead to better efforts to solve these problems.
- Customers were becoming more demanding over time in their information requirements and it was believed that this trend would continue.
- An expanding customer base would mean that more customers would eventually be asking for the same type of information.
-Providing reports now would allow for the reporting of standardized product metrics whereas if customers were left to ask for the information, they would each be asking for a different set of metrics to be reported.
-Providing the reports before customers asked for them would reflect a willingness on the part of Digital to anticipate customer demands that would otherwise be lost if customers had to ask for the information.
-There were communication breakdowns with customers where the
perceived level of performance within Digital did not match the customer's perceptions and these breakdowns could be discovered through the use of the reports. Delivery performance was cited as an example here since
Digital measured to a scheduled shipment date and assumed that the carrier would deliver as promised while the reality at the customer site could be
different.
-There were customer specific issues that would be revealed by the
information and could then be addressed on a customer by customer basis. For example, differences in the handling of the drives at the customer sites
could be checked when the defective drives returned from one site greatly outnumbered those from another.
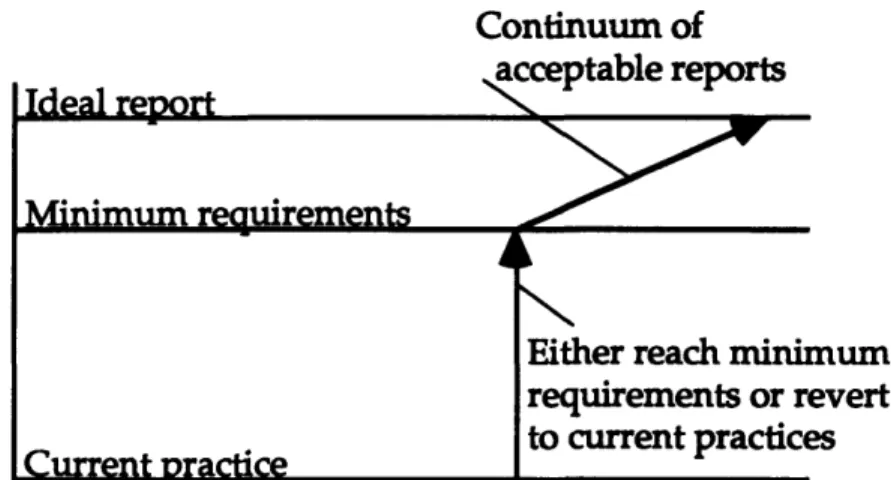
The initial concept for the new customer product performance reports was a broad definition of an ideal way to provide information to account teams and customers. The definition provided a long term vision that served as a reference point, and gave a broader context to the more limited scope of the internship project.
The internship project only targeted a "minimum requirements" or baseline report while laying the groundwork for later improvements through an appropriate report structure and flexibility features. The work incorporated the core tasks that had to be accomplished in order for the baseline report introduction to be successfully implemented. Future report features beyond the minimum requirements would increase the attractiveness of the product performance reports, and allow for their evolution and adaptability to
changing customer needs. Figure 2.3 describes the relationship between current practice (ad hoc reporting), a minimum requirements customer report, and an ideal report.
Continuum of acceptable reports Tdoal rpnort Minimum requirements Current oractice
Either reach minimum requirements or revert to current practices
Figure 2.3: From Current Practice to an Ideal Report
The minimum requirements for introducing a new product performance report to customers were developed as follows. First, an examination was performed covering the various internal memos requesting and offering product information, ad hoc reports that had been prepared already, and customer grade reports9. After reviewing this information, I asked the
customer satisfaction manager what were the requirements for offering a first cut report to the account teams in order to get their feedback.
-Information must be complete: The first cut report needed to include
delivery performance, delivered quality, and reliability performance information for each drive part number.
-Information must be valid: Any report presented to account teams for
feedback had to contain real data. That is, "Do not offer a sample report for feedback with information that you are not sure you can provide."
9Some customers provided Digital with evaluations on its performance as a supplier.
Tei a rpnot
""
-I11- --- -"~ ------>000ý
~C~~~~·C YIU~U~ I-Information must be available: Any report presented to customers needed
to be maintainable (i.e. could be generated periodically). In other words, "Do not ask for feedback on a report that you can not provide on a consistent basis."
These were somewhat generic requirements, but it must be remembered that no benchmark product performance reports existed at the time, and that the final reports would be dependent on the available information and the capabilities of the software that would create them. In addition, customer contacts would have some say on how the reports would look and fulfilling unnecessary requirements would only waste development effort.
2.3 Development of the customer product performance reports
Given that no benchmark report existed, and that information requirements would eventually be affected by feedback from account teams and customers, a prototyping strategy was used for developing the new reports. The basic strategy consisted of iterating through a series of report contents and formats in order to converge towards a final report. These iteration cycles will be discussed next.
2.3.1 Initial throw-away prototypes
The initial iteration cycles occurred when a throw-away report prototype was created to discuss the formatting of the data. First, talks with customer
satisfaction group members provided a sense of how the data would be presented and a preliminary sketch of what a report should look like. Then,
based on the information above, I created a sample report format. One
iteration was performed on this sample, and very little feedback was obtained from customer satisfaction.
This initial prototype report is shown in Figure 2.4. It contained simple metric information as well as time charts to show trends. Individual
shipments were also shown as it was felt that customers would also want to look at this information (particularly when orders were late). All was arranged on a single page for ease of distribution. Note that the algorithms for generating the metric information were not defined at this stage.
d1ilg it fal
Performance Report
Customer: Oem Inc.
Delivery Performance D"31t on
1 .o
6 month average on-time delivery 0.9
0.8
jj
7 ~0.7(0.60
Missed Order Information
Customer P.O.#ILine # Ordered/Shipped 133-0457 1 100 100
2 100 50 50
Delivered Quality
6 month average early life
experience
Reliability Performance
6 month average MTBF
IY~m]a
Date: June, 1993
Requested/Actual Receipt Date
06-18-93 06-18-93 06-18-93 06-21-93 06-21-93 07-01-93est. # Days Off +3 +3 +13
Figure 2.4 (a): Initial Throw-away Report Prototype
32 05
time deliverzse
.& Vb r pr ma M
DI53105
3 IMath szvivur..1 %I a-tx ahimst1 1.00 0.99 0. )7 0.97 0.94 0.95 - lb -y fty
SMYfz
foLxYd ar it .oo " 1 5 00.00- 500.00- 000.00- 500.00-J&u WeV lo u a nay J n I 0
o 0
The value of the first prototype was not in the feedback it generated, instead it served two important purposes. First, it communicated to customer
satisfaction the kind of data and the presentation capabilities that would be developed. Second, the template served as a basis for judging the adequacy of the reporting capabilities of the various software development tools that were later examined.
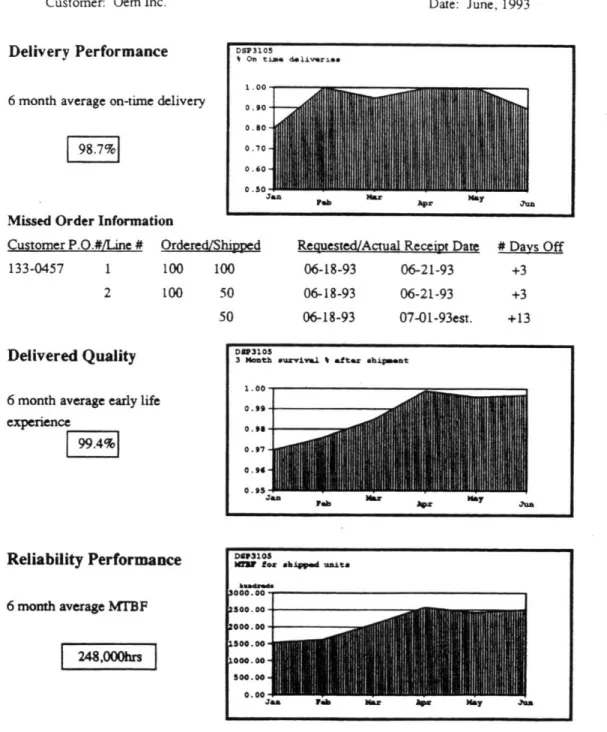
2.3.2 Report prototypes with real data
A second set of iterations was performed on throw-away prototype reports
with actual data. These reports were generated using the chosen software development platform (see next chapter) so as to demonstrate their feasibility. The customer satisfaction group showed significant interest and provided considerable feedback on these prototypes. Selected account team members also saw the reports and gave feedback on them.
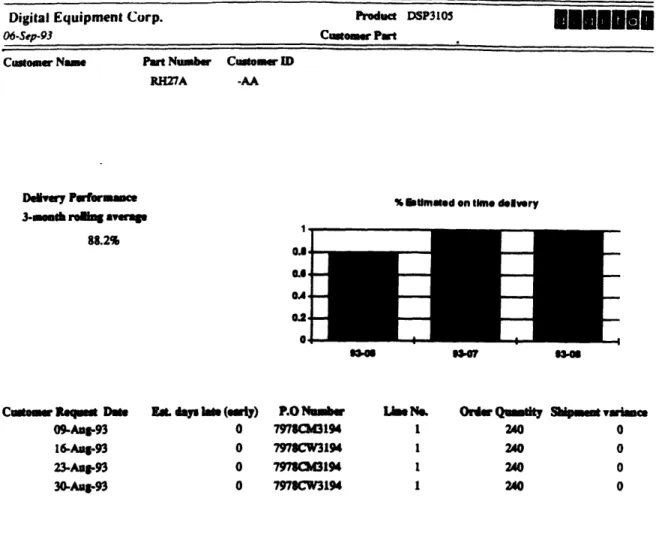
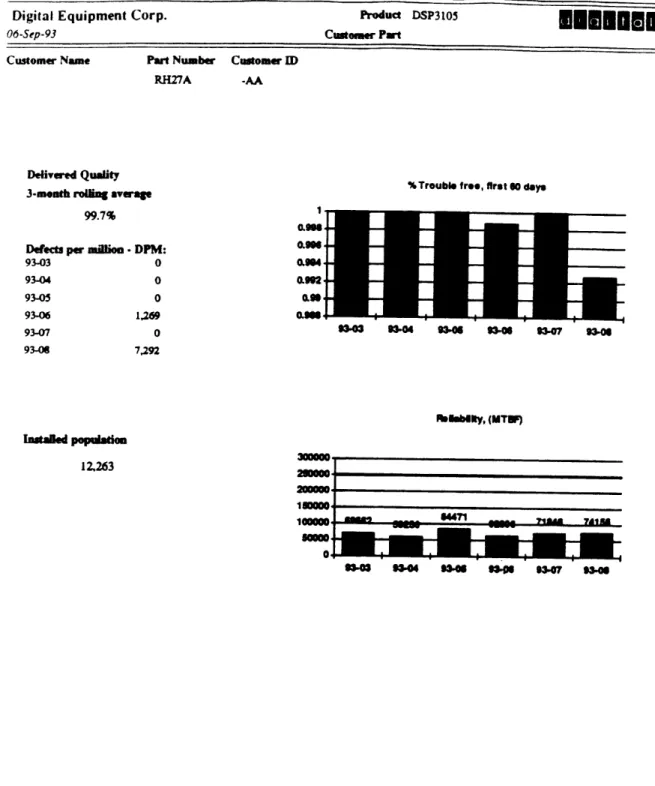
Figure 2.5 shows a sample report during this stage. The data requirements and algorithms necessary to generate the performance metrics were already defined for this report. Note also how the amount of information included grew from that of the initial prototype.
Digital Equipment Corp. Product DSP3105 long me
06-Sep-93 Cusomer Part
Customer Nam Part Number Customr ID
RH27A
DeYe7 Performuamce
3-moeth roing average
88.2%
% biUmated on time delvery
3347 93
C .mtomr Requm Dae Et. day. lat (a•ly)
09-Aug-93 0 16-Aug.93 0 23-Aug.93 0 30-Aug-93 0 P.O Number 79780C3194 7978CW3194 7978043194 7978CW3194 Lhe N 1 I 1 1 1 Ordw QUtity 240 240 240 240 Skipmet varimce 0 0 0 0 o
Digital Equipment Corp.
06-Sep-93
Product DSP3105 Customer Part
Part Number Customer ID
RH27A -AA
Delivered Quality
3-month rolling averae
99.7%
Defects per mulion -DPM:
93-03 0 93-04 0 93-05 0 93-06 1.269 93-07 0 93-08 7,292
%Trouble tree, first so60 days
1 am 0.99 uAsM btiMlty, (MTUF) Istaed poplation 12263
Figure 2.5 (b): Throw-away Prototype Report with Real Data Customer Name
The customer satisfaction group used this prototyping stage to evaluate and decide whether to accept the reports. Several modifications were made to the product performance reports during this stage but a particular report structure was not cemented and enough flexibility was maintained to accommodate the later feedback from account teams. Also, since most feedback was obtained during meetings of the customer satisfaction group, this evaluation stage allowed the customer satisfaction group members to confront their different ideas of how the reports should look.
Additional feedback was then obtained from a selected account team
members (as identified by the customer satisfaction group) which validated the general thrust of the reports. In addition, this feedback pointed to a need for more detailed information on product failures to direct improvement efforts based on the report data.
2.3.3 Towards the final reports
The final prototyping iteration cycles were performed on an evolutionary report prototype that became the final product performance report. Figures
2.6 (a) thru (g) show an example of the product performance reports that were
I I W19w I
Product Performance Report
Delmonico Inc. For the month of: 93-11
Products Included:
DSP3105
DSP3210
PRODUCT PERFORMANCE REPORT FOR: Customer Name
Delmonico Inc.
Internal Part No. RH27A -PW
Sales Part No. Customer Part No.
DSP3105
Delivery Performance
3-month rolling average
100.00%
Delivery Performance is estimated by comparing
the actual ship date and expected transit time to the customer request date. A detailed description of the
algorithm used is available upon request.
Units shipped during the month of : 93-11 Customer Request Date Est. days early (late)
02-Nov-93 0 0 04-Nov-93 0 04-Nov-93 0 0 09-Nov-93 0 0 11-Nov-93 0 16-Nov-93 0 16-Nov-93 0 0 16-Nov-93 17-Nov-93 19-Nov-93 22-Nov-93 23-Nov-93 29-Nov-93
% Estimated on time delivery
1 0.98 0.96 0.94 0.92 0.9 0.8 9307 93-08 9309 93-10 93-11 P.O Number 29012574 29012603 28008330 28008462 28090345 20071166 20071180 20071166 20071166 20071166 20071166 20071166 29012644 20071166 20071166 25989811 20071166 Shipped Quantity 43 120 28 12 160 120 210 120 80 20 0 200 20 120 6 120 120 200 120 Digital Comfidential
Figure 2.6 (b): Final Customer Product Performance Report (Delivery)
93-11 Capacity
1.05 GB DIGITAL EQUIPMENT CORPORATION
PRODUCT PERFORMANCE REPORT FOR: Customer Name
Delmonico Inc.
Internal Part No. Sales Part No. Customer Part No. RH27A -PW DSP3105
Delivered Quality
3-month rolling average
6,364 DPM
Delivered Quality is based on field returns and is an assessment of the performance of the product for its first 60 days, primarily in our customer's facilities.
DPM = 1o.o000oxmauality returns for montlshipments for month)
Where quality returns are units returned within
60 days of shipment. A description of the
detailed algorithm used is available upon
request.
Delivered Quallty In Defects Per Million
'IPN w 15000 10000 5000 0 -93408 93-07 93-0 93-00 93-10
oelvered Quality for thtlre Customer Base 1000 3500 3000 so00 93-11 92-0 33.07 9206 9241 33.10 33.11 l tiiD C fld d l
Figure 2.6 (c): Final Customer Product Performance Report (Quality)
93-11
Capacity
1.05 GB
r
DIGITAL EQUIPMENT CORPORATION
DIGITAL EQUIPMENT CORPORATION Customer Name
Delmonico Inc.
Internal Part No.
RH27A -PW
PRODUCT PERFORMANCE REPORT FOR: 93-11
Sales Part No. Customer Part No. Capacity
DSP3105 1.05 GB
Reliability Performance INabily, (MTBF)
Customer's Installed population
14,122 Customer's
Total units shipped
19,394 300000. 250000. 200000-150000. 100000. 50000-a p p 4. -1 I -I 93-06 9347 93O 93.00 4 93-10 93-11
Ilabily for Ehtre Customer 8se
= p p p
Reliability Performance is an estimate of
field performance at end-user applications,
based on quantity of units shipped and field
returns. A detailed description of the algorithm used is available upon request.
200000 150000 100000 I - I -I - I - I -. 9306 93.47 93.09 93-09 93-10 93-11 Digital Confd•mtdal
Final Customer Product Performance Report (Reliability)
RanM
v v
! v v v v v r
DIGITAL EQUIPMENT CORPORATION
Customer Name Internal Part No. Delmonico Iac. RE20E -PW
PRODUCT PERFORMANCE REPORT
FOR:-Sales Part No. Customer Part No.
DSP3210 NONE
Delivery Performance
3-month roiling average
L 100.0%
Delivery Performance is estimated by comparing the actual ship date and expected transit time to the customer request date. A detailed description of the algorithm used is available upon requst.
Units shipped during the month of : 93-11 Customer Request Date Est. days early (late)
02-Nov-93
% Estimated on time delivery 1-o.8 -0A 0A 93409 93-10 P.O Number 29012602 29012603 20945693 29807676 Shipped Quantity 2 10 10 30 DiSital Coideadl
Figure 2.6 (e): Final Customer Product Performance Report (Delivery)
93-11
Capacity
2.10 GB
93-11
DIGITAL EQUIPMENT CORPORATION
Customer Name Delmonico Inc.
Internal Part No. Sales Part N Customer Part No.
RH20E -PW DSP3210 NONE
Delivered Quality
3-month rolling average
0 DPM
Delivered Quality is based on field returns and is an asessment of the performance of the product for its first 60 days, primarily in our customneds facilities.
DPM = (L,000,000xaquality returns for montlI'
[shipments for monthl ) Where quality returns are units returned within
60 days of shipmenL A description of the
detailed algorithm used is available upon
request.
Delvered Cualiy in Defects Per Mlbon 3000 2000 1I00 500 0 340 3-10 93-11
Dllvered Qualy for btlrt Customer ose
3500. 3000. 2500-2000. IaM. 1000. SM. 0. * * 4-93 913-07 038 3.0 3-10 93-11 Dltad CAdlIW
Final Customer Product Performance Report (Quality)
93-11
Capacity
2.10 GB PRODUCT PERFORMANCE REPORT FOR:
0-+-I
DIGITAL EQUIPMENT CORPORATION
Customer Name Delmonico Inc.
Internal Part No.
RH20E -PW
PRODUCT PERFORMANCE REPORT FOR:I
Sales Part No. Customer Part No.
DSP3210 NONE Reliability Performance Customer's Installed population 30 Customer's
Total units shipped
182
Reliability Performance is an estimate of
field performance at end-user applications, based on quantity of units shipped and field returns. A detailed description of the
algorithm used is available upon request.
tblabwty, (MTWl 001M. 00000. 100000 -0. -N
400000
9H ona mom 0. 3,-11Itlablty for Belre Customer Sse
93-07 308 93.0 10 13.11
Disita Co.fldem d
Figure 2.6 (g): Final-Customer Product Performance Report (Reliability)
93-11 Capacity
210 GB
r v v
From the customer satisfaction group's perspective, this stage did not
represent significant changes to the content of the reports. On the other hand, this stage signaled that a report architecture and a report generation process were now in place and that availability of the product performance reports would not be a problem.
Additional feedback was obtained at this stage from other account team members. This new round of feedback uncovered the fact that certain
account team members (particularly those involved in sales) were looking at the reports as a marketing tool and wished to report only "benign"
information to customers. Taking different cuts of the data (by application, customer type, etc.) was suggested as a way to better achieve the marketing potential of the reports, but customer satisfaction did not view the reports as a product marketing tool.
Finally, during this stage some account team members suggested that other storage products (i.e. tapes) should be included with the reports since
customers would want to have information for them too. This issue reached beyond the Small Form Factor organization and was not resolved by the end of the internship.
2.4 Contents of the customer product performance reports
A product performance report consists of a cover page and a page each for the
delivery performance, delivered quality, and reliability performance of every disk drive part number included in the report.
2.4.1 Cover page and header information
The cover page (Figure 2.6 (a)) includes the name of the customer that
purchased the drives, the month covered by the report information, and a list of the drive sales part numbers that will be covered in the report. Inside the report, the page headers also contain the customer name, and month
information. In addition, the headers provide the capacity of the
corresponding drive for that page plus a box with the part numbers that designate the drive at the customer's organization, at Digital's sales
organization, and at the Small Form Factor organization. This box therefore serves as a translation mechanism when people from different organizations refer to the same disk drive model.
2.4.2 Delivery performance section
The delivery performance section (Figure 2.6 (b) & (e)) contains a column graph with up to six months worth of delivery performance information, a three-month aggregate delivery metric, as well as information on individual shipping transactions. Table 2.1 shows the equations used for generating the delivery performance metrics.
METRIC EQUATION
Delivery performance (#on time shipments during the month)*
expressed as % (for the (#shipments during the month)
graph)
3-month aggregate (#on time shipments during last 3 months)
delivery performance (#shipments during last 3 months)
expressed as
%
I* i.e. #on time shipments = Number of on time shipments based on scheduled ship date.
Table 2.1: Delivery Performance Metrics
The graph serves to show delivery trends for a given customer while the shipment information provides the volume of drives requested by the customer as well as of the how large and how late or early were the missed orders.
Note also that on time shipments are based on meeting a scheduled ship date so that variations in transit time are not taken into consideration.
Information on when the order actually was received by the customer is not available for inclusion in the reports. Also, delayed orders sometimes
shipped via a faster carrier to make up the time and the original scheduled ship dates were left unchanged so that these orders would be counted late when in fact they were on time.
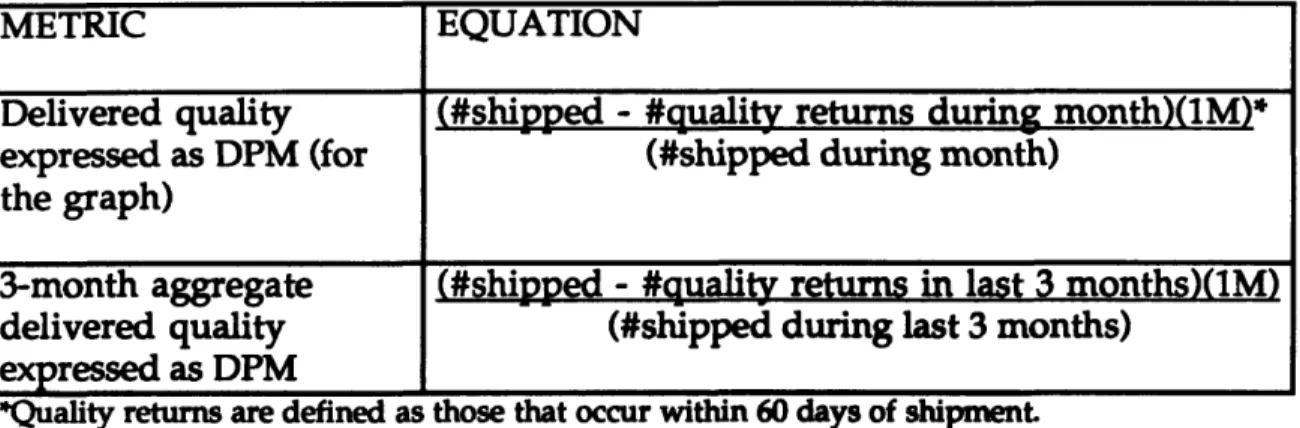
2.4.3 Delivered quality section
The delivered quality section (Figure 2.6 (c) & (f)) contains two column graphs with up to six months worth of delivered quality information for a specific customer's part number and for the total population of drives of that capacity
and size. It also contains a three month aggregate quality metric expressed as defective units per million (DPM). Table 2.2 shows the equations used to generate the delivered quality metrics.
METRIC EQUATION
Delivered quality (#shipped - #quality returns during month)(1M)*
expressed as DPM (for (#shipped during month)
the graph)
3-month aggregate (#shipped - #auality returns in last 3 months)(1M)
delivered quality (#shipped during last 3 months)
expressed as DPM
*Quality returns are defined as those that occur within 60 days of shipment
Table 2.2: Delivered Quality Metrics
The graphs serve to show quality trends for a given customer and to compare the performance of the customer's drive with the total population of similar drives (i.e. same capacity and size). The constant line through each graph represents the quality goal for the product.
The delivered quality metric is designed to catch drive problems that occur at
the OEM customer's manufacturing facility. As such, this is the metric that
would reflect problems with the handling of the drives.
Note also that the delivered quality metric is susceptible to wide swings due to changes in shipment volumes. For example, a customer that receives 100 drives in a given month and returns 10 drives from a much larger shipment the previous month will show 100,000 DPM for that month which is
misleading (i.e. the customer is not necessarily returning 10% of all drives). This effect is less pronounced when viewing the 3-month aggregate metric.
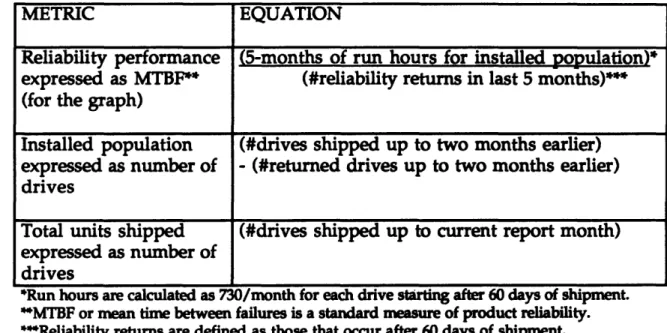
2.4.4 Reliability performance section
Finally, the reliability performance section (Figure 2.6 (d) & (g)) contains two column graphs with up to six months worth of reliability information for a specific customer's disk drives and the total population of drives of that capacity and size. It also contains an estimate of the installed population of the customer's drives and the total drives shipped up to date. Table 2.3 shows the equations used to generate the reliability performance metrics.
METRIC EQUATION
Reliability performance (5-months of run hours for installed population)*
expressed as MTBF** (#reliability returns in last 5 months)***
(for the graph)
Installed population (#drives shipped up to two months earlier) expressed as number of - (#returned drives up to two months earlier) drives
Total units shipped (#drives shipped up to current report month) expressed as number of
drives
*Run hours are calculated as 730/month for each drive starting after 60 days of shipment.
*MTBF or mean time between failures is a standard measure of product reliability. ***Reliability returns are defined as those that occur after 60 days of shipment.
Table 2.3: Reliability Performance Metrics
As in the delivered quality case, the graphs here serve to show trends for a given customer and to compare the performance of the customer's drive with the total population of similar drives. The constant line through each graph represents the reliability specification for the product.
The installed population number tries to capture the number of drives that have left the OEM manufacturing site and are installed in working systems. It serves as a guideline to how stable the reliability metric is because reliability performance tends to jump significantly while the installed population is small. Total units shipped can be used to determine whether additional drives will soon be installed and how much of an effect they will have on near term reliability performance.
CHAPTER 3
Definition and Development of the Software Applications
This chapter contains a detailed description of how the project's twocomplementary software applications were conceptually defined, as well as how they were developed. The discussion will show how organizational constraints influenced the many design decisions required to create the software applications that generated the product performance reports.
This development work was started immediately after the definition of the minimum requirements report and began with an analysis of the various tasks that would be required to provide periodic product performance reports. These tasks can be divided into four steps.
- Data Collection - Getting the required data from the various sources. - Data Processing -Operating on the collected data.
- Report Generation - Creating multiple reports from the processed data. - Report Distribution - Making the reports available to their audience.
All Data
]
= Data Collection: Queries,
Desired Data data entry, text file imports
Figure 3.1: Flow of Data and Associated Tasks
As the most complex steps, data collection and processing are discussed first along with the software application that was developed to perform them. Then, the discussion will shift to the report generation and distribution steps and to their corresponding software application.
3.1 Data collection and processing
Data collection can be defined as the tasks required to extract the desired data from the various sources within the manufacturing plant's computer
network. Data processing can be defined as the additional tasks required to transform the collected data into a form that could be used to generate reports. Before the development of the software to execute these tasks could begin, the data sources for the reports had to first be identified. After this was done,
several mechanisms to extract the desired data were then explored and the best ones selected.
3.1.1 Searching for the data sources
The obvious starting places for identifying the required data sources were Small Form Factor's internal reports and memos that were already being generated and shared with the account teams and customers. A list of the required data and its possible sources was then identified after informal
interviews with the originators of the internal reports and memos. This data included:
-Shipped and returned drives information kept on VMS/Rdb'0 relational
databases.
-Shipping transaction information on flat files" belonging to the financial/inventory system.
- Customer and part number information being transferred into a Microsoft
ACCESS12 database.
-Other data on part numbers and customers that was not kept in an organized fashion anywhere within the plant.
Selecting the final data sources from the original list required answers to additional questions. In some instances, the data were not available while in others the data were available from multiple sources. In these cases, several considerations were involved in determining which data would be used to generate the product performance reports. Questions included:
10Relational database management system for Digital's VAX/VMS architecture.
11Files containing unformatted data and used by older record management systems.
- Which source was original and which was a copy?
- Which source was most readily available?
-Which data approximated most closely the desired data?
- When did the data become available at each source?
-How closely did the data match that currently used for internal metrics?
Selection of the right data sources was not a static decision making process. The changing business practices and systems brought up the possibility that a given data source might need to be dropped in favor of another. In particular, changes to the order administration system and the database for returned drives were being considered but had not been implemented at the end of the internship. Nevertheless, the data sources selected to generate the product performance reports were:
- Warranty Returns Database: This Rdb relational database was picked as the
source for information on disk drives returned from customers.
-Inventory/Financial Database: This transaction system was selected as the
source of aggregate as well as individual order shipping information13.
-Drive Configuration Database: This Microsoft ACCESS database was picked
as the source of information on new disk drive families14, as well as customer specific part numbers.
13It is interesting to note here that the aggregate information did not match the individual
order information.
14Disk drive families were grouped according to capacity and the external dimensions of the
-Customer satisfaction group: The group was selected to provide and
maintain customer names & sites, drive storage capacity for each part number, and quality/reliability specifications for each disk drive family since this data was not available from existing data sources.
Table 3.1 shows a description of the various data needed to generate the reports. Each description is followed by a sample value and the name of the corresponding data source.
SAMPLE DATA AND SOURCE
Data Description Customer Name Part Number (Digital) Customer Specific Part No. Capacity
Quality/Reliability Specs Requested Shipment Date Actual Shipment Date Returned Date Sample Value Crossbow Intl. RH27A-AA Crossbow-1 1.05 GB 3K DPM/500K MTBF 02-JAN-1993 02-JAN-1993 10-FEB-1994 Data Source Customer Sat. Drive Config. Drive Config. Customer Sat. Customer Sat. Inventory Sys. Inventory Sys. Warr. Returns Table 3.1: Examples of Required Data for Reports
3.1.2 Evaluating the data collection and processing mechanisms
The work of creating the mechanisms for data collection and reporting was started while the definition of the data sources was still in progress. Several software tools were evaluated and the best ones were then selected.
The evaluation stage was an effort to establish the capabilities of the various software tools that could perform data collection and processing. It was
conducted through communication with users of the software, observation of how these software tools were already being used, and through the actual use of the tools. Evaluations were performed on:
- Structured query language (SQL5s) embedded in command files -Network server data querying/reporting applications
- PC data querying/reporting applications
-Network server special query files to generate reports (inventory system) - Network server spreadsheet applications
As a self-imposed constraint, the evaluations were limited to software tools known within the Small Form Factor organization and available on the manufacturing plant's computer network. These tools were abundant, and locally available know-how would be able to support them if necessary. At the end of the evaluation stage, Microsoft ACCESS SQL queries, along with some command files, were the mechanisms selected to execute the data collection and processing tasks. This final selection was a result of the maintenance application concept that will be discussed in the next section.
3.2 The data maintenance application
Two main alternatives were considered for performing the data collection and processing tasks; decentralized and centralized. A decentralized approach would allow different individuals within the customer satisfaction group to get the portion of the required data they were most familiar with, and would
15SQL (Structured Query Language) is a standard data definition and data manipulation language for relational databases.
require less effort of each individual. A centralized approach would simplify the process and the coordination necessary for these activities, but would place all the data collection burden on a single person. This person might be unfamiliar with some of the data and unable to check for inconsistencies.
A centralized PC based data maintenance application was only pursued after
an individual with the necessary PC hardware was assigned to collect the data and generate the reports. As envisioned, the software application would serve as the sole interface to all the data maintenance (collection &
processing) tasks. This single interface would hide from the user the details of the many and diverse tasks necessary for the generation of the report data. Figure 3.2 provides a simple schematic of this data maintenance application concept.
~~~~~~~~
ata
his application to obtain all the data for the reports.
Figure 3.2: Initial Concept for Maintenance Application
The maintenance application would have a main menu listing all the data updates to be performed, as well as customized windows for each update requesting specific information. Ideally, the person performing the data
collection and processing would only need to step through the menu of updates once a month in order to obtain all the necessary data for the reports. In addition, help features allowing modification and addition of updates would be in place to help the user to adapt to future data requirements.
Microsoft ACCESS was chosen as the software development platform for this application because of its report generating capabilities, as well as its ability to access Rdb databases on the network. The software development took the form of two distinct steps:
-Integration of data updates into a single user interface.
-Development of help/flexibility enhancing features.
The first step was implemented through the use of a main menu screen with a sequential list of the various update steps necessary to obtain the report data. The complexity behind the updates was captured within the data
maintenance application so that the update logic and network connections were hidden from the user. The user needed only to click on the menu buttons in sequence in order to perform the updates. Figure 3.3 shows the main menu window that the user saw when using the data maintenance application.