HAL Id: insu-01987279
https://hal-insu.archives-ouvertes.fr/insu-01987279
Submitted on 21 Jan 2019HAL is a multi-disciplinary open access
archive for the deposit and dissemination of
sci-L’archive ouverte pluridisciplinaire HAL, est destinée au dépôt et à la diffusion de documents
Probing Jovian broadband kilometric radio sources tied
to the ultraviolet main auroral oval with Juno
Masafumi Imai, Thomas K. Greathouse, William S. Kurth, George Randall
Gladstone, Corentin K. Louis, Philippe Zarka, Scott J. Bolton, John E. P.
Connerney
To cite this version:
Masafumi Imai, Thomas K. Greathouse, William S. Kurth, George Randall Gladstone, Corentin K. Louis, et al.. Probing Jovian broadband kilometric radio sources tied to the ultraviolet main auroral oval with Juno. Geophysical Research Letters, American Geophysical Union, 2019, 46 (2), pp.571-579. �10.1029/2018gl081227�. �insu-01987279�
Probing Jovian broadband kilometric radio sources
tied to the ultraviolet main auroral oval with Juno
Masafumi Imai1, Thomas K. Greathouse2, William S. Kurth1, G. Randall
Gladstone2, Corentin K. Louis3,4, Philippe Zarka3,4, Scott J. Bolton2, and
John E. P. Connerney5
M. Imai, masafumi-imai@uiowa.edu
1Department of Physics and Astronomy,
University of Iowa, Iowa City, Iowa, USA.
2Space Science and Engineering Division,
Southwest Research Institute, San Antonio, Texas, USA.
3LESIA, Observatoire de Paris, CNRS,
PSL, UPMC/SU, UPD, Place J. Janssen, Meudon, France.
4Station de Radioastronomie de Nanc¸ay,
Obs. Paris, CNRS, PSL, Univ. Orl´eans,
Nanc¸ay, France.
This article has been accepted for publication and undergone full peer review but has not been through the copyediting, typesetting, pagination and proofreading process, which may lead to differences be-tween this version and the Version of Record. Please cite this article as doi: 10.1029/2018GL081227
Observations of Jovian broadband kilometric (bKOM) radiation and ul-traviolet (UV) auroras were acquired with the Waves and Juno-UVS instru-ments for ∼2 hours over the northern and southern polar regions during Juno’s perijove 4, 5, and 6 passes (PJ4, PJ5, and PJ6). During all six time periods, Juno traversed auroral magnetic field lines connecting to the UV main au-roral ovals, matching the estimates of bKOM radio source footprints. The localized bKOM radio sources for the PJ4 north pass map to magnetic field
lines having distances of 10 to 12 Jovian radii (RJ) at the magnetic
equa-tor, whereas the extended bKOM radio sources for the other events map to
field lines extending to 20–61 RJ. We found the peak bKOM intensities
dur-ing Juno’s potential radio source crossdur-ings show positive, negative, and no correlations with the UV main oval brightness and color ratio. Only the pos-itive correlations suggest wave-particle energy transport.
Keypoints:
• First simultaneous observations of Jovian broadband kilometric radio source footprints and ultraviolet auroras were carried out using Juno
• Jovian broadband kilometric radio source footprints correspond to the UV main oval locations
5NASA Goddard Space Flight Center,
• Link of Jovian radio intensity during Juno’s near-source crossing with both brightness and color ratio of the UV main oval was investigated
1. Introduction
Jupiter is the strongest auroral radio source in our solar system, producing low-frequency radio emissions in a broad frequency range from 10 kHz to 40 MHz from both the northern and southern polar regions of the planet. These sporadic nonthermal bursts are called broadband kilometric (bKOM), hectometric (HOM), and decametric (DAM) radio emis-sions (Carr, Desch, & Alexander, 1983 ; Zarka, 1998 ; Clarke et al., 2004 ; Zarka, Cecconi, & Kurth, 2004 ; Imai, Imai, Higgins, & Thieman, 2011) and are generated via the electron cyclotron maser instability (Wu & Lee, 1979). The typical range of emission frequencies is between 10 kHz and 1 MHz for bKOM, between 300 kHz and 10 MHz for HOM, and between a few MHz and 40 MHz for DAM. The sources of these non-thermal emissions are distributed along auroral magnetic field lines at emission frequencies very close to the
local electron cyclotron frequency, fce (Kurth, Imai, Hospodarsky, Gurnett, Louarn, et
al., 2017 ; Kurth, Imai, Hospodarsky, Gurnett, Tetrick, et al., 2017 ; Imai et al., 2017a, 2017b). These sporadic bursts are believed to be the free space right-hand extraordinary (R-X) mode at various temporal scales from minutes down to milliseconds (Carr et al., 1983 ; Kurth et al., 2001 ; Imai et al., 2016).
The positive correlations between the intensity of Jovian auroral radio emission and ul-traviolet (UV) aurora brightness have been ascribed to either magnetospheric compression by the solar wind or internally driven disturbances in the inner magnetosphere. Using data from the International Ultraviolet Explorer and ground-based radio observatories in
Nan¸cay, France, and in Florida, USA, (Prang´e et al., 1993) first reported that
outstanding UV aurora event during 20-21 December 1990. This was attributed to an increase of particle precipitation via solar wind driven compression of the Jovian magne-tosphere. Similarly, (Gurnett et al., 2002) found enhanced HOM intensity simultaneously captured by Cassini and Galileo simultaneously with an increase in Jupiter’s extreme UV auroral brightness observed from Cassini in late December 2000. They related these observations to the effects of an interplanetary shock observed from Cassini and Galileo, which further propagated to Jupiter. In contrast, on the basis of the FUV auroral ob-servations from the Hubble Space Telescope (HST) on 11 January 2014, (Gray et al., 2016) found a significant poleward expanded spot of main oval emission (exceeding 6.8 MegaRayleigh) in connection with the amplification of non-Io-DAM and HOM observed by the Wind spacecraft near Earth. This transient event was interpreted as a signature of inward plasma transport into the Jovian polar regions since there was no prediction of the arrival of an interplanetary shock at Jupiter at the corresponding time. This may be a part of the magnetospheric processes that occur in response to magnetic reconnection at the distant magnetodisk, the increase of the HOM radio intensity, and the generation of the narrowband kilometric radiation associated with particle injections in the Io plasma torus (Louarn, Paranicas, & Kurth, 2014). However, investigating these global dynamics is the outside of the scope in this paper. It is noteworthy that a link between bKOM and the UV aurora has not been previously investigated.
Imaging Jupiter’s aurora at radio frequencies is challenging due to the anisotropic nar-row beam of the auroral radiation and restricted angular resolution from terrestrial radio
hith-erto provided bKOM radio source locations and beaming properties (Ladreiter, Zarka, & Lecacheux, 1994 ; Imai et al., 2017a, 2017b ; Kurth, Imai, Hospodarsky, Gurnett, Louarn, et al., 2017 ; Kurth, Imai, Hospodarsky, Gurnett, Tetrick, et al., 2017). The Ulysses direction-finding (DF) study by (Ladreiter et al., 1994) first showed that the southern bKOM radiation at 81 and 100 kHz originates from auroral regions. Later, (Imai et al., 2017a) used Juno’s DF capability to investigate the northern bKOM radiation from 10 to 142 kHz, finding that M values (Szalay et al., 2017) of these radio sources range from 50 to 60, compared to M = 5–58 (Ladreiter et al., 1994). They also found that the mean cone
half-angle extends from 40◦ to 55◦, consistent with that of 30◦ to 80◦ based on the Ulysses
study (Ladreiter et al., 1994). Furthermore, these bKOM radio sources mapped along magnetic field lines onto the Jovian northern atmosphere (Imai et al., 2017b) are close to the inner edge of the statistical UV main oval locations collected by HST (Bonfond, Saur, et al., 2017), in good agreement with the Juno magnetic footprints during near-source crossings (Kurth, Imai, Hospodarsky, Gurnett, Louarn, et al., 2017 ; Kurth, Imai, Hospo-darsky, Gurnett, Tetrick, et al., 2017). However, Jovian UV auroras are known to be complex and time-dependent phenomena (Ballester et al., 1996), and a direct relationship between bKOM radio source footprints and UV main oval remained unclear.
The purpose of this paper is to present the first results of concurrent aurora observations in both the northern and southern hemispheres at radio and UV wavelengths with high spatial resolution from Juno’s vantage point using data from three polar surveys. We examine the exact locations of bKOM radio source footprints associated with the Jovian UV main oval, providing new information on conditions forming bKOM radio sources.
2. Observations and Analysis
Since 5 July 2016, the Juno spacecraft has toured Jupiter in a 53-day eccentric polar orbit (Bolton et al., 2017). During each perijove survey, Juno has monitored complex auroral activity at radio and UV wavelengths by means of the radio and plasma wave in-strument (Waves) (Kurth, Hospodarsky, et al., 2017) and the UV spectrograph inin-strument (Juno-UVS) (Gladstone et al., 2017). In contrast to continuous Jovian radio monitoring from Waves, Juno-UVS data is typically collected for time span of ∼10 hours centered at perijove. In this study, we analyze simultaneous Waves and Juno-UVS data obtained for time spans of 2 hours over both hemispheres during perijoves 4 (PJ4) on 2 February, PJ5 on 27 March, and PJ6 on 19 May 2017, which are well-suited to probe both bKOM radio sources and UV auroras at the same or similar times.
Waves uses three onboard receivers to monitor the electric fields of waves from 50 Hz to 41 MHz with an electric dipole antenna and the magnetic fields of waves from 50 Hz to 20 kHz with a magnetic search coil sensor (Kurth, Hospodarsky, et al., 2017). One Low Frequency Receiver (LFR) and two redundant High Frequency receivers (HFR) acquire five different bands to record an entire frequency range of 50 Hz to 41 MHz. For the present study, we use only the higher frequency band of the LFR (LFRH) with the sample interval of 1 s. The LFRH band consists of 18 approximately logarithmically-spaced frequency channels from 20 kHz to 142 kHz, covering the low-frequency part of the bKOM radio spectrum.
In order to produce an auroral image at radio frequencies, we use a direct method (find-ing auroral radio source cross(find-ings along Juno’s polar trajectory) (Kurth, Imai,
Hospo-darsky, Gurnett, Louarn, et al., 2017 ; Kurth, Imai, HospoHospo-darsky, Gurnett, Tetrick, et al., 2017 ; Louarn et al., 2017) and an indirect DF method (measuring the k vectors of incoming waves) (Imai et al., 2017a, 2017b). The former method identifies a potential radio source crossing by comparing the lower edge of the observed emission frequency with the local electron cyclotron frequency based on Juno’s onboard magnetometer (Connerney et al., 2017). In the latter method, we employ the short dipole approximation to deter-mine in two dimensions the direction of arrival of incoming waves below 5 MHz (Sampl et al., 2016). The three-dimensional locations of Jovian radio sources are determined for intersections of points with the R-X cutoff surface using models for Jupiter’s plasma and magnetic field (Imai et al., 2015). A full description of Juno’s DF method can be found in (Imai et al., 2017a). Here, the magnetic field model is used as a combination of the JRM09 internal magnetic field (Connerney et al., 2018) and a washer-shaped current
sheet (Connerney, Acu˜na, & Ness, 1981). Using this combination model, M value gives
the equatorial crossing distance of a field line. Hence, these radio sources deduced from the direct and DF methods can be independently mapped along magnetic field lines onto a surface 400 km altitude above the 1-bar level of Jupiter’s atmosphere.
Juno-UVS is designed to image and obtain spectra in a wavelength range from 68 to 210 nm with a 4 cm by 4 cm aperture, where the field of view of a flat scan mirror is
adjustable within ± 30◦ with respect to the Juno’s spin plane (Gladstone et al., 2017).
The photon-counting spectrograph has a dog-bone shaped field of view, 0.2◦ × 2.55◦,
0.025◦ × 2.0◦, and 0.2◦ × 2.55◦. Juno-UVS continuously takes data as the spacecraft
with spatial coverage dependent on the scan mirror position (allowing Juno-UVS to look
up to 30◦ fore or aft of the spin plane), the orientation of Juno’s spin axis, and the
range from Jupiter which changes drastically over the 10 hours centered on perijove. The UV aurora brightness in kiloRayleigh (kR) is computed by integrating spectra over wavelengths of 115–118 nm and 125–165 nm and then multiplying by 2.5 (a model-derived
scale factor to account for emissions over the entire 80–175 nm range of H2 band FUV
auroral emissions). Another useful map is the auroral brightness at 158–162 nm divided by the auroral brightness at 126–130 nm (Bonfond, Gladstone, et al., 2017). While the UV brightness is a measure of the total energy flux of the precipitating particles responsible for the aurora, the brightness ratio provides a measure of the mean energy of those particles (more energetic particles penetrate deeper into Jupiter’s upper atmosphere, and their UV emissions are more absorbed at shorter wavelengths by methane and other hydrocarbons, resulting in a larger UV color ratio). All of the UV auroras are projected onto a surface 400 km above the 1 bar level (Clarke et al., 1998).
3. Northern bKOM-UV Auroras
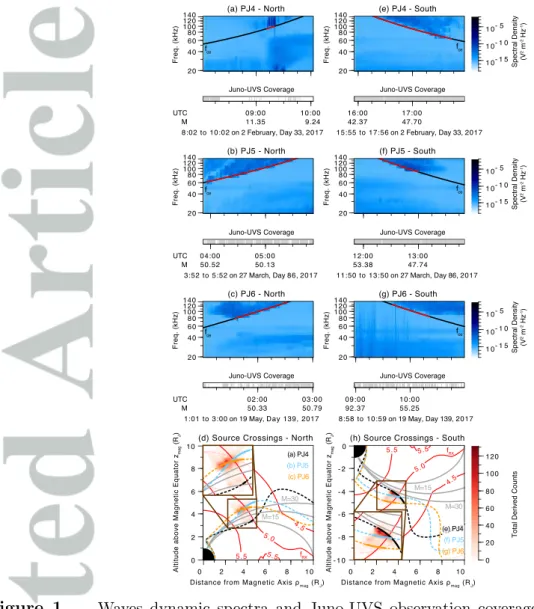
Figures 1a–c show the Waves dynamic spectra over the northern hemisphere of Jupiter from PJ4 through PJ6, dominated by strong bKOM radio emissions. The events where
the lower edge of bKOM radio frequency was close to fce are interpreted as Juno crossings
of a number of individual bKOM radio sources situated along auroral magnetic field lines
(i.e. the Waves direct method). These events are highlighted as the red fce lines in Figures
1a–c. For each geometrical configuration, the Juno trajectories for PJ4, PJ5, and PJ6 in Jovimagnetic cylindrical coordinates are shown as the black, blue, and orange dashed
curves, respectively, in Figure 1d. The solid curves correspond to the potential bKOM radio source crossings identified from the Waves direct method. On the other hand, the locations of all bKOM radio sources from PJ4 through PJ6 derived using the Waves DF
method are projected onto the 287◦ System III longitude plane (where the Jovicentric
equator coincides with the JRM09 dipole equator) in the same figure. The total derived counts for points intersecting with the k vectors and R-X cutoff frequency surfaces are
sorted into bins of 0.2 Jovian radii (RJ). Briefly, the statistical bKOM radio source
locations based on the Waves DF method in the Jovimagnetic cylindrical coordinates match Juno’s crossing events found with the direct method. The bKOM radio source parameters derived from both methods are outlined in Table 1.
The bKOM radio source locations and properties for the PJ4 north event are different from those for the PJ5 and PJ6 north events. The transit time for crossing the northern bKOM source region for Juno’s PJ4, 9 min, is much shorter than those for PJ5 (97 min) and for PJ6 (57 min). The estimated magnetic M values from the Waves direct and DF methods yield 10 to 12 for the PJ4 north pass, significantly lower than for the PJ5 north event at M = 44–56 and PJ6 north event at M = 22–52 as shown in Table 1. These M values are within the estimates of the Ulysses bKOM DF study at M = 5–58 (Ladreiter et al., 1994), but only PJ5 and PJ6 events are in agreement with those of the initial Juno bKOM studies (Imai et al., 2017a, 2017b ; Kurth, Imai, Hospodarsky, Gurnett, Louarn, et al., 2017 ; Kurth, Imai, Hospodarsky, Gurnett, Tetrick, et al., 2017) at M = 50–60. Another possibility for the PJ4 north event is a response to transient diffusive injections toward the Io plasma torus (Louarn et al., 2014).
Meanwhile, Juno-UVS was able to capture 58, 201, and 137 spins worth of northern auroral data during the time spans of the Waves observations in Figures 1a–c for PJ4, PJ5, and PJ6, respectively. The timing for these data are organized as gray bars in Figures 1a–c. Each Juno-UVS spin observation provides an ∼17 ms integration of just a fragment of Jupiter’s UV aurora image for brightness and color ratio with temporal cadence of the spin period of Juno (about 30 s). By integrating these fragments over time, complete images of the northern auroral regions in the UV can be produced. These UV aurora images on the northern hemisphere are summarized in Figures 2a–f. In Figures 2a–c, the red curves indicate the potential bKOM radio source footprints estimated from the Waves direct method, which reasonably coincide with those derived from the Waves DF method represented by the small yellow dots.
To further investigate the spatial variations of the UV main auroral oval activities con-necting to bKOM radio sources, we have extracted the peak non-spin modulated intensity
of bKOM at fce captured from Waves, and obtained the UV aurora brightness and color
ratio from the Juno-UVS integrated images taken from Figures 2a–f. The UV aurora
parameters were median values of 3 bins by 3 bins, where each bin was assigned 0.5◦ in
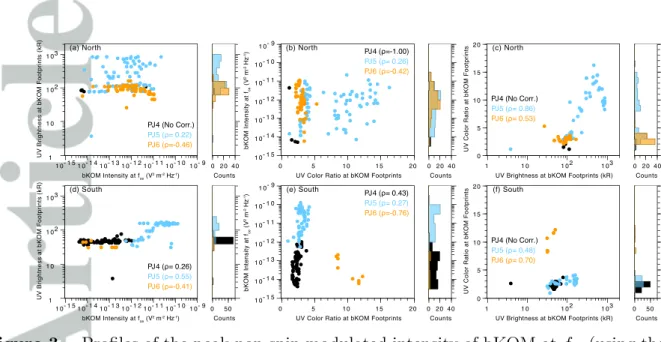
latitude and longitude, centered at the bKOM footprints. Additionally, we computed the Spearman’s rank correlation coefficient ρ, which is given only higher than a significant threshold (p-value for the null hypothesis of no correlations between two data set). Given that the position of the UV main oval did not change for 2 hours, spatial variations of the UV brightness and color ratio at the footprints of the northern bKOM radio sources as well as those of the bKOM intensity are provided in Figures 3a–c. In Figures 3a and 3b,
the PJ5 north event shows weak positive correlations, while moderate negative correla-tions appear for the PJ6 north event. For the PJ4 north event, the bKOM radio intensity is negatively correlated with the UV color ratio albeit for a very small number of points. Among the perijoves studied here, the PJ5 north event is the most outstanding UV
main oval emission. In Table 1, the bKOM radio source footprints range from 177◦ to
211◦ System III longitude, covering the inner edge of the UV main oval with high values
of brightness and color ratio. Also, a positive correlation between the UV brightness and color ratio was prominent at ρ = 0.86 in Figure 3c. As mentioned above, a higher the color ratio emission indicates that the UV emissions come from greater depth in Jupiter’s atmosphere, and are thus produced by higher energy electrons. The PJ6 north event has a similar longitudinal extent as the PJ5 north event but is less bright, as qualitatively indicated by the lower ρ in Figure 3c. Although there is no correlation for the PJ4
north event, their bKOM radio source footprints are between 273◦ and 301◦, and the
corresponding auroral crossings are near outer edge of the UV main oval.
4. Southern bKOM-UV Auroras
Like Juno’s perijove north events, the intense southern bKOM radiation was clearly captured in the Waves spectrograms in an interval of 2 h after PJ4, PJ5, and PJ6 in Figures 1e–g. The Waves direct method identified potential bKOM radio source crossings
in the time showing red fce lines by comparing the bottom frequency of the radiation with
local fce. The corresponding regions are also depicted in the Jovian magnetic coordinates,
values for their bKOM radio sources range from 20 to 61, which agree with the previous estimates (Ladreiter et al., 1994 ; Imai et al., 2017a, 2017b ; Kurth, Imai, Hospodarsky, Gurnett, Louarn, et al., 2017 ; Kurth, Imai, Hospodarsky, Gurnett, Tetrick, et al., 2017). Results from the southern bKOM radio source analysis are listed in Table 1.
During the analyzed intervals, Juno-UVS collected 235, 236, and 150 spin images for the PJ4, PJ5, and PJ6 south events in the gray bars of Figure 1e–g, providing good spatial and temporal coverage. These observations yield the integrated UV images for brightness in Figures 2g–i and color ratio in Figures 2j–l, though at relatively low spatial resolution
given the distance Juno was from the center of Jupiter, 4.7–6.9 RJ. Overall, all of the
southern bKOM radio source footprints using the Waves direct and DF methods, again, match the locations of the UV main oval. Interestingly, the bKOM radio source footprints for the PJ6 south event intersect with a major aurora event that produced a bulge in the
main auroral activity in the longitude range of 75◦ to 103◦. These regions include the
high brightness in Figure 2i and high color ratio in Figure 2l.
The quantitative associations of the bKOM radio intensity at fce and the UV main
oval brightness and color ratio within the southern bKOM radio source footprints were computed on the basis of Juno-UVS 2-hour integrated images in Figure 2g–l and bKOM radio images from the Waves direct method. The results are shown in Figures 3d–f. For the PJ4 and PJ5 south events, the bKOM radio intensity is positively correlated with both brightness and color ratio of the UV main oval in Figures 3d and 3e. On the contrary, the PJ6 south event shows negative correlations. In Figure 3f, the PJ5 and PJ6 south
events indicate positive correlations between the UV main oval brightness and color ratio, although the PJ4 south event shows no correlation.
5. Discussion
We presented simultaneous observations of auroras at radio and ultraviolet (UV) wave-lengths as observed from Juno during perijoves 4 through 6 over both hemispheres of Jupiter. Using Jovian radio observations and UV aurora images taken at the same or similar times, we confirmed that broadband kilometric (bKOM) radio sources are tied to the UV main oval, which was originally suggested by the Ulysses radio direction-finding (DF) study (Ladreiter et al., 1994) and the initial Juno radio DF and in-situ studies (Kurth, Imai, Hospodarsky, Gurnett, Louarn, et al., 2017 ; Kurth, Imai, Hospodarsky, Gurnett, Tetrick, et al., 2017 ; Imai et al., 2017a, 2017b) but without concurrent UV aurora observations.
The peak non-modulated intensity of bKOM at the local electron cyclotron frequency indicated positive, negative, and no correlations with the UV main oval brightness and color ratio within their radio source footprints. The PJ5 north and south events and the PJ4 south event have positive correlations, in good agreement with the early studies from the Earth-based coordinated Jovian radio-UV aurora observations in the outstanding UV
aurora events (Prang´e et al., 1993 ; Gray et al., 2016). The physical interpretation of this
connection is that the weakly relativistic down-going electrons (below several tens of keV) traveling along magnetic field lines are enhanced due to either externally or internally
(such as a loss cone or shell distribution) that drives intense bKOM intensity (Wu & Lee, 1979) and an increase in the UV auroral emissions due to increased precipitation of the down-going electrons into Jupiter’s upper atmosphere. In contrast, the PJ6 north and south events show negative correlations. Additionally, the relationship between bKOM intensity and UV color ratio for the PJ4 north event shows a similar trend, although the other relationships indicated no correlation. The interpretation of these results is not clear because the energy transfer from electrons to waves is typically smaller than the total amount of electron precipitated energy. A possibility to account for the negative correlations is the case in which the bKOM radio sources that Juno crossed were decaying due to abated wave-particle interactions. Analyzing more events may be statistically valuable but will be a further study. Overall, the Spearman’s rank correlation analysis using Jovian radio-UV aurora observations for the positive correlation events suggests the existence of wave-particle energy transport along the common magnetic field lines between the bKOM radio sources and the UV main oval.
Acknowledgments. The authors are grateful to all members of the Juno mission team, especially the engineers and staff of the Waves and Juno-UVS instruments. The research at the University of Iowa was supported by NASA through Contract 699041X with the Southwest Research Institute. All of the data used in this article are publicly accessible through the Planetary Data System (https://pds.nasa.gov).
R´ef´erences
Ballester, G. E., Clarke, J. T., Trauger, J. T., Harris, W. M., Stapelfeldt, K. R., Crisp, D.Westphal, J. A. (1996). Time-resolved observations of Jupiter’s far-ultraviolet
aurora. Science, 274 (5286), 409–413. 10.1126/science.274.5286.409
Bolton, S. J., Lunine, J., Stevenson, D., Connerney, J. E. P., Levin, S., Owen,
T. C.Thorpe, R. (2017, 01 Nov). The Juno mission. Space Sci. Rev., 213 (1),
5–37. 10.1007/s11214-017-0429-6
Bonfond, B., Gladstone, G. R., Grodent, D., Greathouse, T. K., Versteeg, M. H., Hue, V.Kurth, W. S. (2017). Morphology of the UV aurorae Jupiter during Juno’s first per-ijove observations. Geophys. Res. Lett., 44 (10), 4463–4471. 10.1002/2017GL073114 Bonfond, B., Saur, J., Grodent, D., Badman, S. V., Bisikalo, D., Shematovich, V.Radioti,
A. (2017). The tails of the satellite auroral footprints at Jupiter. J. Geophys. Res.
Space Physics, 122 , 7985–7996. 10.1002/2017JA024370
Carr, T. D., Desch, M. D., & Alexander, J. K. (1983). Phenomenology of magnetospheric radio emissions. In A. J. Dessler (Ed.), Physics of the jovian magnetosphere (pp. 226– 284). New York : Cambridge Univ. Press.
Clarke, J. T., Ballester, G., Trauger, J., Ajello, J., Pryor, W., Tobiska, K.Grard, J.-C. (1998). Hubble Space Telescope imaging of Jupiter’s UV aurora during the Galileo or-biter mission. J. Geophys. Res. Planets, 103 (E9), 20217–20236. 10.1029/98JE01130 Clarke, J. T., Grodent, D., Cowley, S. W. H., Bunce, E. J., Zarka, P., Connerney, J. E. P.,
& Satoh, T. (2004). Jupiter’s aurora. In F. Bagenal, T. E. Dowling, & W. B. McK-innon (Eds.), Jupiter: The planet, satellites and magnetosphere (pp. 639–670). New York : Cambridge Univ. Press.
Connerney, J. E. P., Acu˜na, M. H., & Ness, N. F. (1981). Modeling the Jovian current
8384. 10.1029/JA086iA10p08370
Connerney, J. E. P., Benn, M., Bjarno, J. B., Denver, T., Espley, J., Jorgensen, J. L.Smith, E. J. (2017). The Juno magnetic field investigation. Space Sci. Rev., 213 , 39–138. 10.1007/s11214-017-0334-z
Connerney, J. E. P., Kotsiaros, S., Oliversen, R. J., Espley, J. R., Joergensen, J. L., Joergensen, P. S.Levin, S. M. (2018). A new model of Jupiter’s magnetic field from Juno’s first nine orbits. Geophys. Res. Lett., 45 , 2590–2596. 10.1002/2018GL077312 Gladstone, G. R., Persyn, S. C., Eterno, J. S., Walther, B. C., Slater, D. C., Davis,
M. W.Denis, F. (2017). The ultraviolet spectrograph on NASA’s Juno mission. Space Sci. Rev., 213 , 447–473. 10.1007/s11214-014-0040-z
Gray, R. L., Badman, S. V., Bonfond, B., Kimura, T., Misawa, H., Nichols, J. D.Ray, L. C. (2016). Auroral evidence of radial transport at Jupiter during January 2014.
J. Geophys. Res. Space Physics, 121 (10), 9972–9984. 10.1002/2016JA023007
Gurnett, D. A., Kurth, W. S., Hospodarsky, G. B., Persoon, A. M., Zarka, P., Lecacheux,
A.Dougherty, M. K. (2002, f´evrier). Control of Jupiter’s radio emission and aurorae
by the solar wind. Nature, 415 , 985–987. 10.1038/415985a
Imai, M., Imai, K., Higgins, C. A., & Thieman, J. R. (2011). Comparison between Cassini and Voyager observations of Jupiter’s decametric and hectometric radio emissions. J. Geophys. Res. Space Physics, 116 (A12), A12233. 10.1029/2011JA016456
Imai, M., Kurth, W. S., Hospodarsky, G. B., Bolton, S. J., Connerney, J. E. P., &
Levin, S. M. (2017a). Direction-finding measurements of Jovian low-frequency
10.1002/2017GL072850
Imai, M., Kurth, W. S., Hospodarsky, G. B., Bolton, S. J., Connerney, J. E. P., Levin, S. M.Lamy, L. (2017b). Analysis of Jovian low-frequency radio emissions based on stereoscopic observations with Juno and Earth-based radio telescopes. In G. Fischer, G. Mann, M. Panchenko, & P. Zarka (Eds.), Planetary radio emissions viii (pp. 13–23). Vienna. 10.1553/PRE8s13
Imai, M., Lecacheux, A., Clarke, T. E., Higgins, C. A., Panchenko, M., Dowell, J.Konovalenko, A. A. (2016). The beaming structures of Jupiter’s decametric com-mon S-bursts observed from the LWA1, NDA, and URAN2 radio telescopes. Astro-phys. J., 826 (2), 176. 10.3847/0004-637X/826/2/176
Imai, M., Lecacheux, A., Moncuquet, M., Bagenal, F., Higgins, C. A., Imai, K., &
Thieman, J. R. (2015). Modeling Jovian hectometric attenuation lanes during
the Cassini flyby of Jupiter. J. Geophys. Res. Space Physics, 120 (3), 1888–1907. 10.1002/2014JA020815
Kurth, W. S., Hospodarsky, G. B., Gurnett, D. A., Lecacheux, A., Zarka, P., Desch, M. D.Farrell, W. M. (2001). High-resolution observations of low-frequency Jovian radio emissions by Cassini. In H. O. Rucker, M. L. Kaiser, & Y. Leblanc (Eds.), Planetary radio emissions v (pp. 15–28). Vienna.
Kurth, W. S., Hospodarsky, G. B., Kirchner, D. L., Mokrzycki, B. T., Averkamp, T. F., Robison, W. T.Zarka, P. (2017, 10 Jul). The Juno Waves investigation. Space Sci. Rev., 213 , 347–392. 10.1007/s11214-017-0396-y
P. (2017). A new view of Jupiter’s auroral radio spectrum. Geophys. Res. Lett., 44 ,
7114–7121. 10.1002/2017GL072889
Kurth, W. S., Imai, M., Hospodarsky, G. B., Gurnett, D. A., Tetrick, S. S., Ye, S.-Y.Levin, S. M. (2017). First observations near Jupiter by the Juno Waves investi-gation. In G. Fischer, G. Mann, M. Panchenko, & P. Zarka (Eds.), Planetary radio emissions viii (pp. 1–12). Vienna. 10.1553/PRE8s1
Ladreiter, H. P., Zarka, P., & Lecacheux, A. (1994). Direction finding study of Jovian hectometric and broadband kilometric radio emissions: Evidence for their auroral origin. Planet. Space Sci., 42 (11), 919 - 931. 10.1016/0032-0633(94)90052-3
Louarn, P., Allegrini, F., McComas, D. J., Valek, P. W., Kurth, W. S., Andr´e, N.Zink,
J. L. (2017). Generation of the jovian hectometric radiation: First lessons from Juno.
Geophys. Res. Lett., 44 (10), 4439–4446. 10.1002/2017GL072923
Louarn, P., Paranicas, C. P., & Kurth, W. S. (2014). Global magnetodisk disturbances and energetic particle injections at Jupiter. J. Geophys. Res. Space Physics, 119 (6), 4495–4511. 10.1002/2014JA019846
Prang´e, R., Zarka, P., Ballester, G. E., Livengood, T. A., Denis, L., Carr, T.Moos,
H. W. (1993). Correlated variations of UV and radio emissions during an out-standing Jovian auroral event. J. Geophys. Res. Planets, 98 (E10), 18779–18791. 10.1029/93JE01802
Sampl, M., Macher, W., Oswald, T., Plettemeier, D., Rucker, H. O., & Kurth, W. S.
(2016). Juno model rheometry and simulation. Radio Sci., 51 (10), 1627–1635.
Szalay, J. R., Allegrini, F., Bagenal, F., Bolton, S., Clark, G., Connerney, J. E. P.Wilson, R. J. (2017). Plasma measurements in the Jovian polar region with Juno/JADE. Geophys. Res. Lett., 44 (14), 7122–7130. 10.1002/2017GL072837
Wu, C. S., & Lee, L. C. (1979, juin). A theory of the terrestrial kilometric radiation. Astrophys. J., 230 , 621–626. 10.1086/157120
Zarka, P. (1998). Auroral radio emissions at the outer planets: Observations and theories. J. Geophys. Res. Planets, 103 (E9), 20159–20194. 10.1029/98JE01323
Zarka, P. (2004). Fast radio imaging of jupiter’s magnetosphere at low-frequencies with LOFAR. Planet. Space Sci., 52 (15), 1455–1467. 10.1016/j.pss.2004.09.017
Zarka, P., Cecconi, B., & Kurth, W. S. (2004). Jupiter’s low-frequency radio spec-trum from Cassini/Radio and Plasma Wave Science (RPWS) absolute flux density measurements. J. Geophys. Res. Space Physics, 109 (A9). 10.1029/2003JA010260
Table 1. bKOM Radio Source Parameters From Waves Direct and DF Methods
M Projected System III Longitude
onto 400 km above 1-bar Atmosphere
Events Direct Methoda DF Methodb Direct Methoda DF Methodb
PJ4 North 10–11 10–12 279◦–286◦ 273◦–301◦ PJ5 North 44–51 46–56 177◦–211◦ 177◦–209◦ PJ6 North 50–51 22–52 165◦–181◦ 163◦–181◦ PJ4 South 41–51 32–52 225◦–287◦ 227◦–283◦ PJ5 South 48–51 20–50 105◦–136◦ 107◦–167◦ PJ6 South 52–61 52–60 75◦–94◦ 77◦–103◦
a The data were taken between the start and stop time of Juno’s source crossings.
b The 94% of the M distribution and 96–97% of the projected longitude
distribution around the center of histograms for each event lie within the indicated range.
(a) PJ4 - North (e) PJ4 - South
Juno-UVS Coverage Juno-UVS Coverage
(b) PJ5 - North (f) PJ5 - South
Juno-UVS Coverage Juno-UVS Coverage
(c) PJ6 - North (g) PJ6 - South
Juno-UVS Coverage Juno-UVS Coverage
4.5 5.0 5.5 5.5
(d) Source Crossings - North
4.5 5.0
5. 5 5.5
(h) Source Crossings - South 20 40 60 80 100 120 140 F re q . (k H z ) 20 40 60 80 100 120 140 F re q . (k H z ) 09:00 11.35 10:00 9.24 8:02 to 10:02 on 2 February, Day 33, 2017 16:00 42.37 17:00 47.70 15:55 to 17:56 on 2 February, Day 33, 2017 20 40 60 80 100 120 140 F re q . (k H z ) 20 40 60 80 100 120 140 F re q . (k H z ) 04:00 50.52 05:00 50.13 3:52 to 5:52 on 27 March, Day 86, 2017 12:00 53.38 13:00 47.74 11:50 to 13:50 on 27 March, Day 86, 2017 20 40 60 80 100 120 140 F re q . (k H z ) 20 40 60 80 100 120 140 F re q . (k H z ) 02:00 50.33 03:00 50.79 1:01 to 3:00 on 19 May, Day 139, 2017 09:00 92.37 10:00 55.25 8:58 to 10:59 on 19 May, Day 139, 2017 0 2 4 6 8 10
Distance from Magnetic Axis ρmag (RJ) 0 2 4 6 8 10 A lt it u d e a b o v e M a g n e ti c E q u a to r zma g (R J ) 0 2 4 6 8 10
Distance from Magnetic Axis ρmag (RJ) 0 - 2 - 4 - 6 - 8 - 1 0 A lt it u d e a b o v e M a g n e ti c E q u a to r zma g (R J ) 1 0- 1 5 1 0- 1 0 1 0- 5 Sp e ct ra l D e n si ty (V 2 m -2 H z -1) 1 0- 1 5 1 0- 1 0 1 0- 5 Sp e ct ra l D e n si ty (V 2 m -2 H z -1) 1 0- 1 5 1 0- 1 0 1 0- 5 Sp e ct ra l D e n si ty (V 2 m -2 H z -1) 0 20 40 60 80 100 120 (a) PJ4 (b) PJ5 (c) PJ6 M=30 M=15 M=15 M=30 M UTC M UTC M UTC fce fce fce fce fce fce (e) PJ4 (f) PJ5 (g) PJ6 T o ta l D e ri ve d C o u n ts fRX fRX
Figure 1. Waves dynamic spectra and Juno-UVS observation coverage for 2-h time spans from
perijoves 4 through 6, and the locations of Juno and bKOM radio sources in Jovimagnetic coordinates. (a–d) The analyzed events in the northern hemisphere and (e–h) southern hemisphere are summarized, in addition to gray bars indicating Juno-UVS data availability. The black lines in the spectrograms correspond to the local electron cyclotron frequencies, superimposed with potential radio source crossings in the red lines. In (d, h), the bKOM radio source locations deduced from the indirect direction-finding (DF) measurements are organized as a function of the altitude above the magnetic equator zmag and the
distance from magnetic axis ρmag. The red contours projected onto the 287◦ System III longitude plane
represents the R-X cutoff frequency (fRX) surface using a logarithmic scale in Hz. Juno’s trajectories
for PJ4, PJ5, and PJ6 are shown by the dashed curves in black, blue, and orange, respectively. Each solid curve indicates the location of Juno during a near-source crossing, corresponding to the red-lines in panels (a–c) northern hemisphere and for (e–g) southern hemisphere. The gray solid curves represent the JRM09-CS magnetic field lines at M =10, 15, and 30.
12:00 13:00 0o 90o PJ5 South 12:00 13:00 09:00 10:00 0 5 10 15 20 25 Color Rati o 16:00 17:00 0o 09:00 10:00 1 1 0 1 02 1 03 Brightness (kR ) 0o 90o PJ6 South 16:00 17:00 0o 90o PJ4 South (g) (h) (i) (k) (l) (j) 16:00 17:00 0o 90o PJ4 South 09:00 10:00 0o 90 PJ6 South
PJ4 South PJ5 South PJ6 South
-50o -70o -50o -70o -50o -70o -50o -70o -50o -70o -50o -70o 90o 0o 90o 0o 90o 12:00 13:00 0o 90o PJ5 South 02:00 03:00 0 5 10 15 20 25 Color Rati o 180o 90o 04:00 05:00 90o 09:00 10:00 180o 90o 02:00 03:00 1 1 0 1 02 1 03 Brightness (kR ) 180o 270o PJ6 North 04:00 05:00 180o 270o PJ5 North 09:00 10:00 180o 90o PJ4 North (a) (b) (c) (e) (f) (d) 09:00 10:00 180o 90o PJ4 North 04:00 05:00 180o 02:00 03:00 180o PJ6 North
PJ4 North PJ5 North PJ6 North
60o 40o 60o 40o 60o 40o 60o 40o 60o 40o 60o 40o 180o
Figure 2. (a–c, g–i) Polar projections of UV aurora brightness images and (d–f, j–l) color ratio
maps acquired from Juno-UVS. (a, d) The data for the northern auroras were collected between 8:02 and 10:02 on 2 February 2017 (PJ4), (b, e) between 3:52 and 5:52 on 27 March, 2017 (PJ5), and (c, f) between 1:01 and 3:01 on 19 May 2017 (PJ6). (g, j) The southern auroras were obtained from 15:56 to 17:56 at PJ4, (h, k) from 11:51 to 13:50 at PJ5, and (i, l) from 08:59 to 10:59 at PJ6. The statistical UV auroral ovals obtained from the Hubble Space Telescope (HST) (Bonfond, Saur, et al., 2017) are plotted by the white solid curves in (a–c, g–i) and the black solid curves in (d–f, j–l). The orange curves represent Juno’s magnetic footprints during the analyzed intervals, and the red curves correspond to bKOM radio source footprints based on the Waves direct method. Additionally, the small yellow dots in the brightness intensity maps show the results of the bKOM DF method.
(a) North (b) North (c) North
(d) South (e) South (f) South
1 0- 1 51 0- 1 41 0- 1 31 0- 1 21 0- 1 11 0- 1 01 0- 9 bKOM Intensity at f ce (V 2 m-2 Hz-1) 1 1 0 1 02 1 03 U V B ri g h tn e s s a t b K O M F o o tp ri n ts ( k R ) 0 20 40 Counts 0 5 10 15 20
UV Color Ratio at bKOM Footprints 1 0- 1 5 1 0- 1 4 1 0- 1 3 1 0- 1 2 1 0- 1 1 1 0- 1 0 1 0- 9 b K O M I n te n s it y a t fce ( V 2 m -2 H z -1) 0 20 40 Counts 1 1 0 1 02 1 03
UV Brightness at bKOM Footprints (kR) 0 5 10 15 20 U V C o lo r R a ti o a t b K O M F o o tp ri n ts 0 20 40 Counts 1 0- 1 51 0- 1 41 0- 1 31 0- 1 21 0- 1 11 0- 1 01 0- 9 bKOM Intensity at fce (V2 m-2 Hz-1) 1 1 0 1 02 1 03 U V B ri g h tn e s s a t b K O M F o o tp ri n ts ( k R ) 0 50 Counts 0 5 10 15 20
UV Color Ratio at bKOM Footprints 1 0- 1 5 1 0- 1 4 1 0- 1 3 1 0- 1 2 1 0- 1 1 1 0- 1 0 1 0- 9 b K O M I n te n s it y a t fce ( V 2 m -2 H z -1) 0 20 40 Counts 1 1 0 1 02 1 03
UV Brightness at bKOM Footprints (kR) 0 5 10 15 20 U V C o lo r R a ti o a t b K O M F o o tp ri n ts 0 50 Counts PJ 4 (No Corr.) PJ 4 (ρ=-1.00) PJ 4 (No Corr.) PJ 4 (ρ= 0.26) PJ 4 (ρ= 0.43) PJ 4 (No Corr.) PJ 5 (ρ= 0.22) PJ 5 (ρ= 0.26) PJ 5 (ρ= 0.86) PJ 5 (ρ= 0.55) PJ 5 (ρ= 0.27) PJ 5 (ρ= 0.48) PJ 6 (ρ=-0.46) PJ 6 (ρ=-0.42) PJ 6 (ρ= 0.53) PJ 6 (ρ=-0.41) PJ 6 (ρ=-0.76) PJ 6 (ρ= 0.70)
Figure 3. Profiles of the peak non-spin modulated intensity of bKOM at fce (using the Waves
direct method) and UV main oval brightness and color ratio inside of (a–c) northern bKOM footprints and of (d–f) southern bKOM footprints. The cumulative probability at the minimum bKOM radio intensity is (69%, 72%, 78%) for the north events and (75%, 96%, 54%) for the south events, where the listed percentages refer to (PJ4, PJ5, and PJ6) events, respectively (see
Figure S1 in the supporting information). By selecting median values of 1.5◦ longitudes by 1.5◦
latitudes, the scatter points of the UV brightness and color ratio are directly extracted from the red curves in Figures 2a–f and 2g-l, respectively. The total counts for the ordinate variables are also sorted into a histogram next to each scatter plot. Note that the bKOM intensity does not take into account the source-to-Juno distance correction because the spacecraft is very close to the in-situ radio source. The Spearman’s rank correlation coefficient ρ is displayed for each event.